| Param | Original file | Final file |
|---|---|---|
| Filename | modeM0/AS1T05_118T01_9000005718_41921cztM0_level2.fits | modeM0/AS1T05_118T01_9000005718_41921cztM0_level2_quad_clean.evt |
| Size (bytes) | 641,557,440 | 69,304,320 |
| Size | 611.8 MB | 66.1 MB |
| Events in quadrant A | 3,966,781 | 548,975 |
| Events in quadrant B | 2,654,025 | 598,307 |
| Events in quadrant C | 3,122,778 | 548,871 |
| Events in quadrant D | 13,594,939 | 33,119 |
| Mode SS | |||
|---|---|---|---|
| Quadrant | BADHDUFLAG | Total packets | Discarded packets |
| A | 0 | 108 | 0 |
| B | 0 | 108 | 0 |
| C | 0 | 108 | 0 |
| D | 0 | 108 | 0 |
| Mode M9 | |||
|---|---|---|---|
| Quadrant | BADHDUFLAG | Total packets | Discarded packets |
| A | 0 | 27 | 0 |
| B | 0 | 27 | 0 |
| C | 0 | 27 | 0 |
| D | 0 | 28 | 0 |
| Mode M0 | |||
|---|---|---|---|
| Quadrant | BADHDUFLAG | Total packets | Discarded packets |
| A | 0 | 15205 | 3 |
| B | 0 | 11529 | 2 |
| C | 0 | 12563 | 2 |
| D | 0 | 43722 | 2 |
| Quadrant | Total seconds | Saturated seconds | Saturation percentage |
|---|---|---|---|
| A | 5266 | 348 | 6.608431% |
| B | 5266 | 27 | 0.512723% |
| C | 5266 | 259 | 4.918344% |
| D | 5266 | 5005 | 95.043676% |
Noise dominated data is calculated using 1-second bins in cleaned event files. If a bin has >2000 counts, and if more than 50% of those come from <1% of pixels, then it is considered to be noise-dominated and hence unusable.
| Quadrant | # 1 sec bins | Bins with >0 counts | Bins with >2000 counts | High rate bins dominated by noise | Noise dominated (total time) | Noise dominated (detector-on time) | Marked lightcurve |
|---|---|---|---|---|---|---|---|
| A | 7089 | 5267 | 284 | 284 | 4.01% | 5.39% | 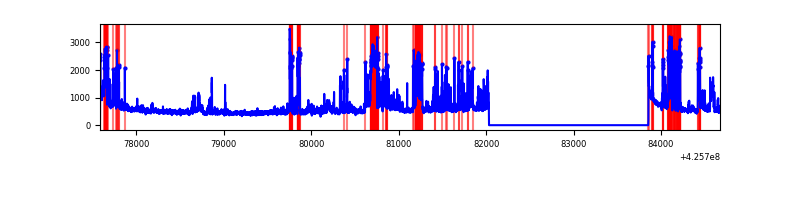 |
| B | 7089 | 5267 | 16 | 16 | 0.23% | 0.30% | 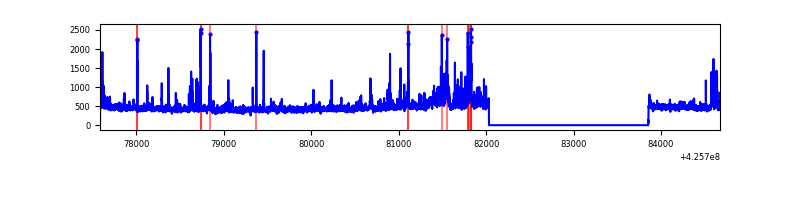 |
| C | 7089 | 5267 | 257 | 257 | 3.63% | 4.88% | 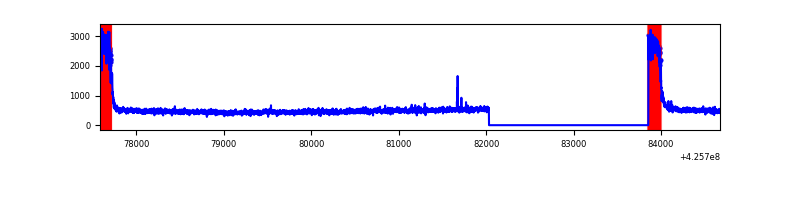 |
| D | 7089 | 5267 | 4574 | 4574 | 64.52% | 86.84% | 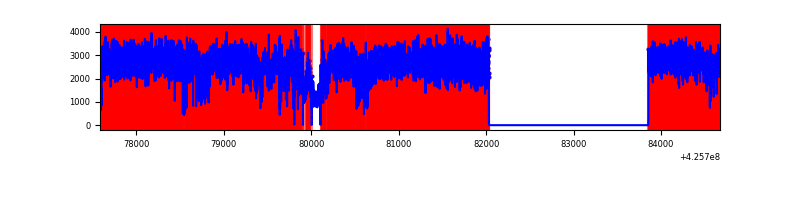 |
Top three noisy pixels from each quadrant. If the there are fewer than three noisy pixels in the level2.evt file, extra rows are filled as -1
| Pixel properties | Quadrant properties | ||||||
|---|---|---|---|---|---|---|---|
| Quadrant | DetID | PixID | Counts | Sigma | Mean | Median | Sigma |
| A | 14 | 24 | 1240849 | 10821.6 | 557 | 546 | 114.6 |
| A | 10 | 83 | 529034 | 4611.04 | 557 | 546 | 114.6 |
| A | 3 | 1 | 13900 | 116.51 | 557 | 546 | 114.6 |
| B | 0 | 190 | 117618 | 1060.67 | 571 | 555 | 110.4 |
| B | 5 | 255 | 91449 | 823.56 | 571 | 555 | 110.4 |
| B | 0 | 156 | 47296 | 423.5 | 571 | 555 | 110.4 |
| C | 0 | 10 | 762717 | 6034.02 | 540 | 544 | 126.3 |
| C | 15 | 214 | 206524 | 1630.71 | 540 | 544 | 126.3 |
| C | 0 | 15 | 38780 | 302.71 | 540 | 544 | 126.3 |
| D | 12 | 79 | 11206000 | 265121.13 | 167 | 162 | 42.3 |
| D | 13 | 249 | 1302140 | 30803.75 | 167 | 162 | 42.3 |
| D | 2 | 249 | 164168 | 3880.25 | 167 | 162 | 42.3 |
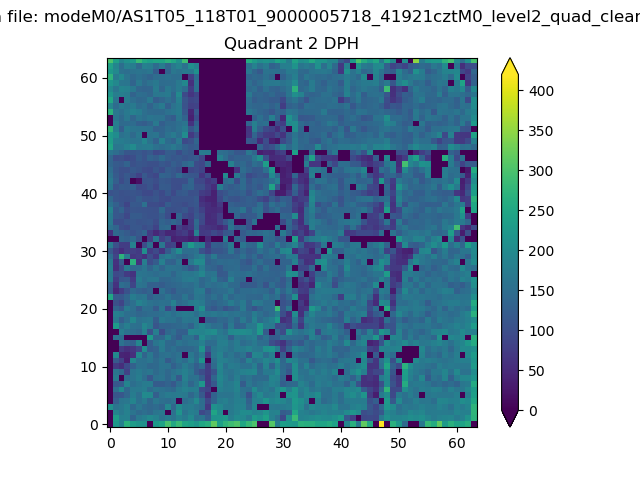
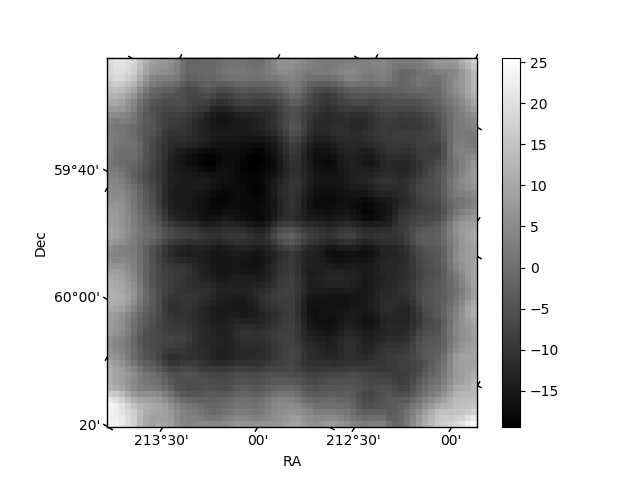
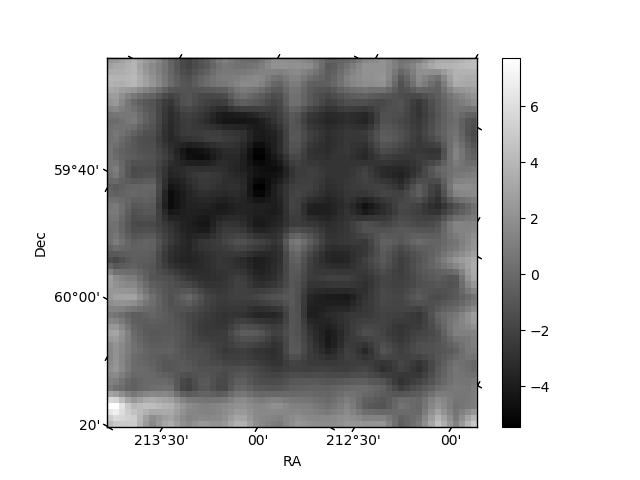
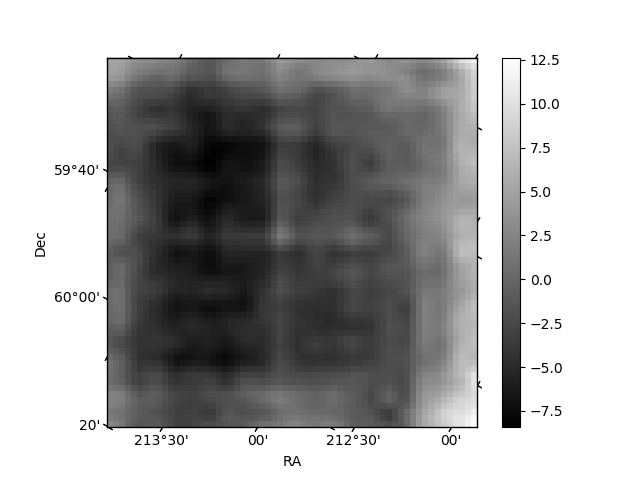
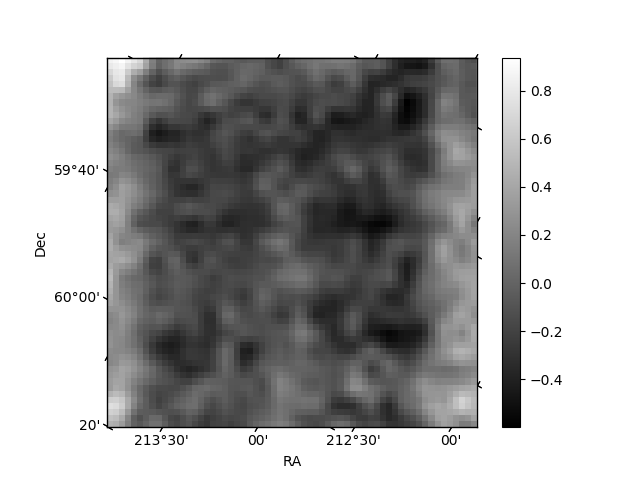
Histogram calculated using DETX and DETY for each event in the final _common_clean file
| Quadrant A | 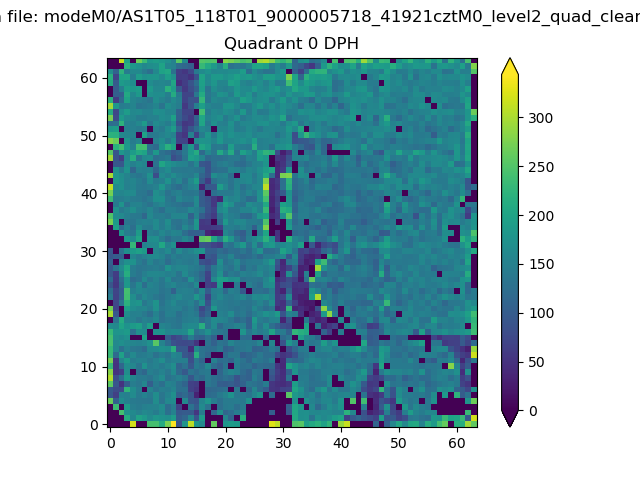 |
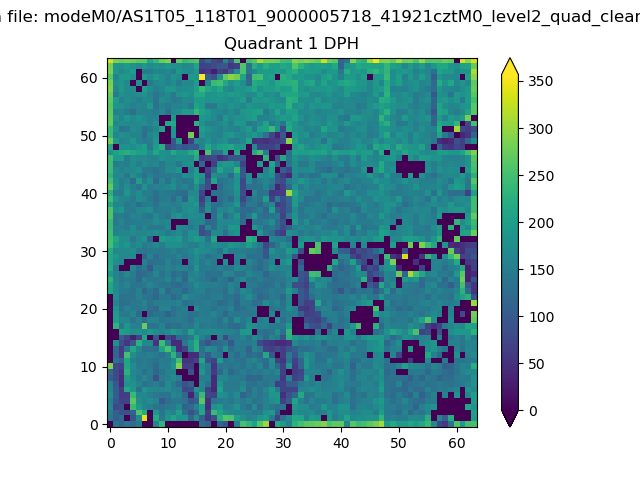 |
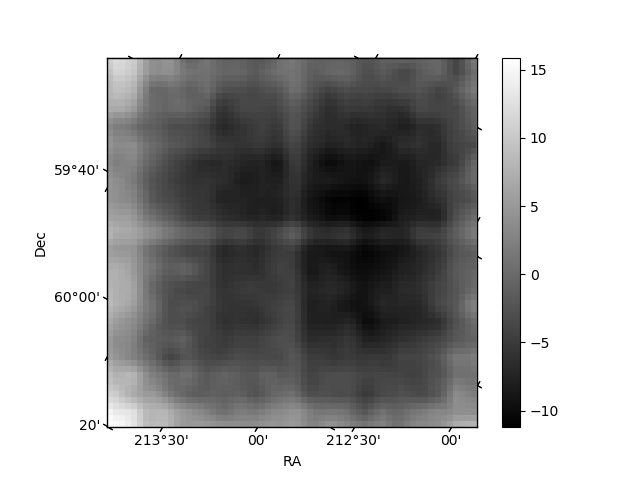
Quadrant B |
|---|---|---|---|
| Quadrant D | 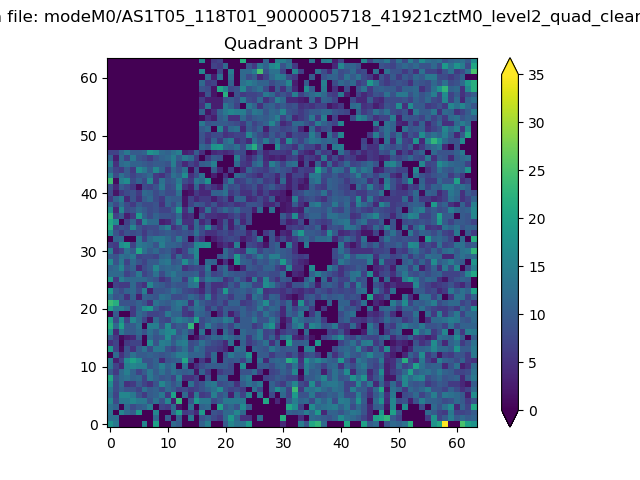 |
 |
Quadrant C |
| Plot type | Count rate plots | Images |
|---|---|---|
| Comparison with Poisson distribution Blue bars denote a histogram of data divided into 1 sec bins. Red curve is a Poisson curve with rate = median count rate of data. |
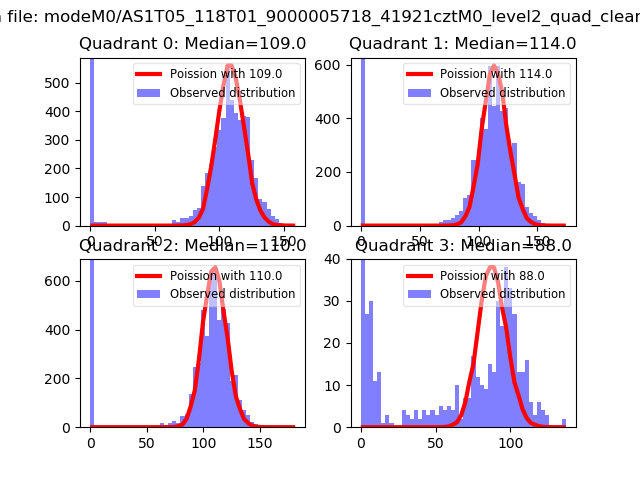 |
 |
| Quadrant-wise count rates Data is divided into 100 sec bins |
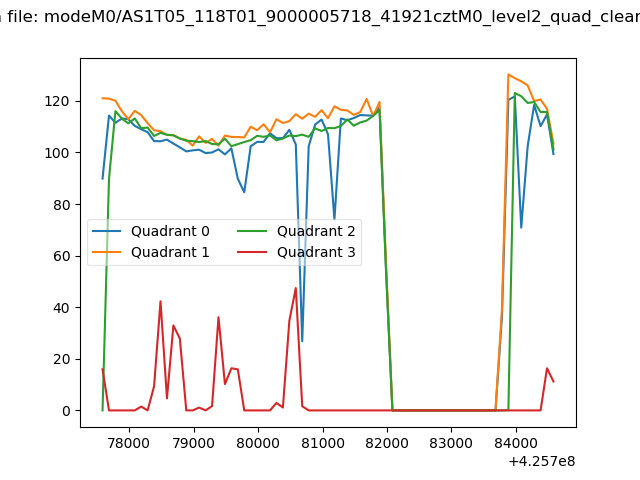 |
|
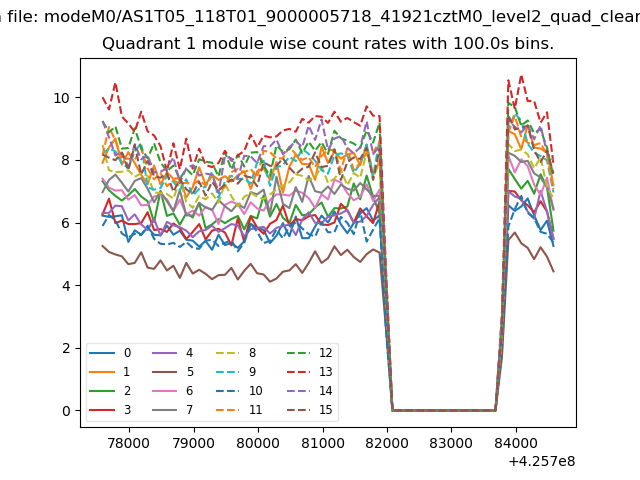
| Module-wise count rates for Quadrant A Data is divided into 100 sec bins |
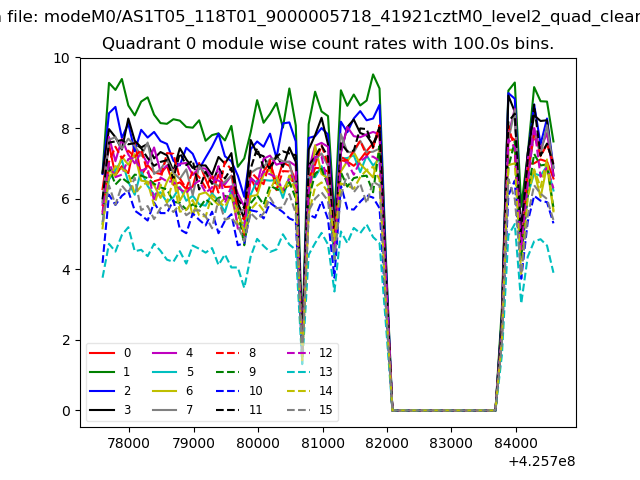 |
 |
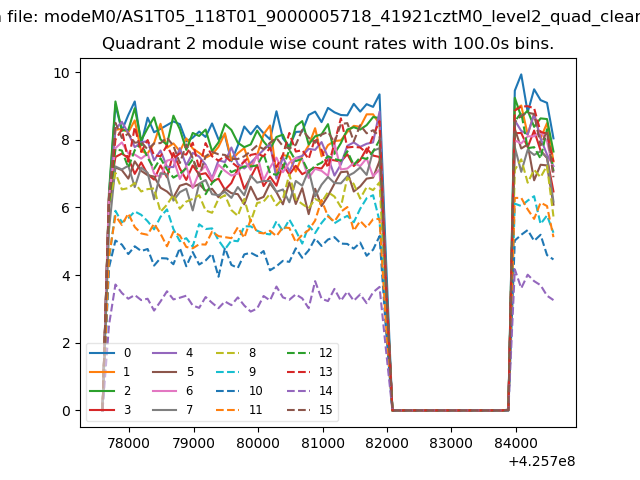
| Module-wise count rates for Quadrant B Data is divided into 100 sec bins |
 |
 |
| Module-wise count rates for Quadrant C Data is divided into 100 sec bins |
 |
 |
| Module-wise count rates for Quadrant D Data is divided into 100 sec bins |
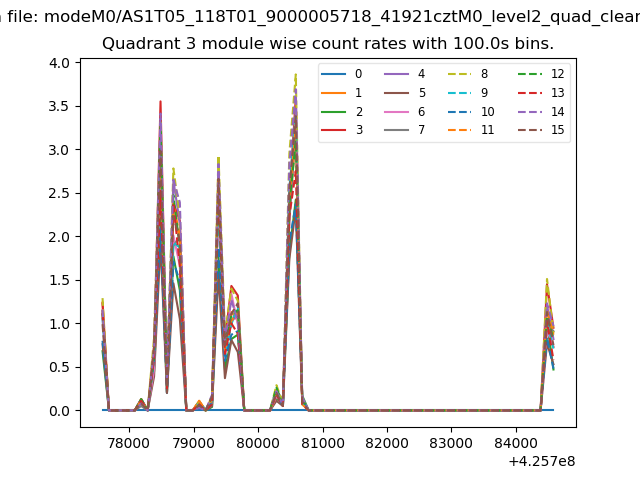 |
 |
| Parameter | Plot |
|---|---|
| CZT HV Monitor | 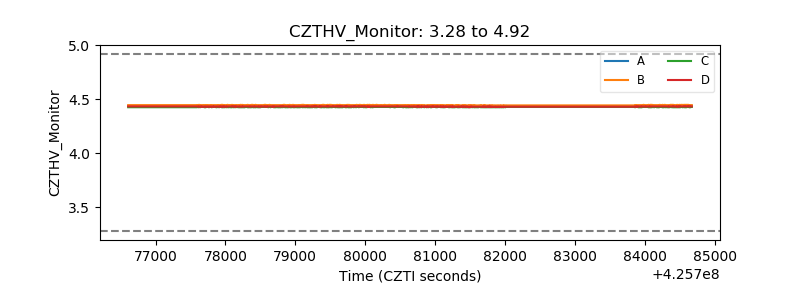 |
| D_VDD | 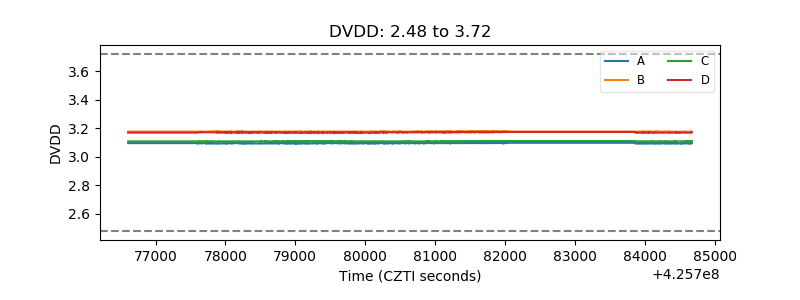 |
| Temperature 1 | 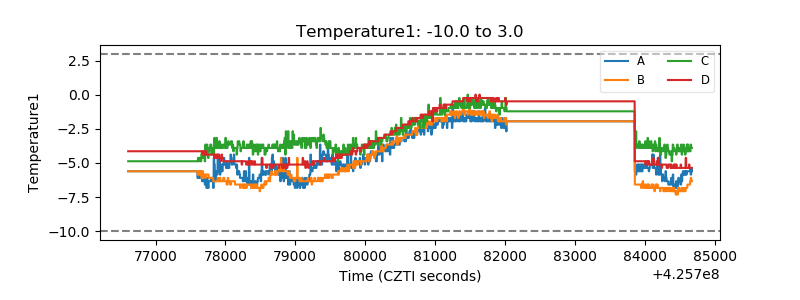 |
| Veto HV Monitor | 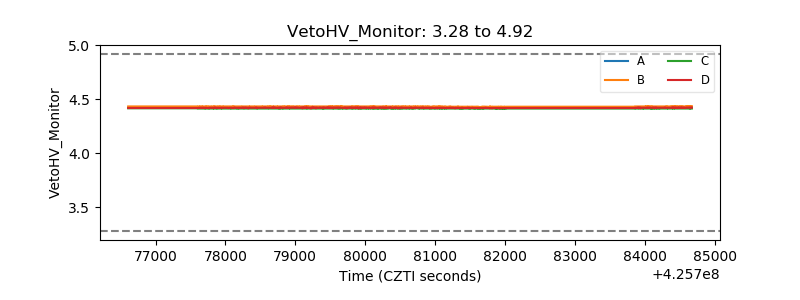 |
| Veto LLD | 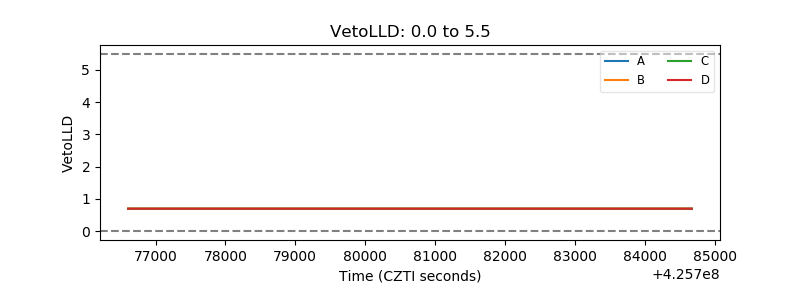 |
| Alpha Counter | 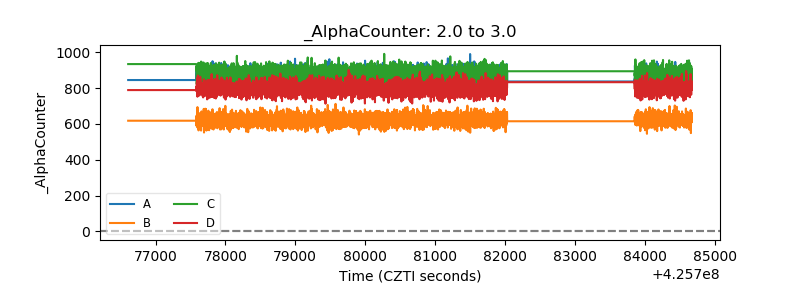 |
| _CPM_Rate | 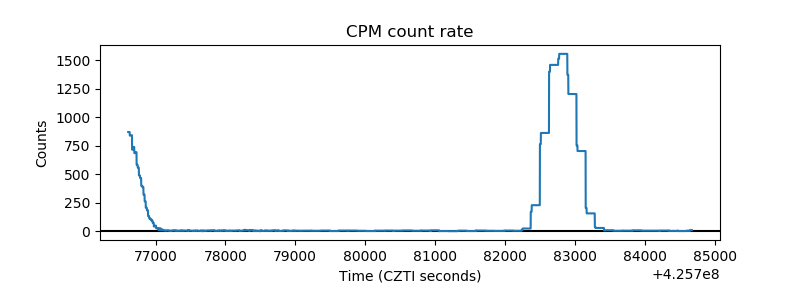 |
| CZT Counter | 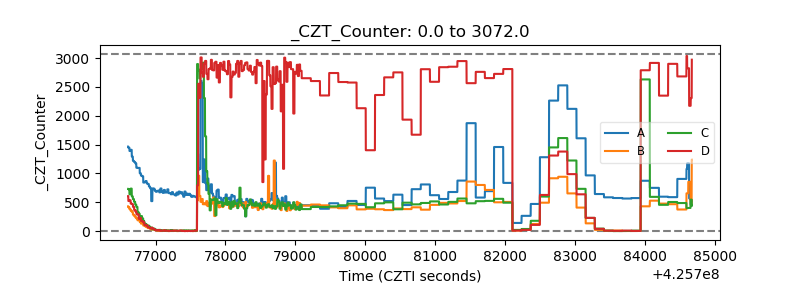 |
| +2.5 Volts monitor | 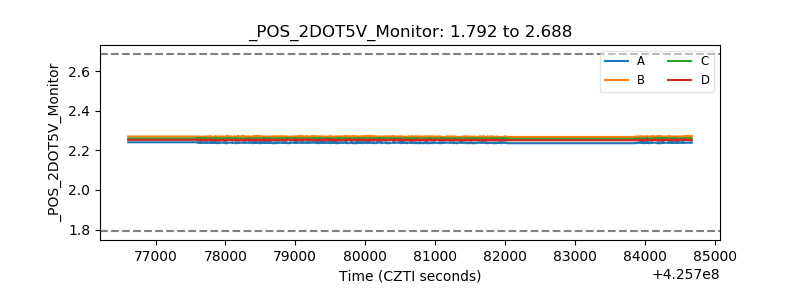 |
| +5 Volts monitor | 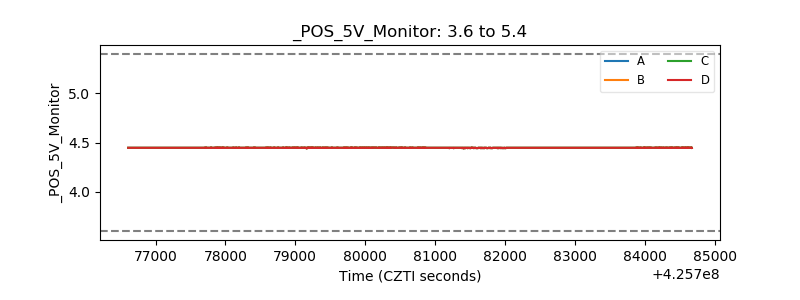 |
| _ROLL_ROT | 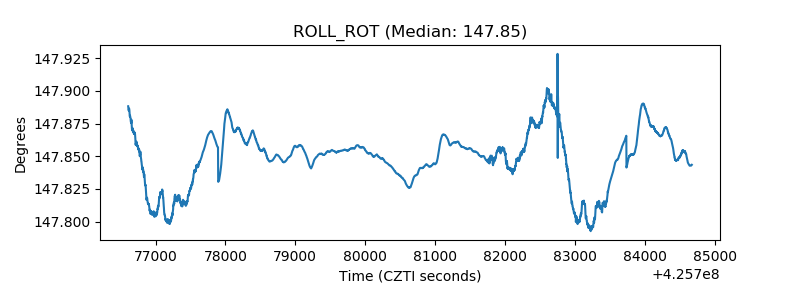 |
| _Roll_DEC | 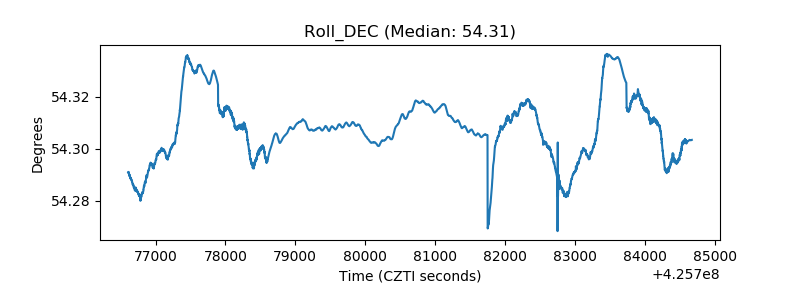 |
| _Roll_RA | 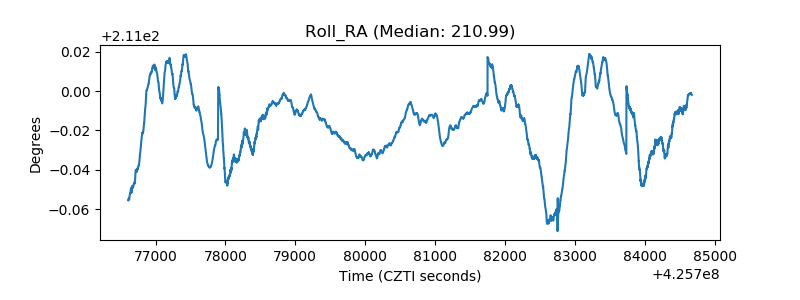 |
| Veto Counter | 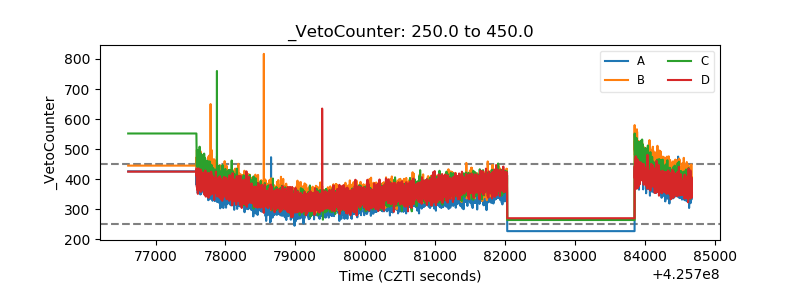 |