| Param | Original file | Final file |
|---|---|---|
| Filename | modeM0/AS1T05_118T01_9000005718_41922cztM0_level2.fits | modeM0/AS1T05_118T01_9000005718_41922cztM0_level2_quad_clean.evt |
| Size (bytes) | 688,127,040 | 73,056,960 |
| Size | 656.2 MB | 69.7 MB |
| Events in quadrant A | 3,985,476 | 586,089 |
| Events in quadrant B | 4,411,214 | 590,735 |
| Events in quadrant C | 3,316,729 | 578,680 |
| Events in quadrant D | 13,345,098 | 83,652 |
| Mode SS | |||
|---|---|---|---|
| Quadrant | BADHDUFLAG | Total packets | Discarded packets |
| A | 0 | 108 | 0 |
| B | 0 | 108 | 0 |
| C | 0 | 108 | 0 |
| D | 0 | 108 | 0 |
| Mode M9 | |||
|---|---|---|---|
| Quadrant | BADHDUFLAG | Total packets | Discarded packets |
| A | 0 | 19 | 0 |
| B | 0 | 19 | 0 |
| C | 0 | 19 | 0 |
| D | 0 | 19 | 0 |
| Mode M0 | |||
|---|---|---|---|
| Quadrant | BADHDUFLAG | Total packets | Discarded packets |
| A | 0 | 15135 | 2 |
| B | 0 | 16576 | 2 |
| C | 0 | 12974 | 2 |
| D | 0 | 43000 | 2 |
| Quadrant | Total seconds | Saturated seconds | Saturation percentage |
|---|---|---|---|
| A | 5327 | 344 | 6.457668% |
| B | 5328 | 558 | 10.472973% |
| C | 5327 | 286 | 5.368876% |
| D | 5327 | 4625 | 86.821851% |
Noise dominated data is calculated using 1-second bins in cleaned event files. If a bin has >2000 counts, and if more than 50% of those come from <1% of pixels, then it is considered to be noise-dominated and hence unusable.
| Quadrant | # 1 sec bins | Bins with >0 counts | Bins with >2000 counts | High rate bins dominated by noise | Noise dominated (total time) | Noise dominated (detector-on time) | Marked lightcurve |
|---|---|---|---|---|---|---|---|
| A | 7240 | 5328 | 288 | 288 | 3.98% | 5.41% | 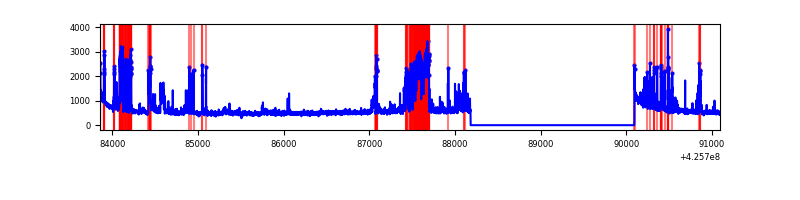 |
| B | 7241 | 5329 | 439 | 439 | 6.06% | 8.24% | 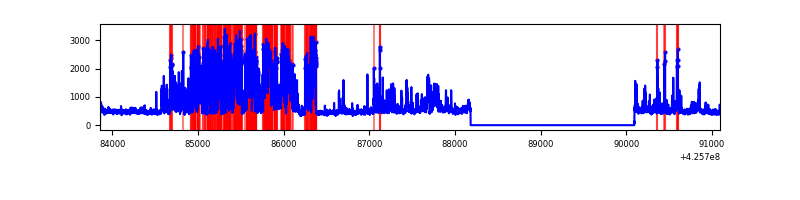 |
| C | 7240 | 5328 | 283 | 283 | 3.91% | 5.31% | 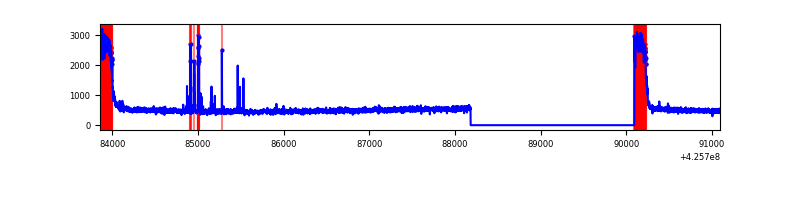 |
| D | 7240 | 5328 | 4502 | 4502 | 62.18% | 84.50% | 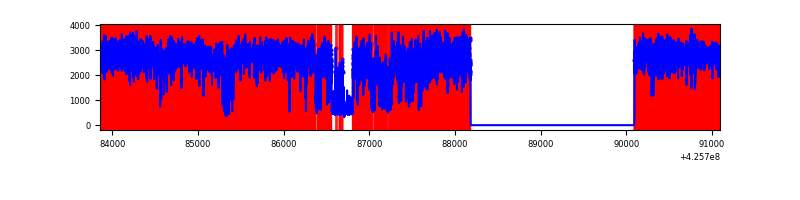 |
Top three noisy pixels from each quadrant. If the there are fewer than three noisy pixels in the level2.evt file, extra rows are filled as -1
| Pixel properties | Quadrant properties | ||||||
|---|---|---|---|---|---|---|---|
| Quadrant | DetID | PixID | Counts | Sigma | Mean | Median | Sigma |
| A | 14 | 24 | 1147444 | 9662.93 | 581 | 570 | 118.7 |
| A | 10 | 83 | 531213 | 4470.91 | 581 | 570 | 118.7 |
| A | 2 | 79 | 41282 | 343.02 | 581 | 570 | 118.7 |
| B | 5 | 255 | 1862937 | 16918.69 | 575 | 559 | 110.1 |
| B | 0 | 229 | 139323 | 1260.6 | 575 | 559 | 110.1 |
| B | 0 | 190 | 85060 | 767.65 | 575 | 559 | 110.1 |
| C | 0 | 10 | 806651 | 6213.59 | 560 | 563 | 129.7 |
| C | 15 | 214 | 209289 | 1608.93 | 560 | 563 | 129.7 |
| C | 4 | 254 | 79484 | 608.35 | 560 | 563 | 129.7 |
| D | 12 | 79 | 11578171 | 188106.82 | 244 | 237 | 61.5 |
| D | 13 | 249 | 355892 | 5778.33 | 244 | 237 | 61.5 |
| D | 12 | 233 | 179254 | 2908.49 | 244 | 237 | 61.5 |
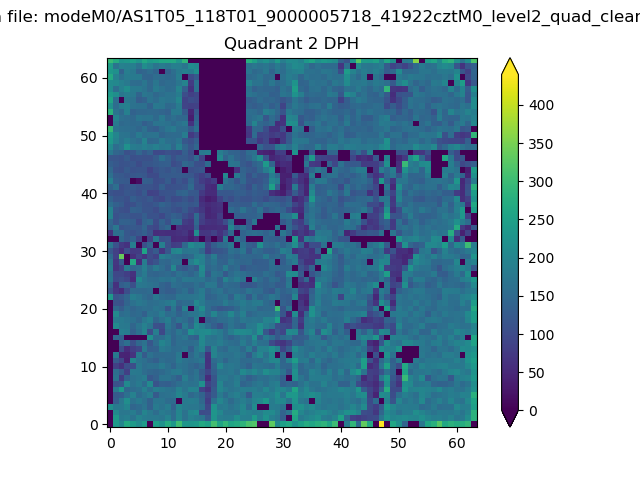
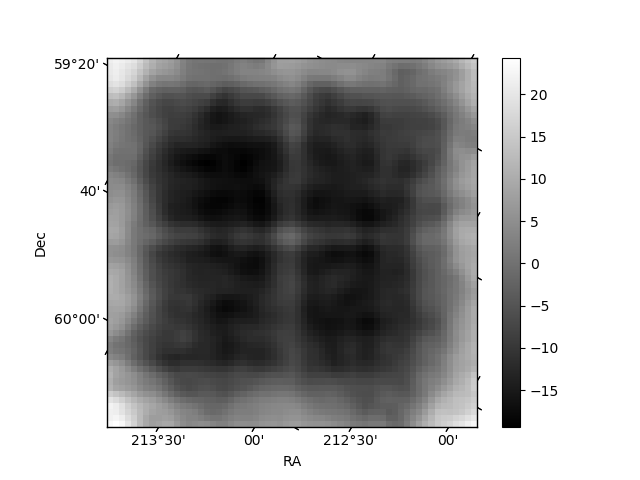
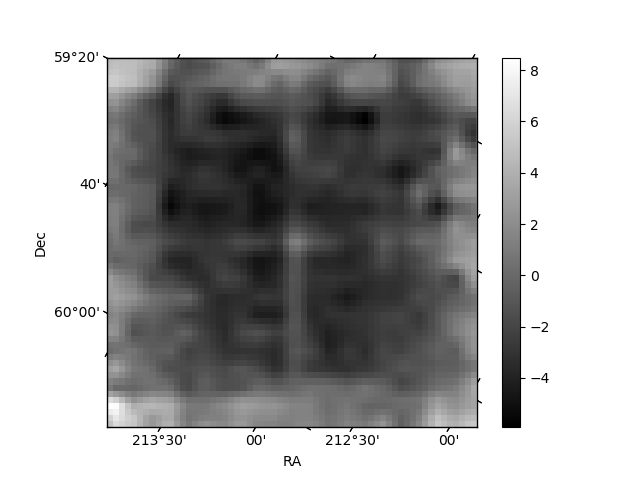
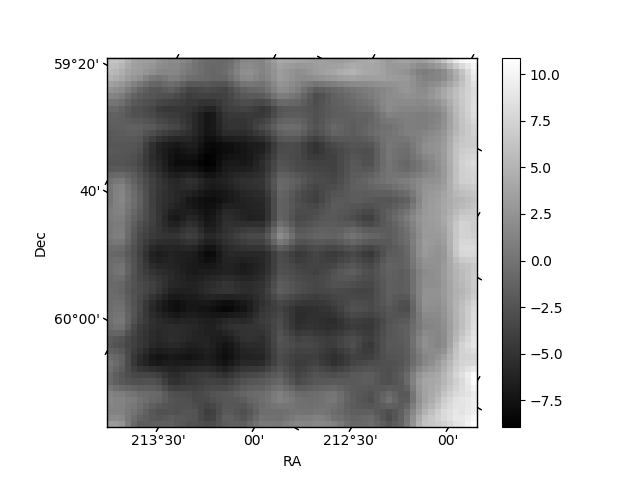
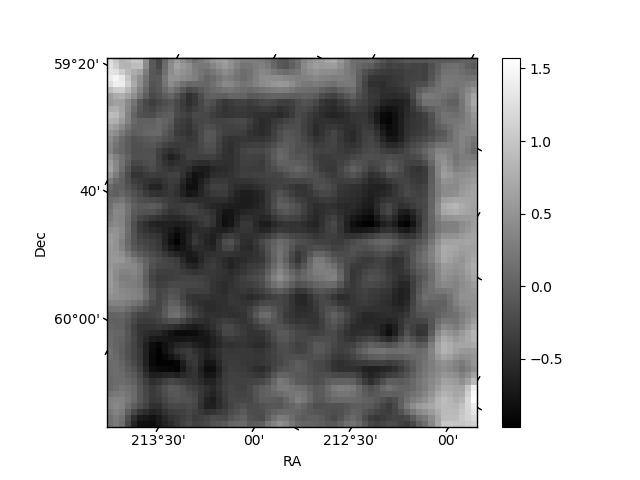
Histogram calculated using DETX and DETY for each event in the final _common_clean file
| Quadrant A | 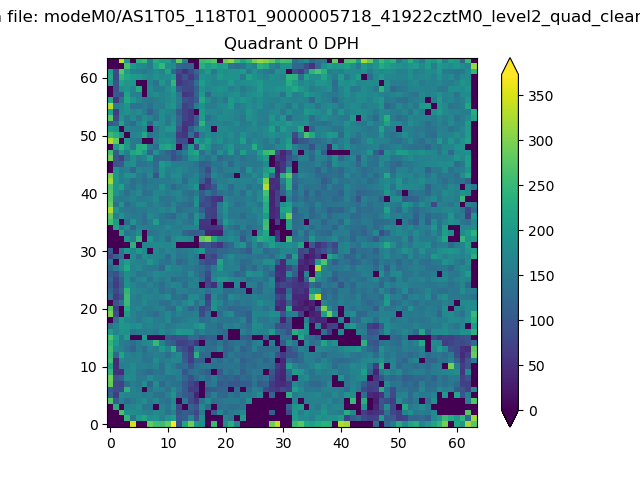 |
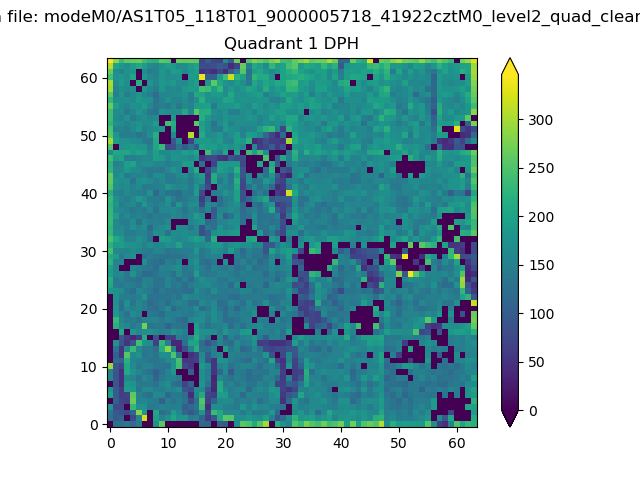 |
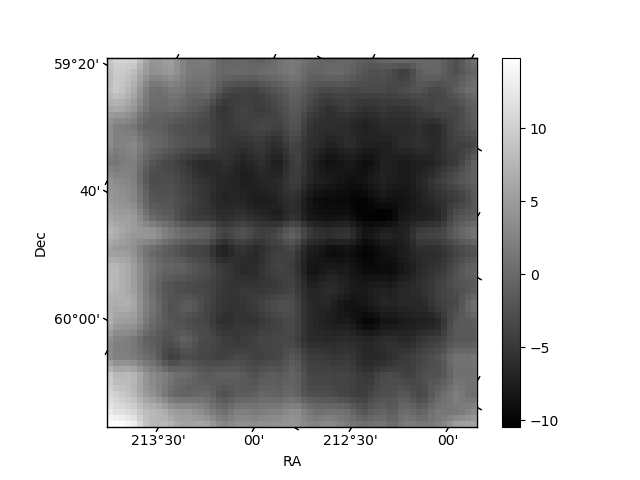
Quadrant B |
|---|---|---|---|
| Quadrant D | 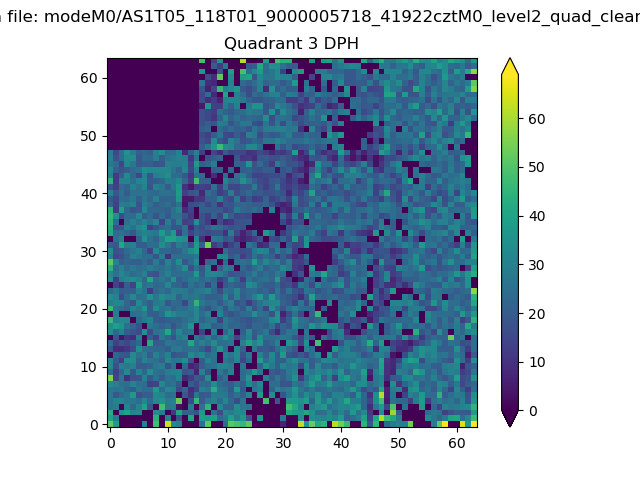 |
 |
Quadrant C |
| Plot type | Count rate plots | Images |
|---|---|---|
| Comparison with Poisson distribution Blue bars denote a histogram of data divided into 1 sec bins. Red curve is a Poisson curve with rate = median count rate of data. |
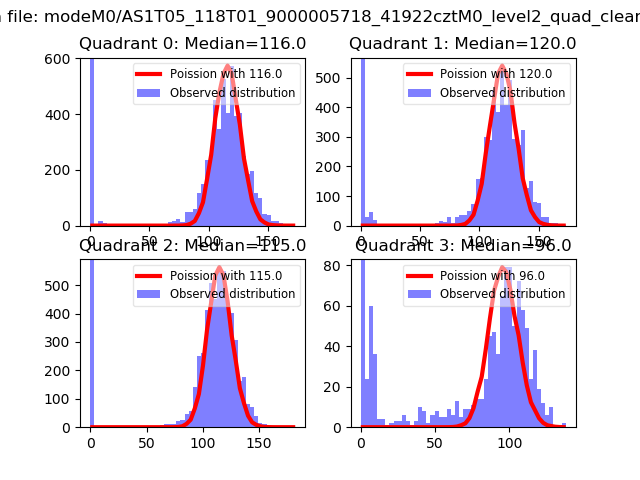 |
 |
| Quadrant-wise count rates Data is divided into 100 sec bins |
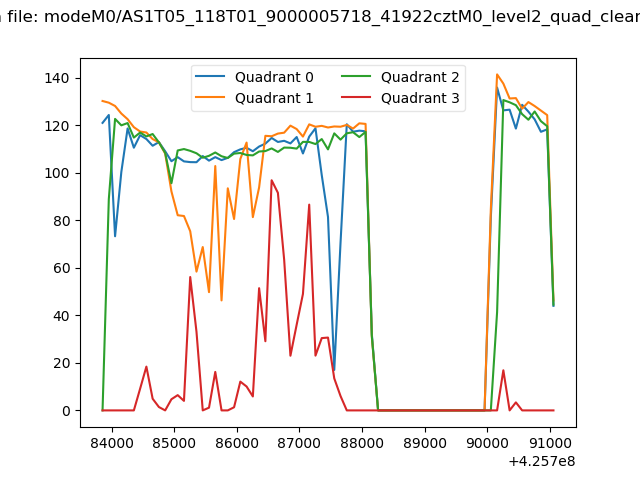 |
|
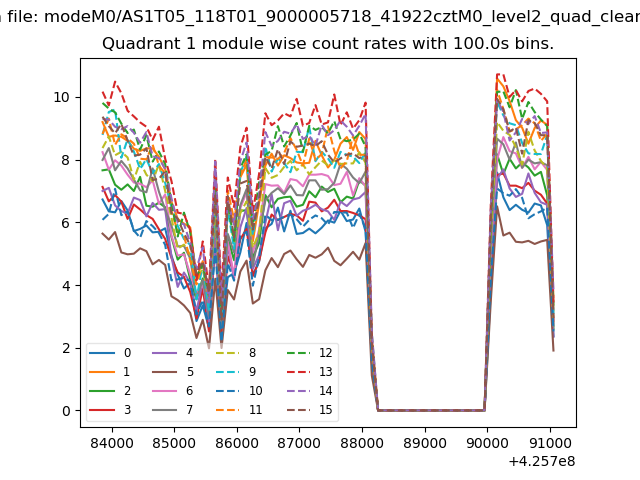
| Module-wise count rates for Quadrant A Data is divided into 100 sec bins |
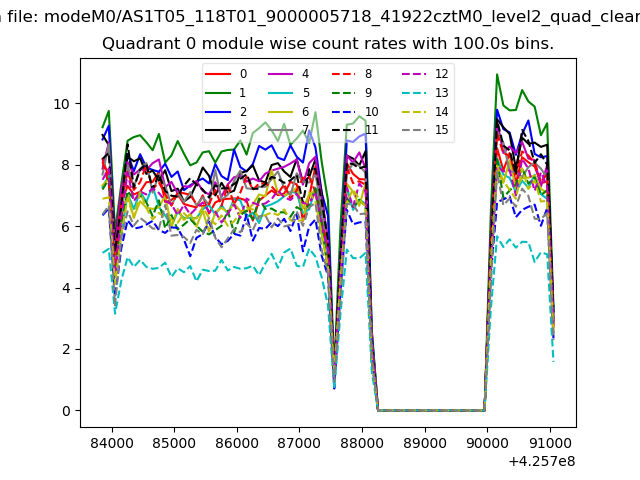 |
 |
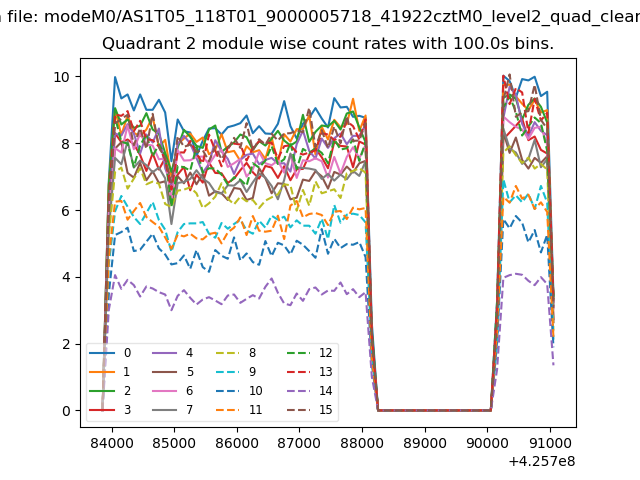
| Module-wise count rates for Quadrant B Data is divided into 100 sec bins |
 |
 |
| Module-wise count rates for Quadrant C Data is divided into 100 sec bins |
 |
 |
| Module-wise count rates for Quadrant D Data is divided into 100 sec bins |
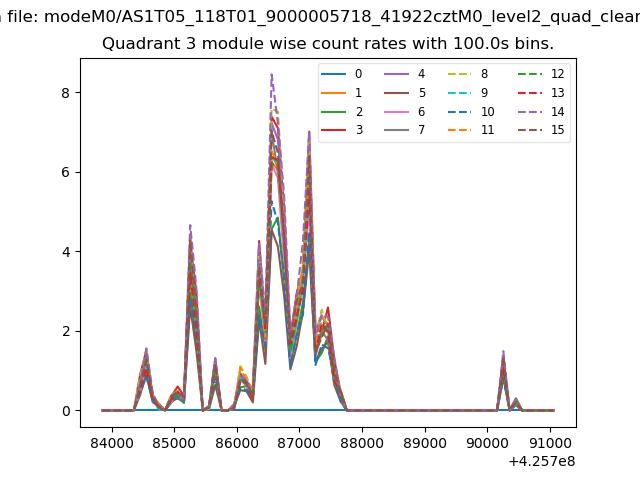 |
 |
| Parameter | Plot |
|---|---|
| CZT HV Monitor | 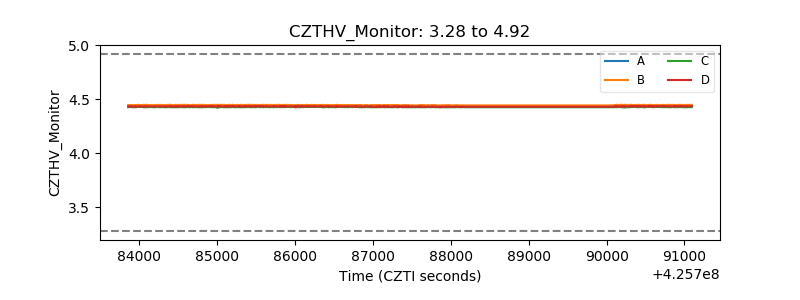 |
| D_VDD | 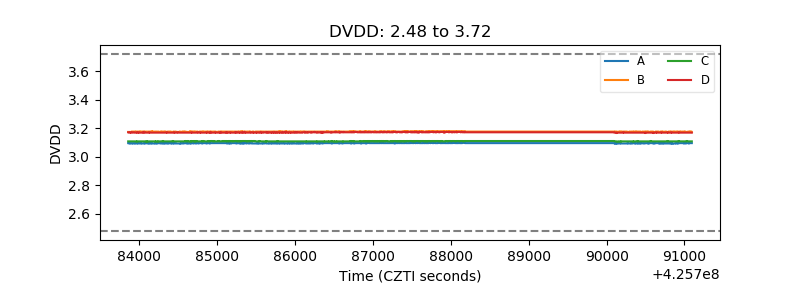 |
| Temperature 1 | 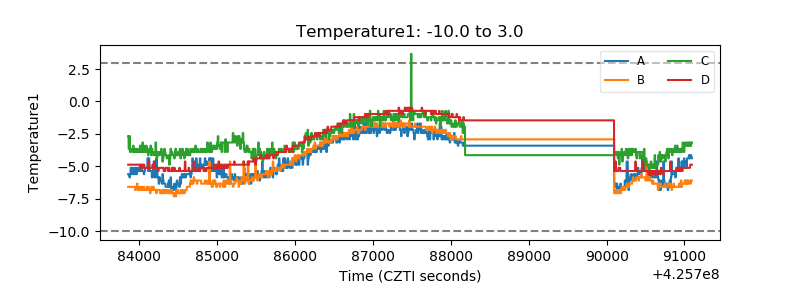 |
| Veto HV Monitor | 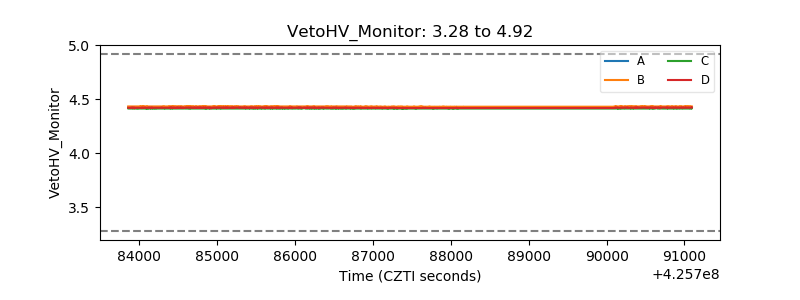 |
| Veto LLD | 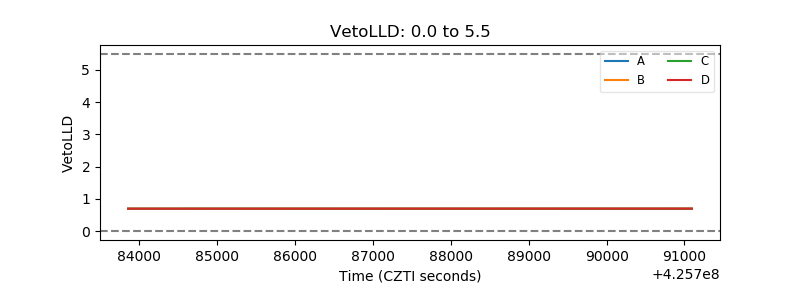 |
| Alpha Counter | 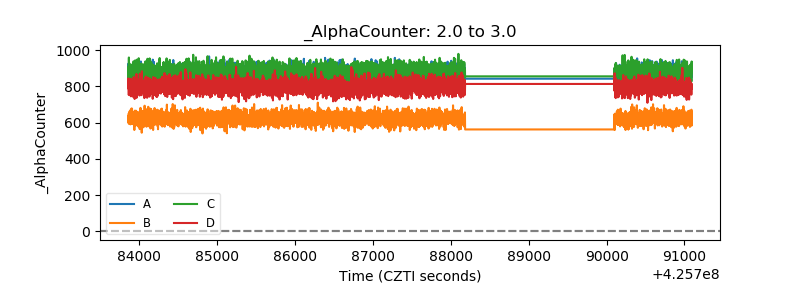 |
| _CPM_Rate | 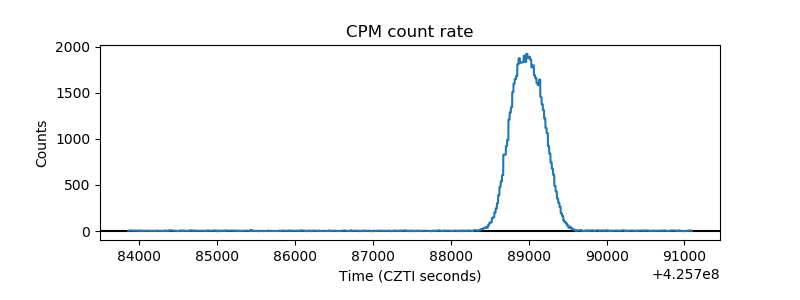 |
| CZT Counter | 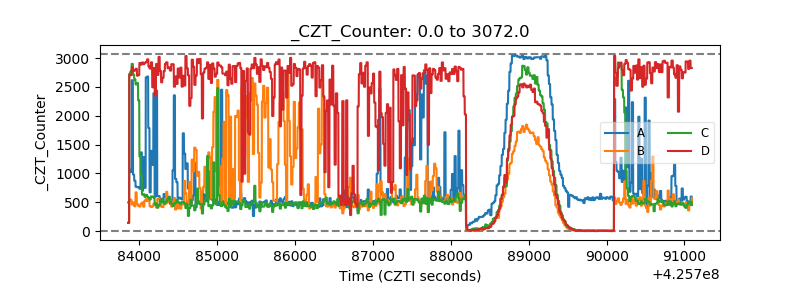 |
| +2.5 Volts monitor | 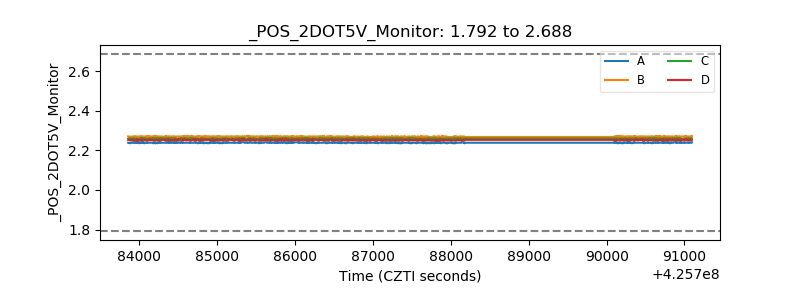 |
| +5 Volts monitor | 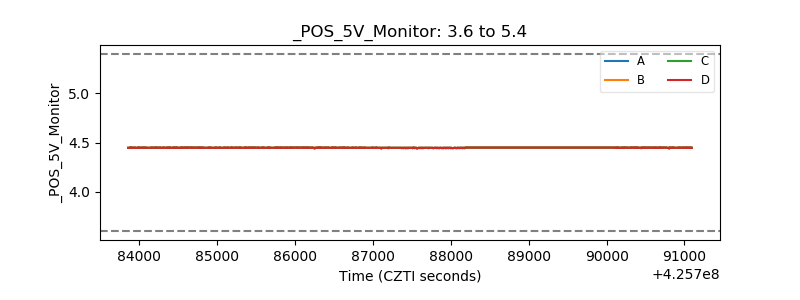 |
| _ROLL_ROT | 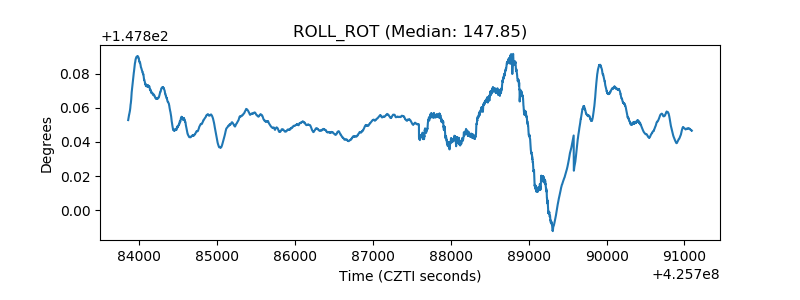 |
| _Roll_DEC | 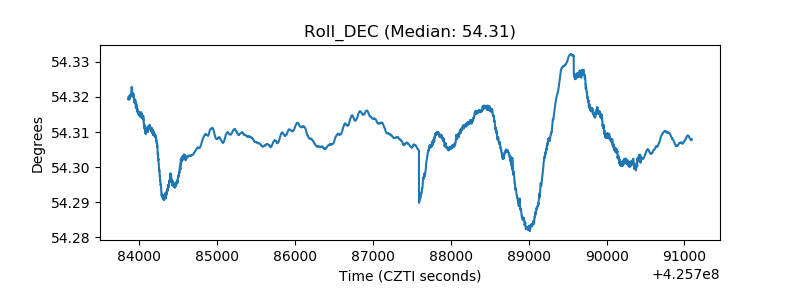 |
| _Roll_RA | 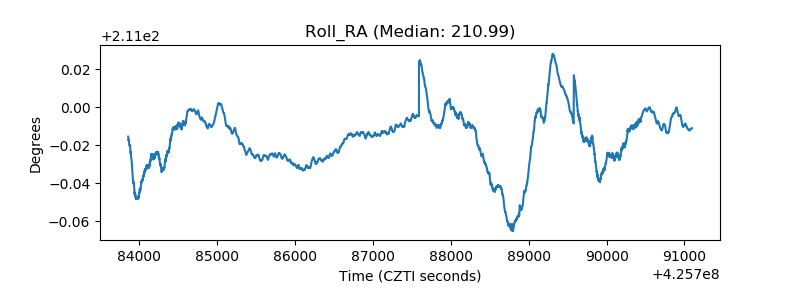 |
| Veto Counter | 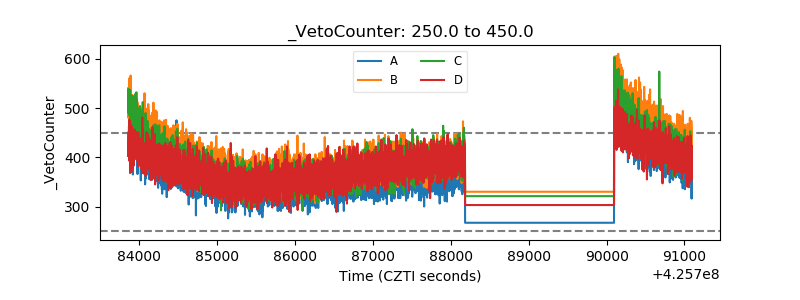 |