| Param | Original file | Final file |
|---|---|---|
| Filename | modeM0/AS1T05_118T01_9000005718_41923cztM0_level2.fits | modeM0/AS1T05_118T01_9000005718_41923cztM0_level2_quad_clean.evt |
| Size (bytes) | 658,952,640 | 73,543,680 |
| Size | 628.4 MB | 70.1 MB |
| Events in quadrant A | 3,434,465 | 619,649 |
| Events in quadrant B | 3,399,738 | 641,841 |
| Events in quadrant C | 3,211,212 | 582,195 |
| Events in quadrant D | 13,945,433 | 21,315 |
| Mode SS | |||
|---|---|---|---|
| Quadrant | BADHDUFLAG | Total packets | Discarded packets |
| A | 0 | 106 | 0 |
| B | 0 | 106 | 0 |
| C | 0 | 106 | 0 |
| D | 0 | 106 | 0 |
| Mode M9 | |||
|---|---|---|---|
| Quadrant | BADHDUFLAG | Total packets | Discarded packets |
| A | 0 | 31 | 0 |
| B | 0 | 31 | 0 |
| C | 0 | 31 | 0 |
| D | 0 | 32 | 0 |
| Mode M0 | |||
|---|---|---|---|
| Quadrant | BADHDUFLAG | Total packets | Discarded packets |
| A | 0 | 13408 | 3 |
| B | 0 | 13452 | 2 |
| C | 0 | 12504 | 2 |
| D | 0 | 44646 | 2 |
| Quadrant | Total seconds | Saturated seconds | Saturation percentage |
|---|---|---|---|
| A | 5163 | 126 | 2.440442% |
| B | 5163 | 135 | 2.614759% |
| C | 5163 | 271 | 5.248886% |
| D | 5163 | 5033 | 97.482084% |
Noise dominated data is calculated using 1-second bins in cleaned event files. If a bin has >2000 counts, and if more than 50% of those come from <1% of pixels, then it is considered to be noise-dominated and hence unusable.
| Quadrant | # 1 sec bins | Bins with >0 counts | Bins with >2000 counts | High rate bins dominated by noise | Noise dominated (total time) | Noise dominated (detector-on time) | Marked lightcurve |
|---|---|---|---|---|---|---|---|
| A | 7195 | 5164 | 81 | 81 | 1.13% | 1.57% | 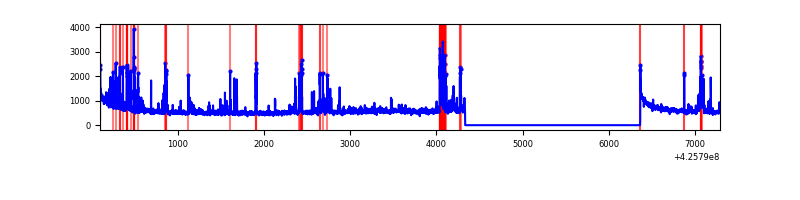 |
| B | 7195 | 5164 | 77 | 77 | 1.07% | 1.49% | 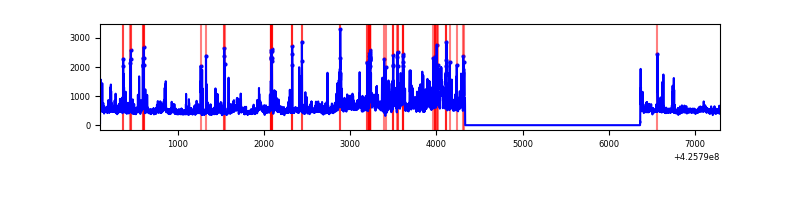 |
| C | 7195 | 5164 | 269 | 269 | 3.74% | 5.21% | 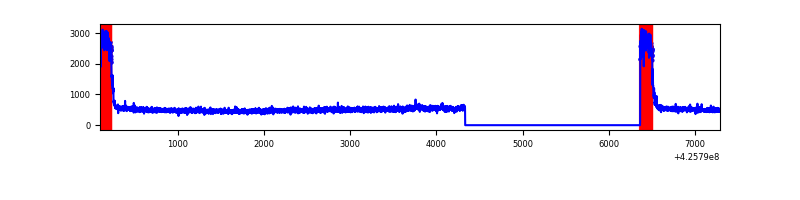 |
| D | 7195 | 5164 | 4907 | 4907 | 68.20% | 95.02% | 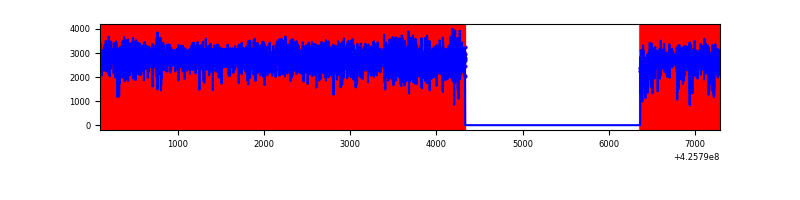 |
Top three noisy pixels from each quadrant. If the there are fewer than three noisy pixels in the level2.evt file, extra rows are filled as -1
| Pixel properties | Quadrant properties | ||||||
|---|---|---|---|---|---|---|---|
| Quadrant | DetID | PixID | Counts | Sigma | Mean | Median | Sigma |
| A | 10 | 83 | 540527 | 4464.5 | 594 | 584 | 120.9 |
| A | 14 | 24 | 439633 | 3630.26 | 594 | 584 | 120.9 |
| A | 2 | 79 | 63910 | 523.61 | 594 | 584 | 120.9 |
| B | 0 | 229 | 523351 | 4650.95 | 592 | 576 | 112.4 |
| B | 0 | 156 | 162170 | 1437.65 | 592 | 576 | 112.4 |
| B | 0 | 190 | 161560 | 1432.22 | 592 | 576 | 112.4 |
| C | 0 | 10 | 791385 | 6140.24 | 557 | 560 | 128.8 |
| C | 15 | 214 | 203433 | 1575.18 | 557 | 560 | 128.8 |
| C | 0 | 15 | 37369 | 285.8 | 557 | 560 | 128.8 |
| D | 12 | 79 | 12364036 | 252797.9 | 194 | 188 | 48.9 |
| D | 13 | 249 | 687869 | 14060.7 | 194 | 188 | 48.9 |
| D | 12 | 6 | 32410 | 658.83 | 194 | 188 | 48.9 |
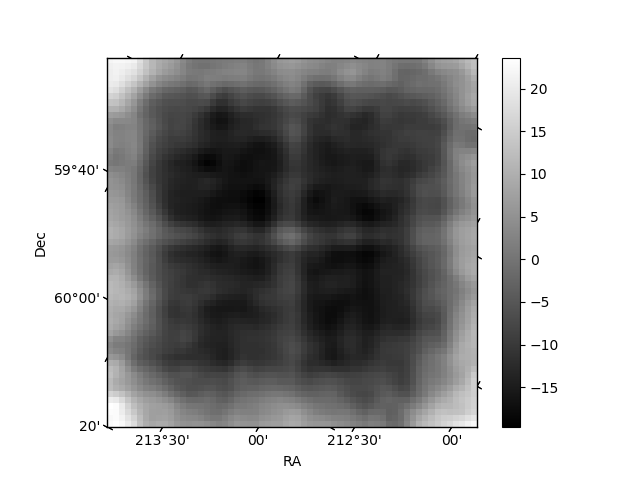
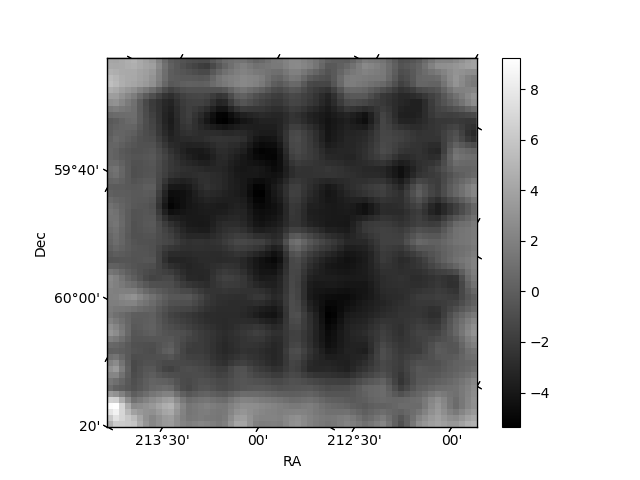
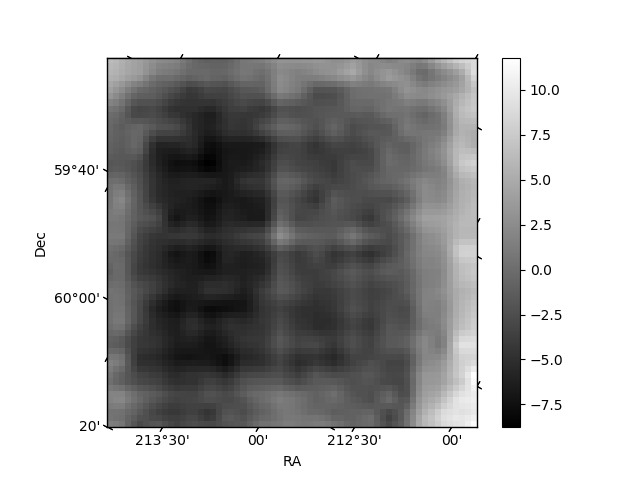
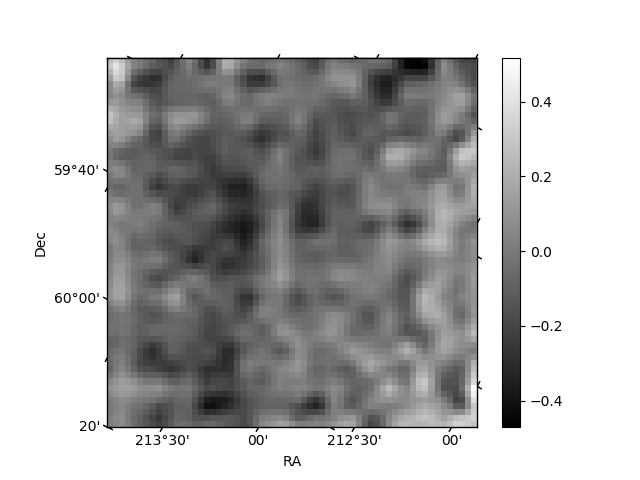
Histogram calculated using DETX and DETY for each event in the final _common_clean file
| Quadrant A | 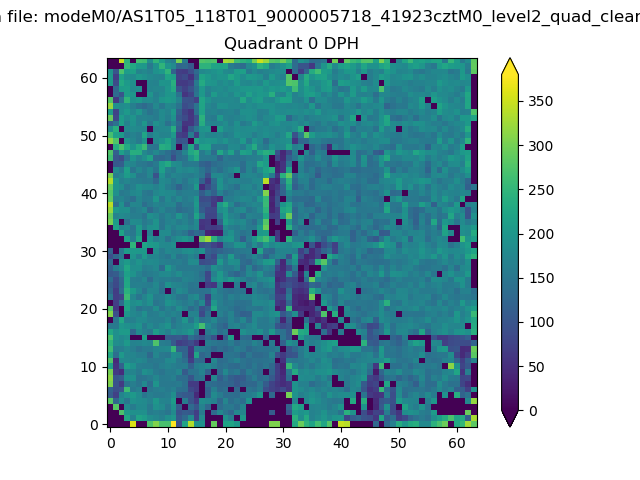 |
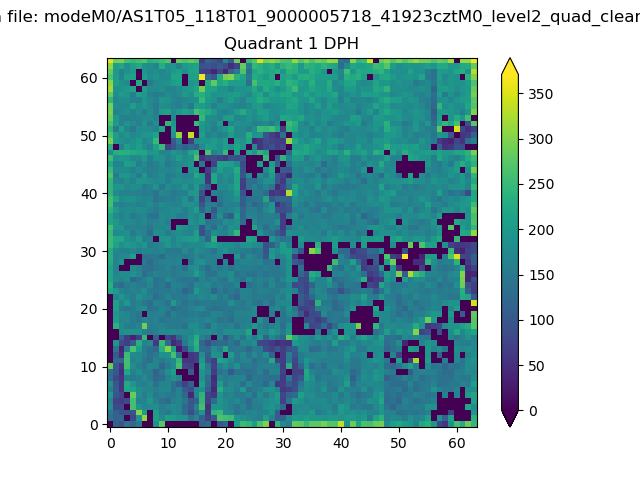 |
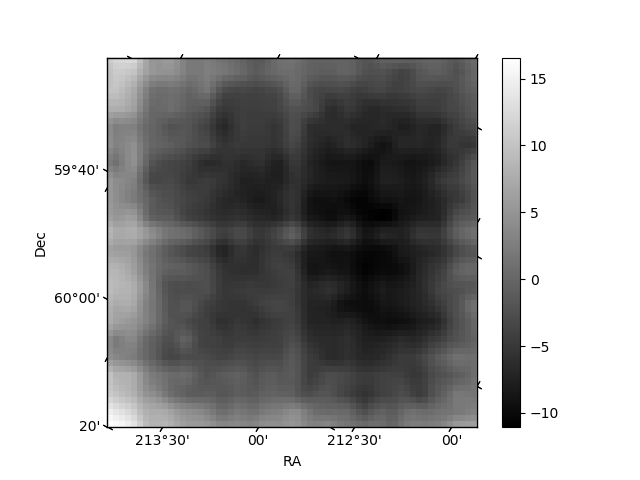
Quadrant B |
|---|---|---|---|
| Quadrant D | 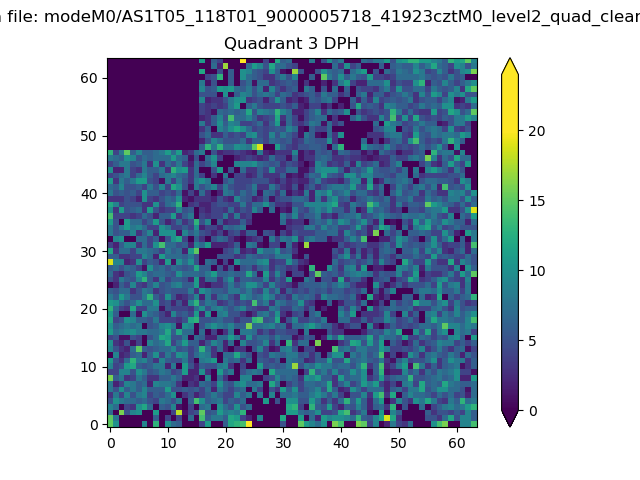 |
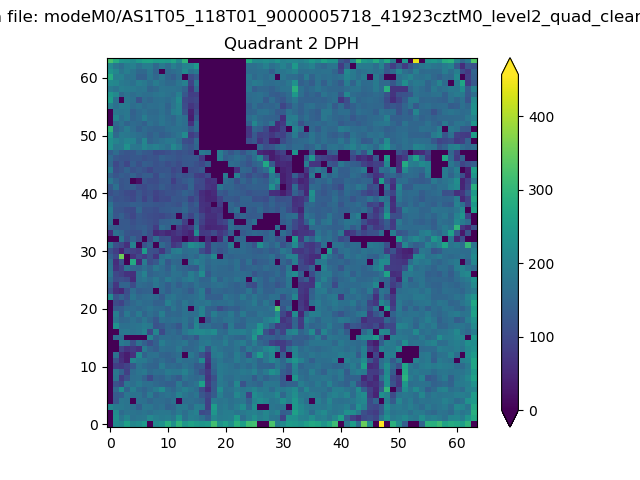 |
Quadrant C |
| Plot type | Count rate plots | Images |
|---|---|---|
| Comparison with Poisson distribution Blue bars denote a histogram of data divided into 1 sec bins. Red curve is a Poisson curve with rate = median count rate of data. |
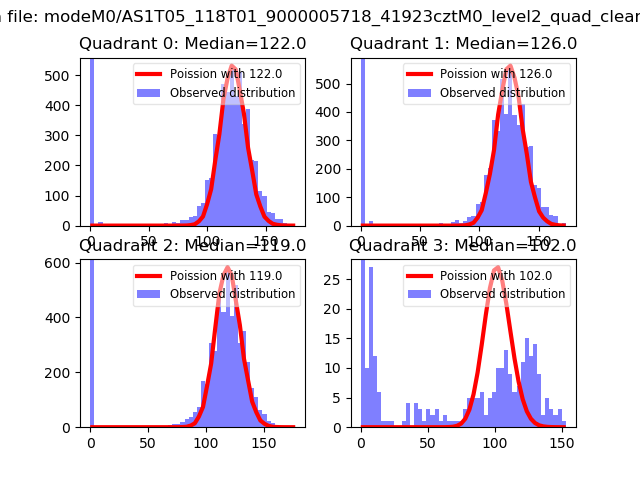 |
 |
| Quadrant-wise count rates Data is divided into 100 sec bins |
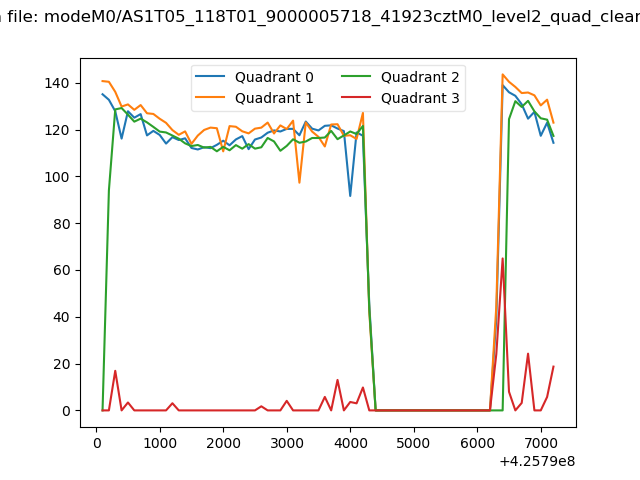 |
|
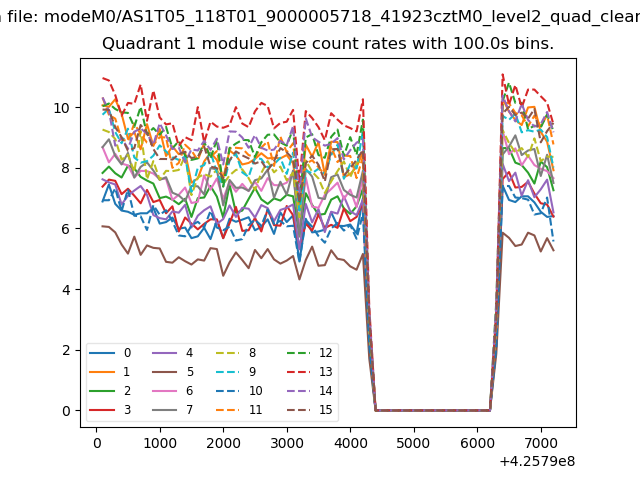
| Module-wise count rates for Quadrant A Data is divided into 100 sec bins |
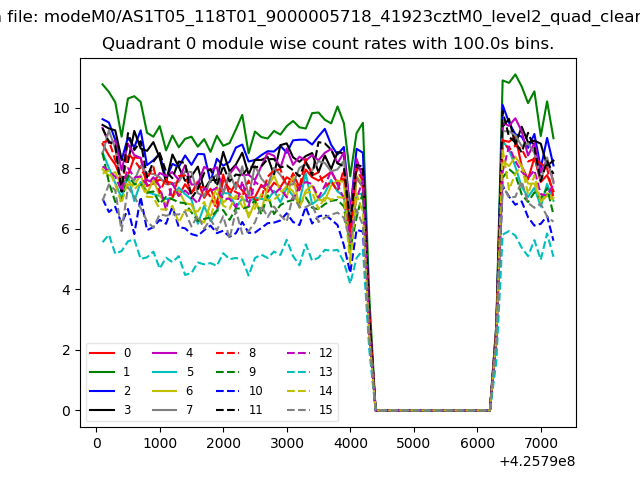 |
 |
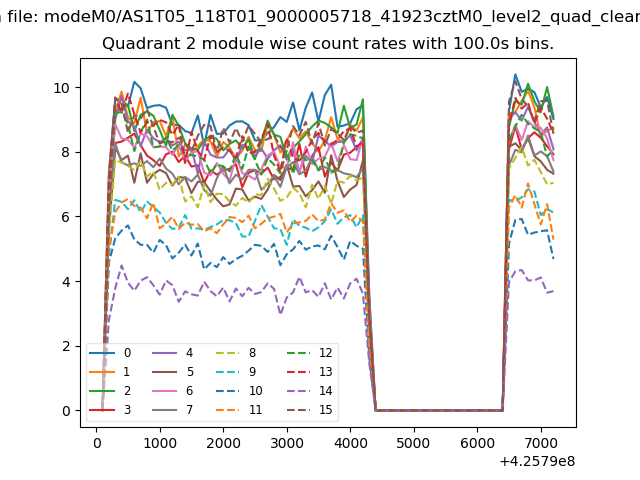
| Module-wise count rates for Quadrant B Data is divided into 100 sec bins |
 |
 |
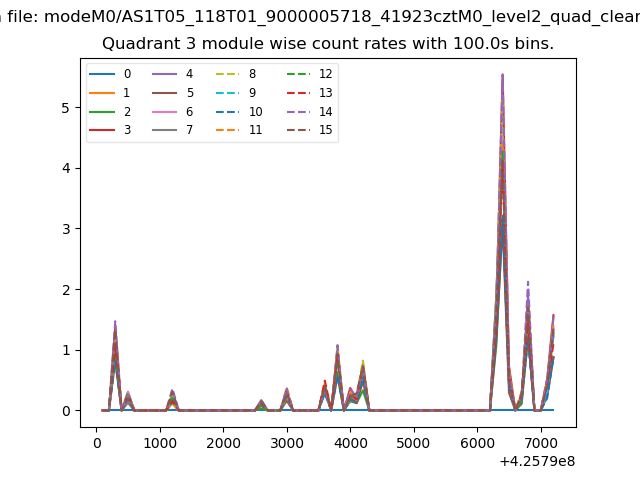
| Module-wise count rates for Quadrant C Data is divided into 100 sec bins |
 |
 |
| Module-wise count rates for Quadrant D Data is divided into 100 sec bins |
 |
 |
| Parameter | Plot |
|---|---|
| CZT HV Monitor | 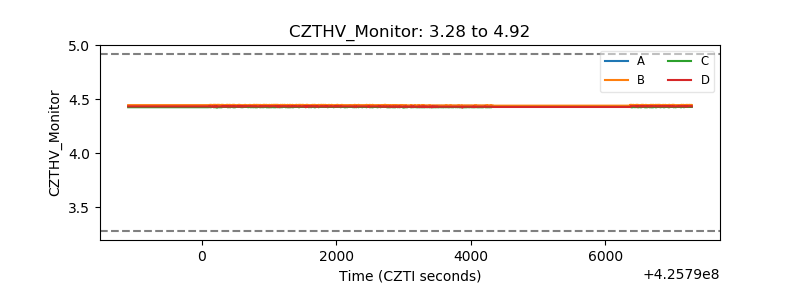 |
| D_VDD | 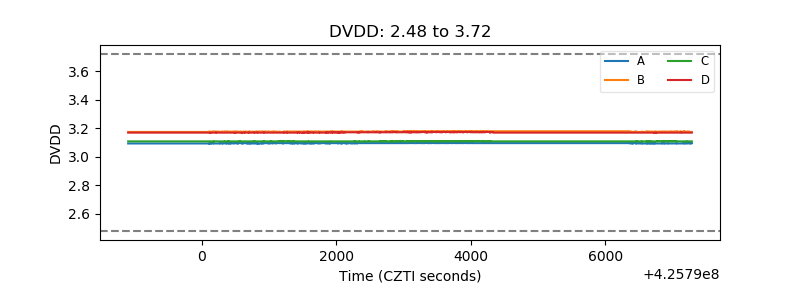 |
| Temperature 1 | 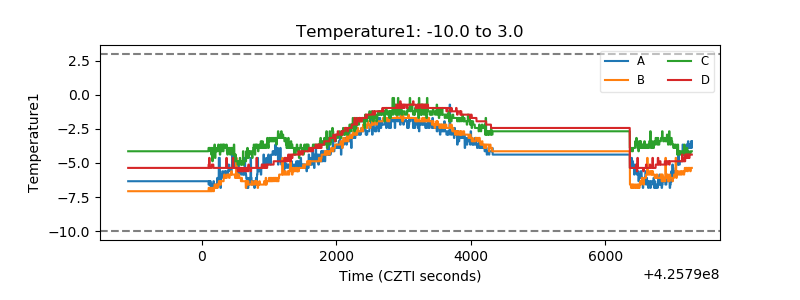 |
| Veto HV Monitor | 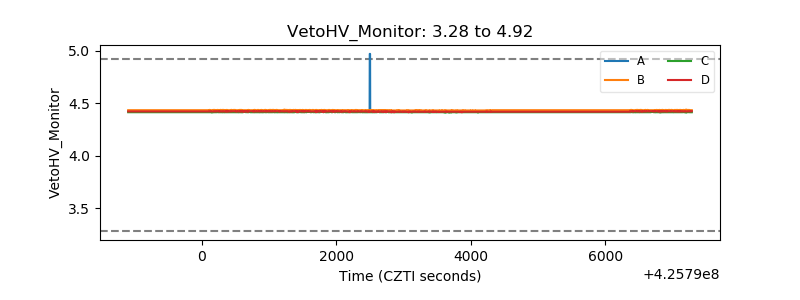 |
| Veto LLD | 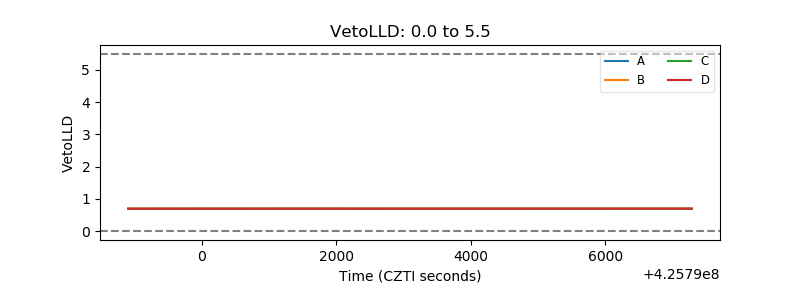 |
| Alpha Counter | 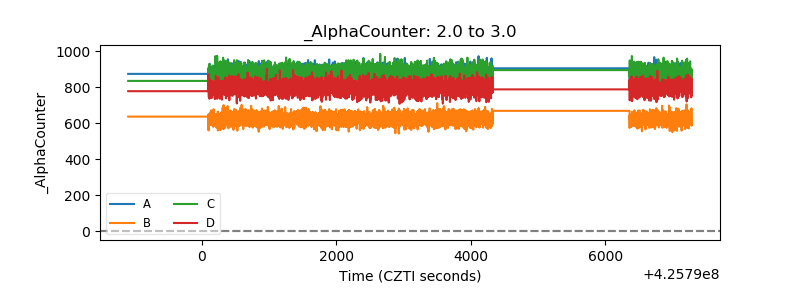 |
| _CPM_Rate | 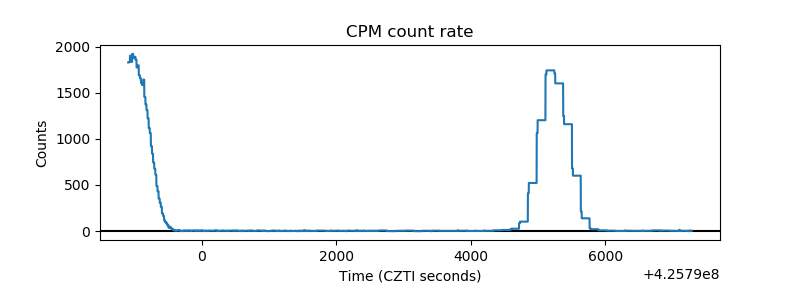 |
| CZT Counter | 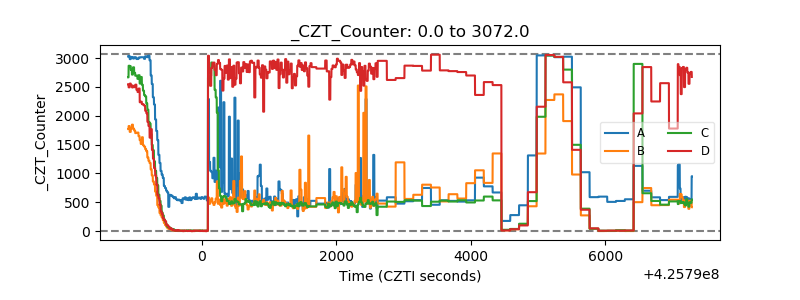 |
| +2.5 Volts monitor |  |
| +5 Volts monitor | 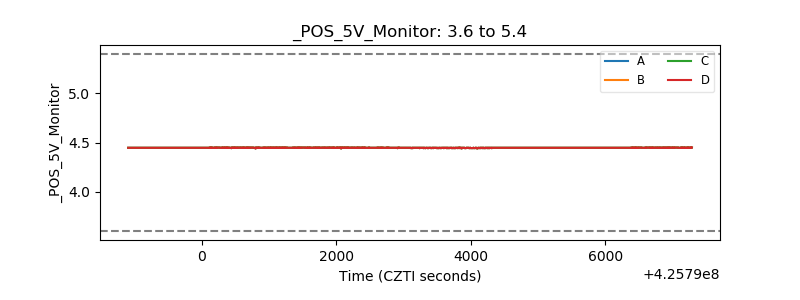 |
| _ROLL_ROT | 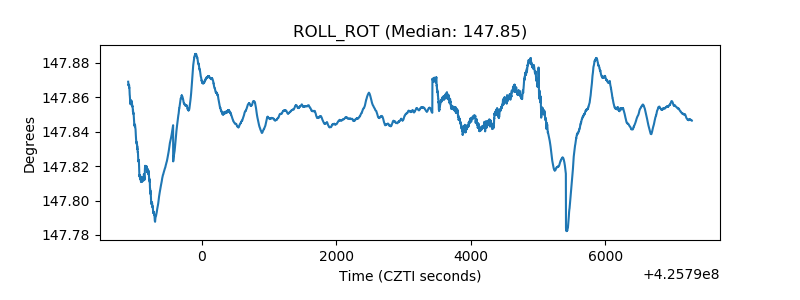 |
| _Roll_DEC | 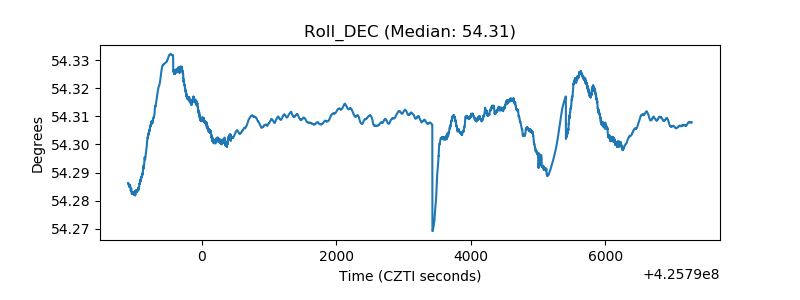 |
| _Roll_RA | 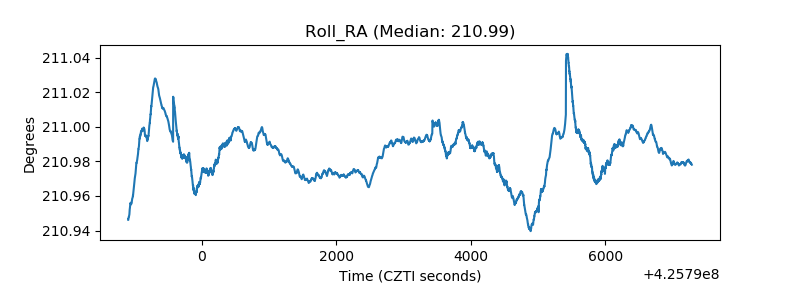 |
| Veto Counter | 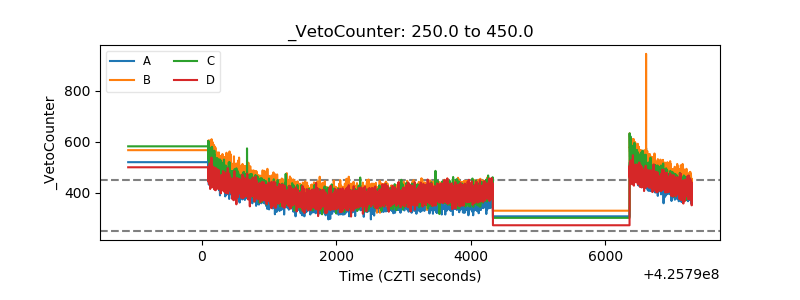 |