| Param | Original file | Final file |
|---|---|---|
| Filename | modeM0/AS1T05_118T01_9000005718_41924cztM0_level2.fits | modeM0/AS1T05_118T01_9000005718_41924cztM0_level2_quad_clean.evt |
| Size (bytes) | 591,661,440 | 77,230,080 |
| Size | 564.3 MB | 73.7 MB |
| Events in quadrant A | 3,814,676 | 598,538 |
| Events in quadrant B | 3,155,642 | 631,700 |
| Events in quadrant C | 3,226,969 | 565,917 |
| Events in quadrant D | 11,316,285 | 191,925 |
| Mode SS | |||
|---|---|---|---|
| Quadrant | BADHDUFLAG | Total packets | Discarded packets |
| A | 0 | 102 | 0 |
| B | 0 | 102 | 0 |
| C | 0 | 102 | 0 |
| D | 0 | 102 | 0 |
| Mode M9 | |||
|---|---|---|---|
| Quadrant | BADHDUFLAG | Total packets | Discarded packets |
| A | 0 | 28 | 0 |
| B | 0 | 28 | 0 |
| C | 0 | 29 | 0 |
| D | 0 | 29 | 0 |
| Mode M0 | |||
|---|---|---|---|
| Quadrant | BADHDUFLAG | Total packets | Discarded packets |
| A | 0 | 14566 | 2 |
| B | 0 | 12581 | 2 |
| C | 0 | 12254 | 2 |
| D | 0 | 36984 | 6 |
| Quadrant | Total seconds | Saturated seconds | Saturation percentage |
|---|---|---|---|
| A | 4994 | 217 | 4.345214% |
| B | 4994 | 104 | 2.082499% |
| C | 4994 | 278 | 5.566680% |
| D | 4993 | 3572 | 71.540156% |
Noise dominated data is calculated using 1-second bins in cleaned event files. If a bin has >2000 counts, and if more than 50% of those come from <1% of pixels, then it is considered to be noise-dominated and hence unusable.
| Quadrant | # 1 sec bins | Bins with >0 counts | Bins with >2000 counts | High rate bins dominated by noise | Noise dominated (total time) | Noise dominated (detector-on time) | Marked lightcurve |
|---|---|---|---|---|---|---|---|
| A | 7116 | 4995 | 158 | 158 | 2.22% | 3.16% | 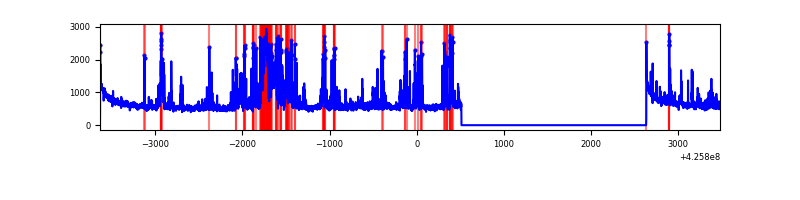 |
| B | 7116 | 4995 | 57 | 57 | 0.80% | 1.14% | 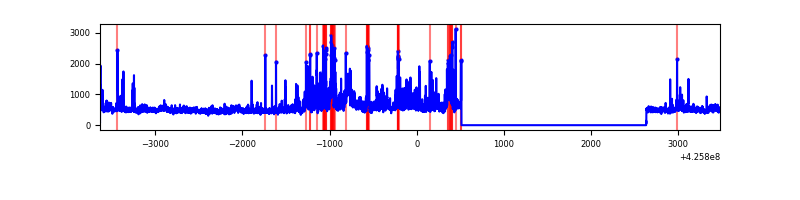 |
| C | 7116 | 4995 | 267 | 267 | 3.75% | 5.35% | 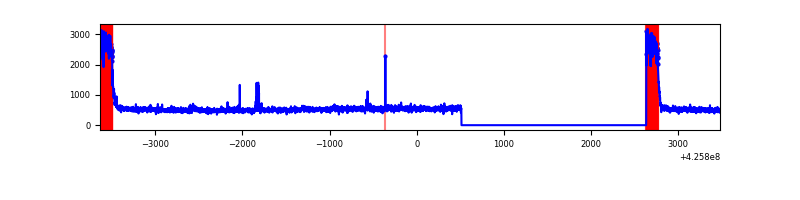 |
| D | 7115 | 4994 | 3600 | 3600 | 50.60% | 72.09% | 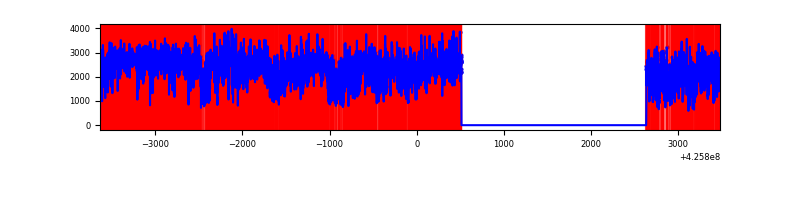 |
Top three noisy pixels from each quadrant. If the there are fewer than three noisy pixels in the level2.evt file, extra rows are filled as -1
| Pixel properties | Quadrant properties | ||||||
|---|---|---|---|---|---|---|---|
| Quadrant | DetID | PixID | Counts | Sigma | Mean | Median | Sigma |
| A | 14 | 24 | 757719 | 6387.16 | 578 | 567 | 118.5 |
| A | 10 | 83 | 542270 | 4569.68 | 578 | 567 | 118.5 |
| A | 14 | 250 | 116529 | 978.23 | 578 | 567 | 118.5 |
| B | 0 | 229 | 477062 | 4351.11 | 576 | 562 | 109.5 |
| B | 0 | 190 | 163343 | 1486.42 | 576 | 562 | 109.5 |
| B | 7 | 202 | 104642 | 950.4 | 576 | 562 | 109.5 |
| C | 0 | 10 | 842065 | 6717.35 | 542 | 544 | 125.3 |
| C | 15 | 214 | 198179 | 1577.6 | 542 | 544 | 125.3 |
| C | 0 | 15 | 44213 | 348.58 | 542 | 544 | 125.3 |
| D | 12 | 79 | 7739993 | 83205.15 | 383 | 372 | 93.0 |
| D | 13 | 249 | 1413350 | 15190.28 | 383 | 372 | 93.0 |
| D | 1 | 52 | 279969 | 3005.82 | 383 | 372 | 93.0 |
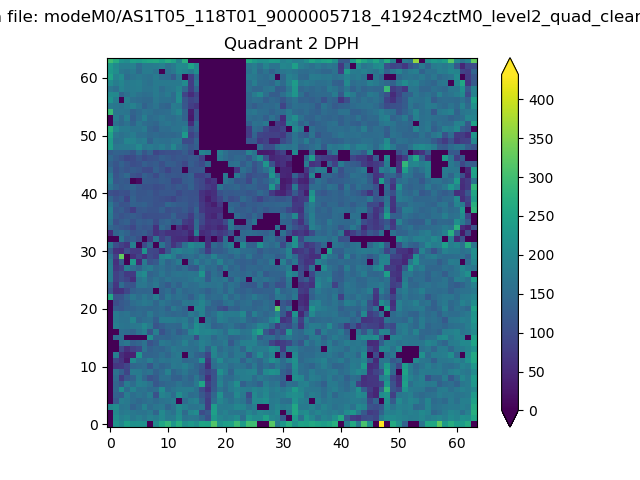
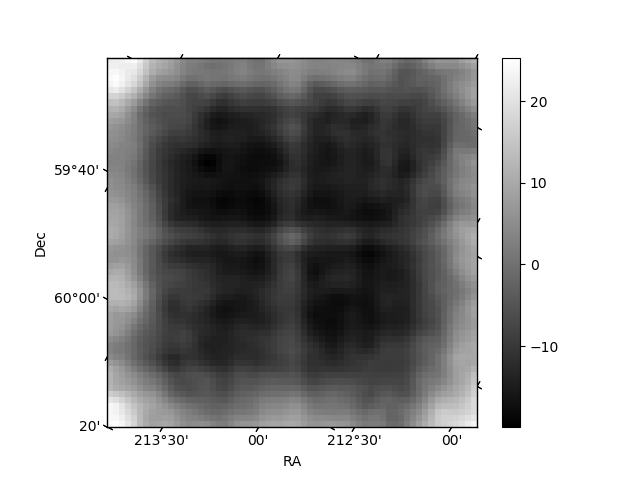
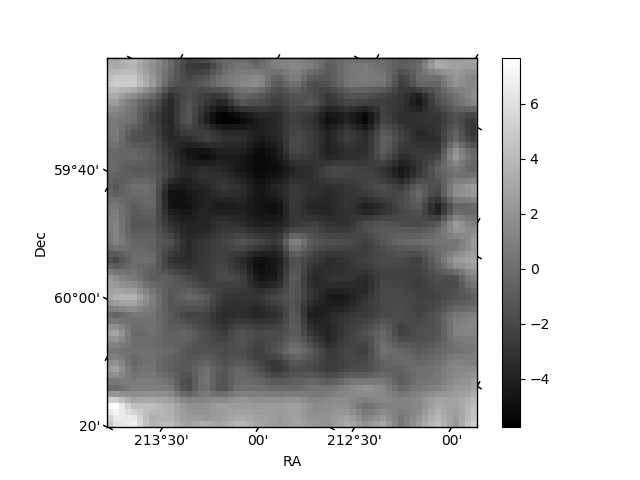
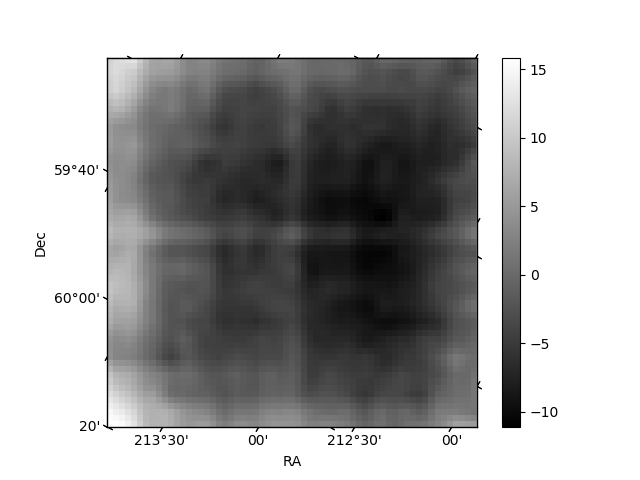
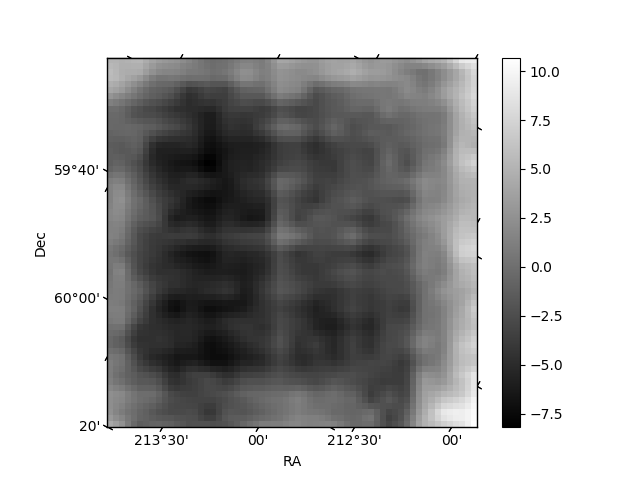
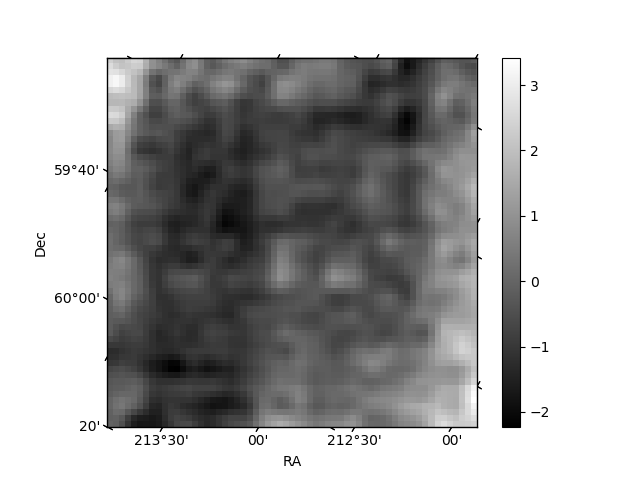
Histogram calculated using DETX and DETY for each event in the final _common_clean file
| Quadrant A | 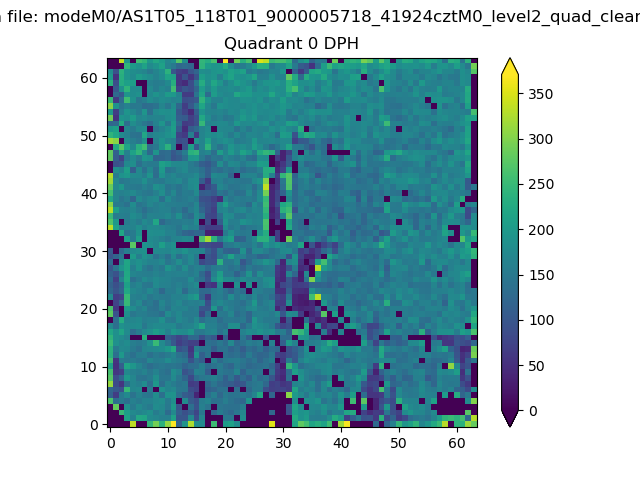 |
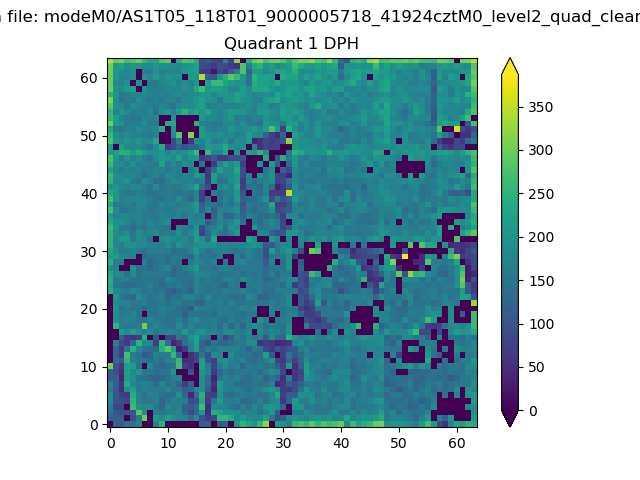 |
Quadrant B |
|---|---|---|---|
| Quadrant D | 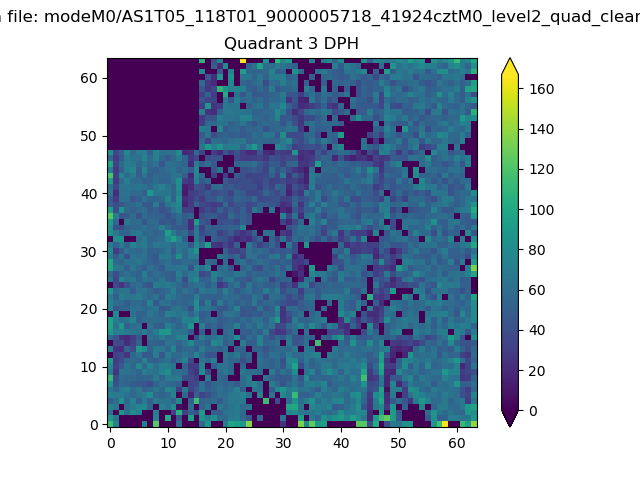 |
 |
Quadrant C |
| Plot type | Count rate plots | Images |
|---|---|---|
| Comparison with Poisson distribution Blue bars denote a histogram of data divided into 1 sec bins. Red curve is a Poisson curve with rate = median count rate of data. |
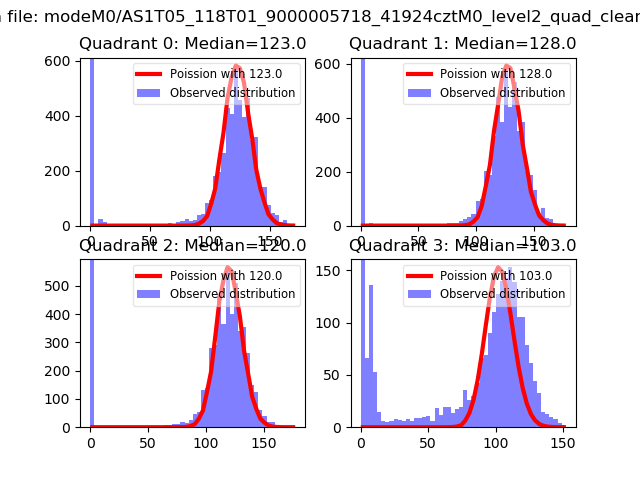 |
 |
| Quadrant-wise count rates Data is divided into 100 sec bins |
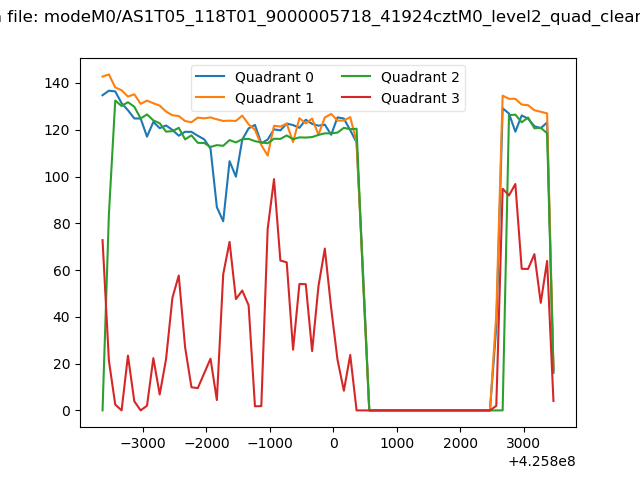 |
|
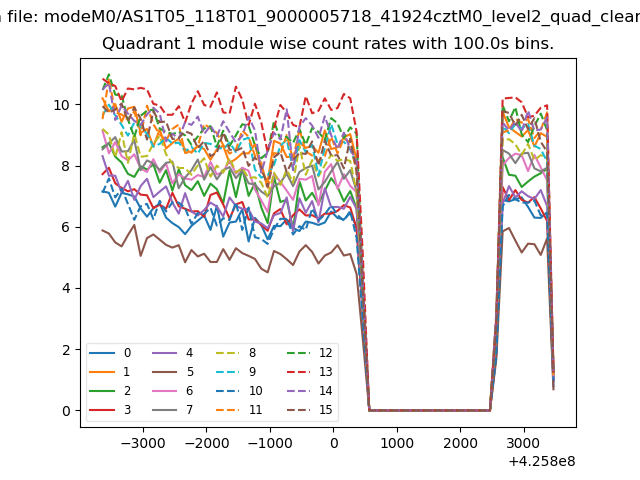
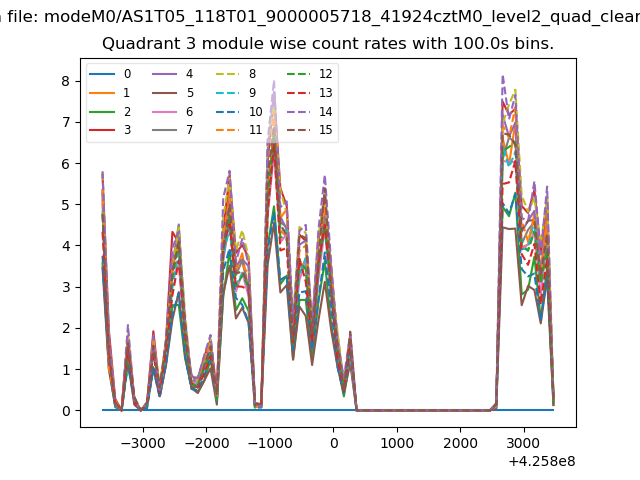
| Module-wise count rates for Quadrant A Data is divided into 100 sec bins |
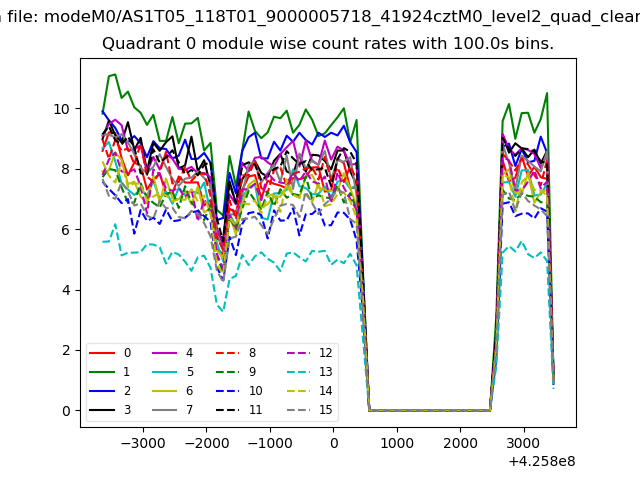 |
 |
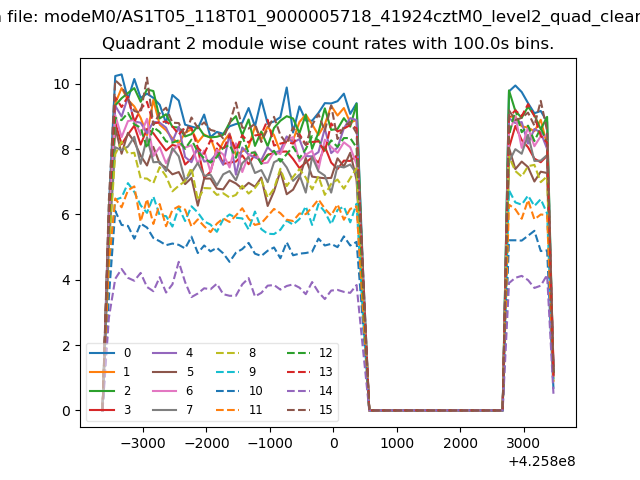
| Module-wise count rates for Quadrant B Data is divided into 100 sec bins |
 |
 |
| Module-wise count rates for Quadrant C Data is divided into 100 sec bins |
 |
 |
| Module-wise count rates for Quadrant D Data is divided into 100 sec bins |
 |
 |
| Parameter | Plot |
|---|---|
| CZT HV Monitor | 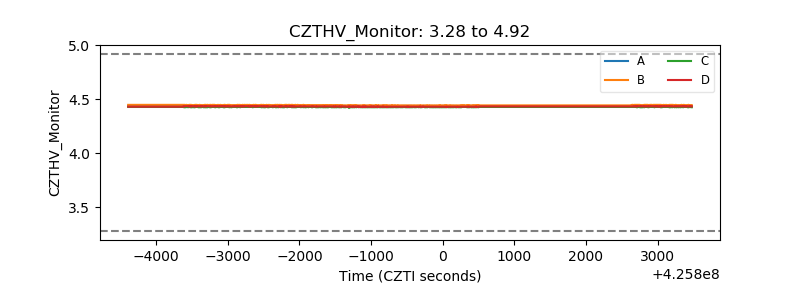 |
| D_VDD | 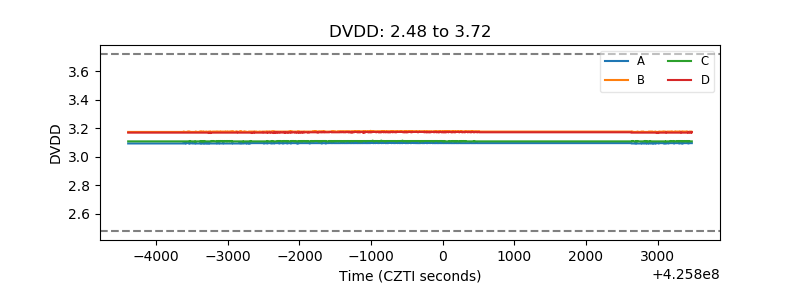 |
| Temperature 1 | 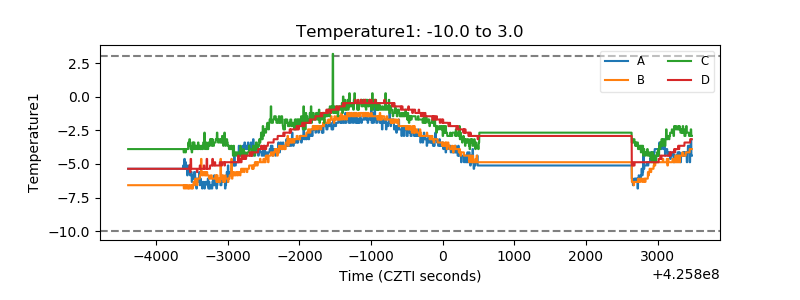 |
| Veto HV Monitor | 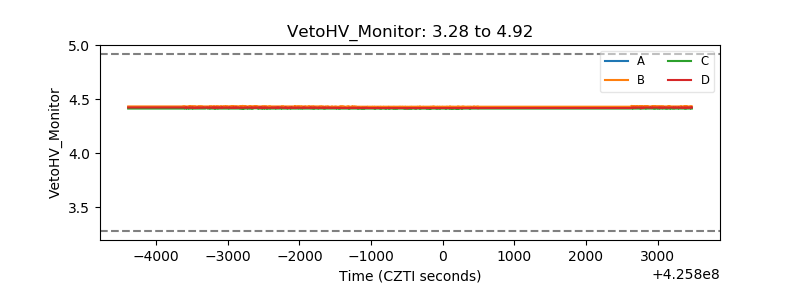 |
| Veto LLD | 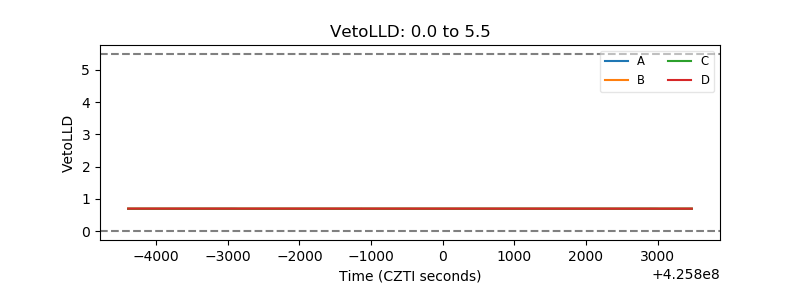 |
| Alpha Counter | 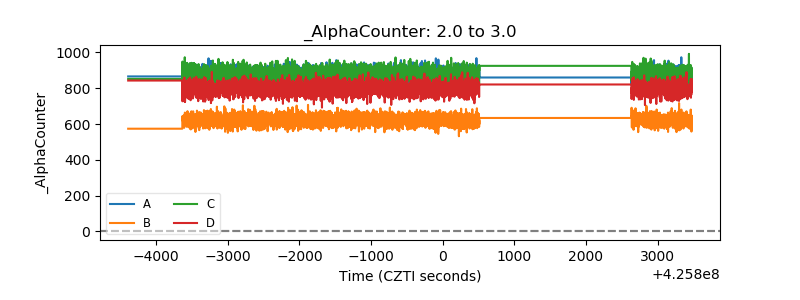 |
| _CPM_Rate | 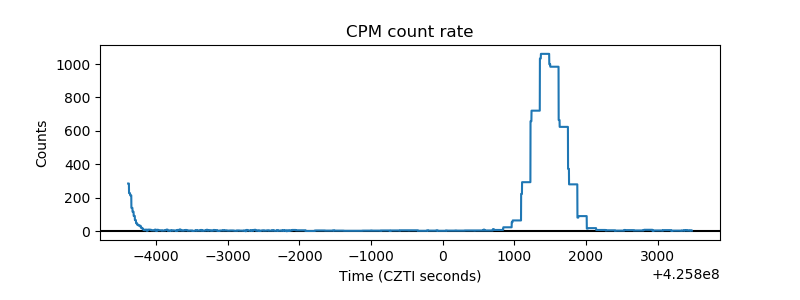 |
| CZT Counter | 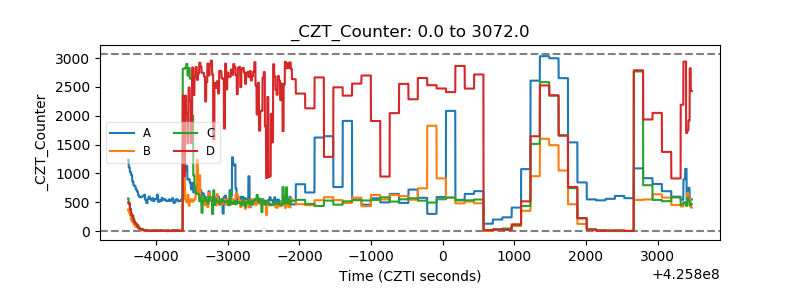 |
| +2.5 Volts monitor | 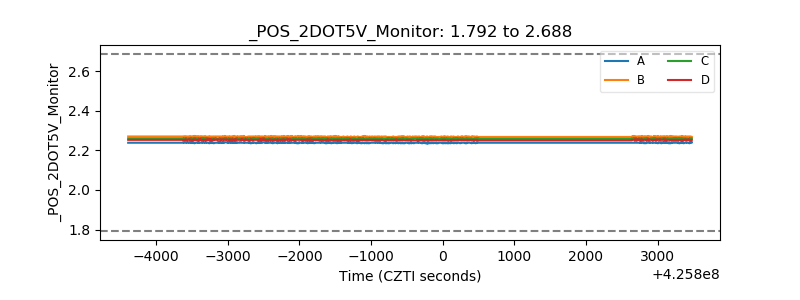 |
| +5 Volts monitor | 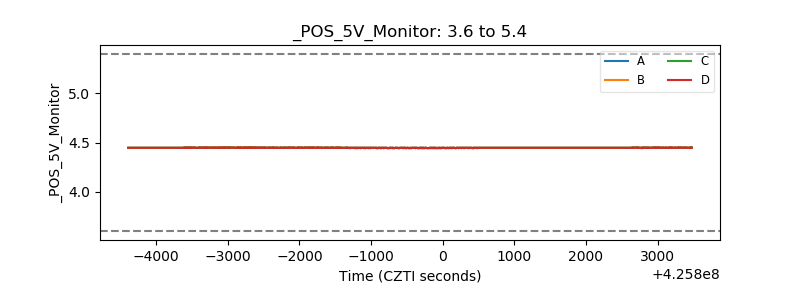 |
| _ROLL_ROT | 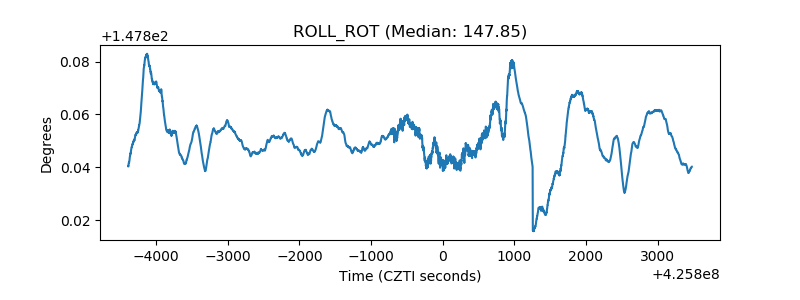 |
| _Roll_DEC | 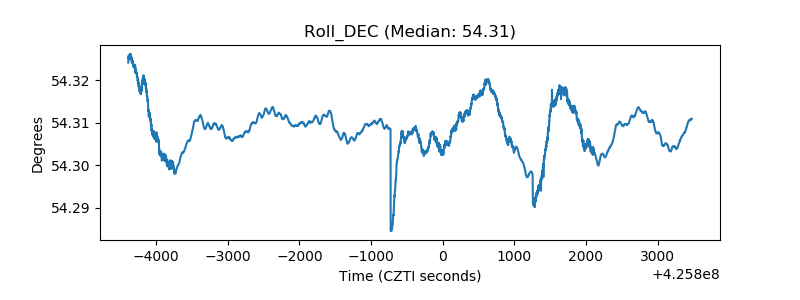 |
| _Roll_RA | 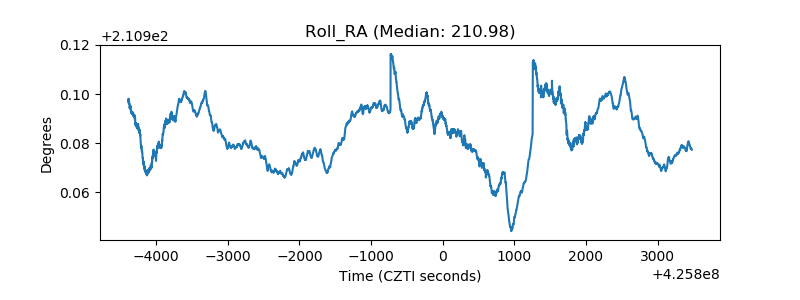 |
| Veto Counter | 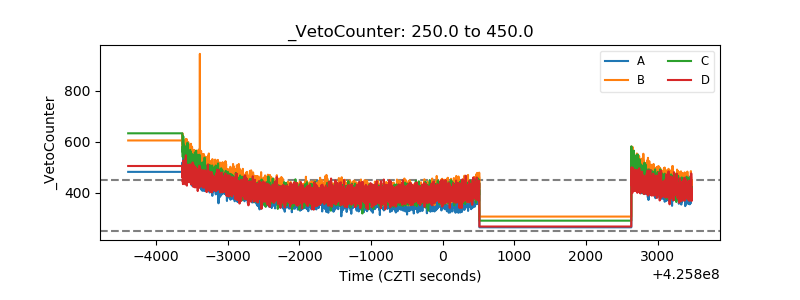 |