| Param | Original file | Final file |
|---|---|---|
| Filename | modeM0/AS1T05_118T01_9000005718_41925cztM0_level2.fits | modeM0/AS1T05_118T01_9000005718_41925cztM0_level2_quad_clean.evt |
| Size (bytes) | 566,804,160 | 74,577,600 |
| Size | 540.5 MB | 71.1 MB |
| Events in quadrant A | 3,798,945 | 556,224 |
| Events in quadrant B | 2,942,607 | 598,347 |
| Events in quadrant C | 3,143,069 | 541,279 |
| Events in quadrant D | 10,715,329 | 217,807 |
| Mode SS | |||
|---|---|---|---|
| Quadrant | BADHDUFLAG | Total packets | Discarded packets |
| A | 0 | 100 | 0 |
| B | 0 | 100 | 0 |
| C | 0 | 100 | 0 |
| D | 0 | 100 | 0 |
| Mode M9 | |||
|---|---|---|---|
| Quadrant | BADHDUFLAG | Total packets | Discarded packets |
| A | 0 | 33 | 0 |
| B | 0 | 34 | 0 |
| C | 0 | 34 | 0 |
| D | 0 | 34 | 0 |
| Mode M0 | |||
|---|---|---|---|
| Quadrant | BADHDUFLAG | Total packets | Discarded packets |
| A | 0 | 14411 | 2 |
| B | 0 | 11830 | 2 |
| C | 0 | 12103 | 2 |
| D | 0 | 35166 | 2 |
| Quadrant | Total seconds | Saturated seconds | Saturation percentage |
|---|---|---|---|
| A | 4909 | 332 | 6.763088% |
| B | 4909 | 86 | 1.751884% |
| C | 4909 | 258 | 5.255653% |
| D | 4909 | 3175 | 64.677124% |
Noise dominated data is calculated using 1-second bins in cleaned event files. If a bin has >2000 counts, and if more than 50% of those come from <1% of pixels, then it is considered to be noise-dominated and hence unusable.
| Quadrant | # 1 sec bins | Bins with >0 counts | Bins with >2000 counts | High rate bins dominated by noise | Noise dominated (total time) | Noise dominated (detector-on time) | Marked lightcurve |
|---|---|---|---|---|---|---|---|
| A | 7031 | 4910 | 240 | 240 | 3.41% | 4.89% | 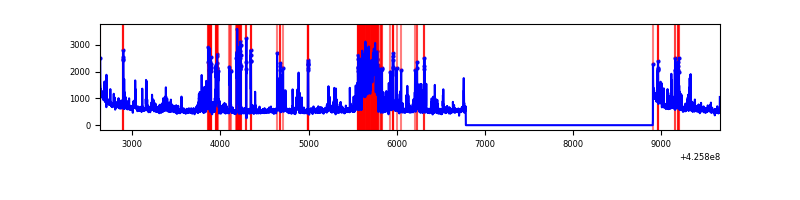 |
| B | 7031 | 4910 | 61 | 61 | 0.87% | 1.24% | 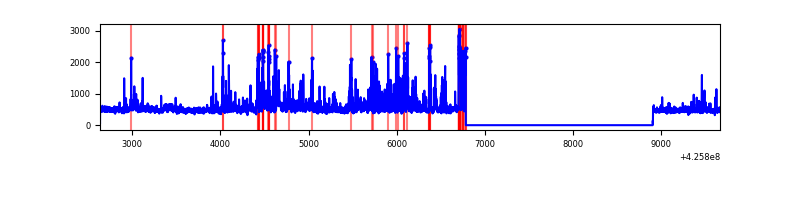 |
| C | 7031 | 4910 | 252 | 252 | 3.58% | 5.13% | 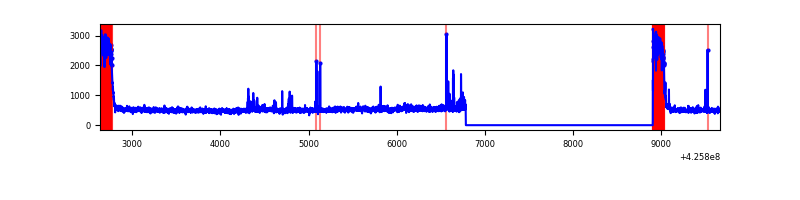 |
| D | 7031 | 4910 | 3218 | 3218 | 45.77% | 65.54% | 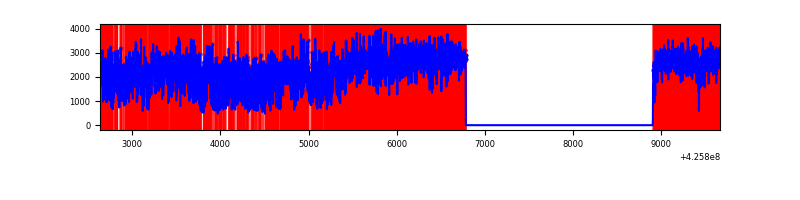 |
Top three noisy pixels from each quadrant. If the there are fewer than three noisy pixels in the level2.evt file, extra rows are filled as -1
| Pixel properties | Quadrant properties | ||||||
|---|---|---|---|---|---|---|---|
| Quadrant | DetID | PixID | Counts | Sigma | Mean | Median | Sigma |
| A | 14 | 24 | 1098660 | 9922.34 | 547 | 536 | 110.7 |
| A | 10 | 83 | 539926 | 4873.78 | 547 | 536 | 110.7 |
| A | 13 | 6 | 24004 | 212.05 | 547 | 536 | 110.7 |
| B | 0 | 229 | 375696 | 3555.39 | 554 | 539 | 105.5 |
| B | 5 | 255 | 161696 | 1527.29 | 554 | 539 | 105.5 |
| B | 0 | 190 | 90801 | 855.42 | 554 | 539 | 105.5 |
| C | 0 | 10 | 753378 | 6197.62 | 523 | 526 | 121.5 |
| C | 15 | 214 | 198296 | 1628.08 | 523 | 526 | 121.5 |
| C | 4 | 254 | 79937 | 653.73 | 523 | 526 | 121.5 |
| D | 12 | 79 | 8615992 | 97553.57 | 361 | 352 | 88.3 |
| D | 13 | 249 | 232829 | 2632.3 | 361 | 352 | 88.3 |
| D | 1 | 52 | 92226 | 1040.28 | 361 | 352 | 88.3 |
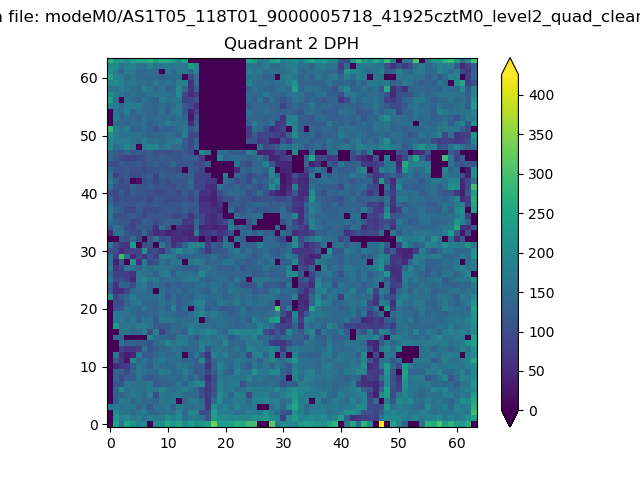
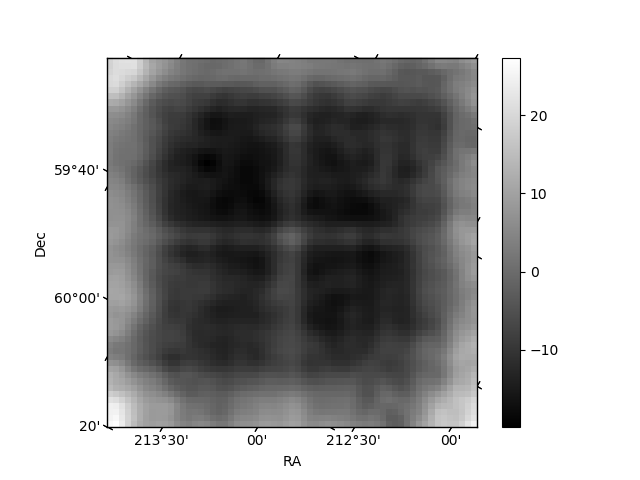
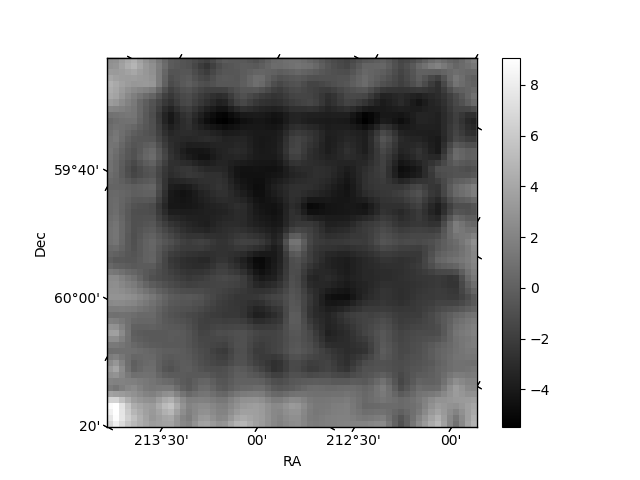
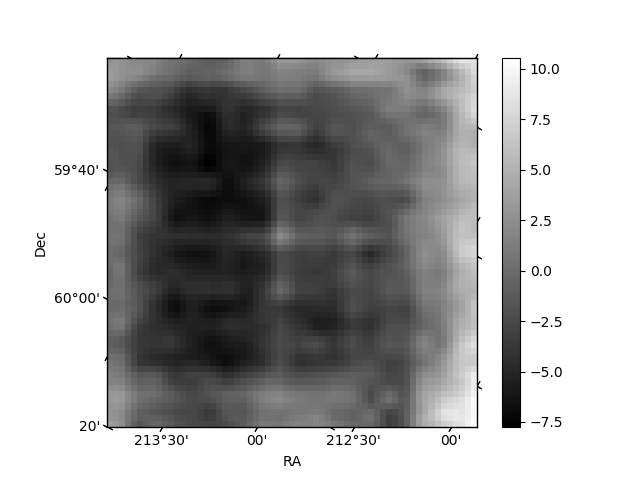
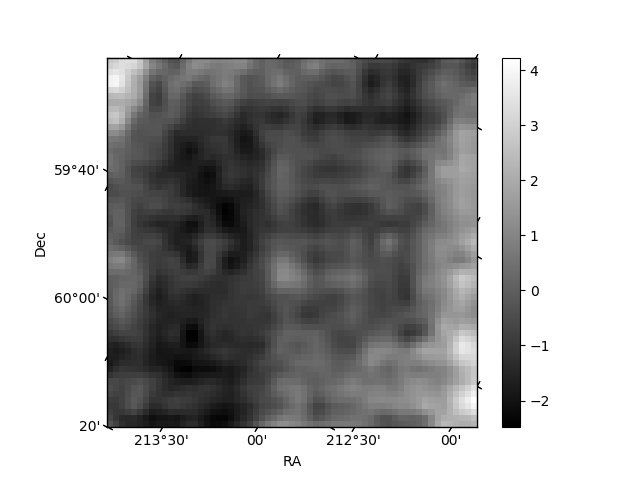
Histogram calculated using DETX and DETY for each event in the final _common_clean file
| Quadrant A | 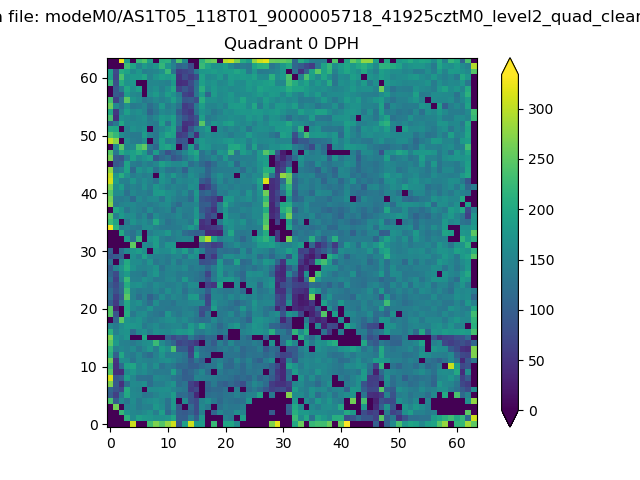 |
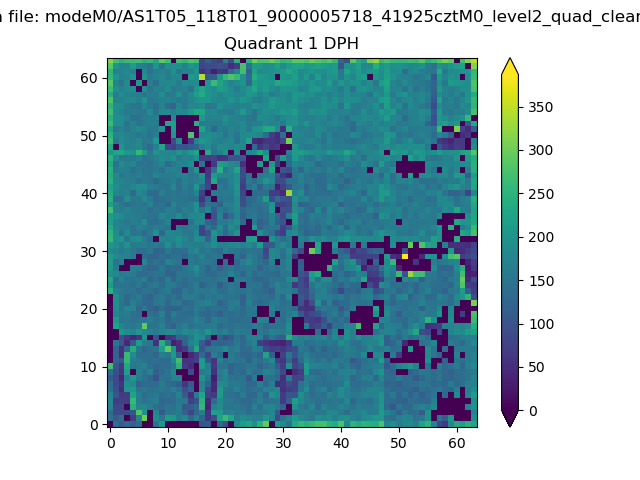 |
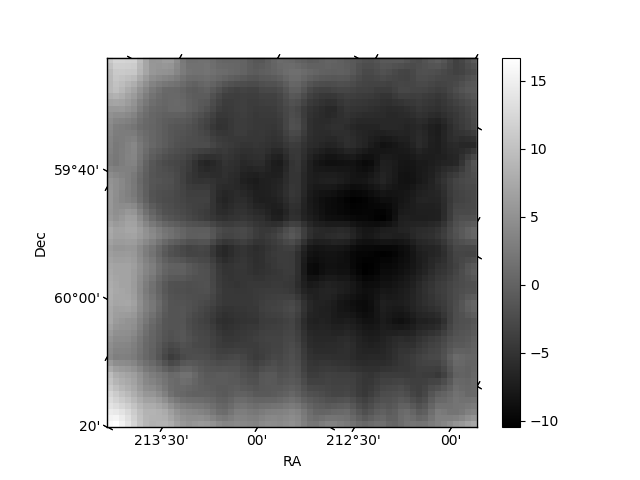
Quadrant B |
|---|---|---|---|
| Quadrant D | 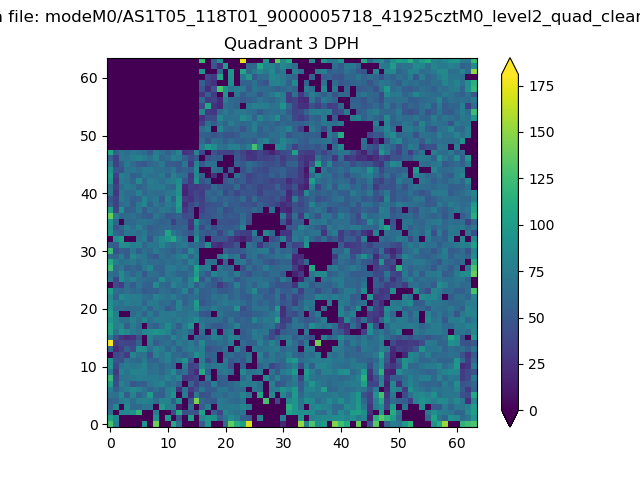 |
 |
Quadrant C |
| Plot type | Count rate plots | Images |
|---|---|---|
| Comparison with Poisson distribution Blue bars denote a histogram of data divided into 1 sec bins. Red curve is a Poisson curve with rate = median count rate of data. |
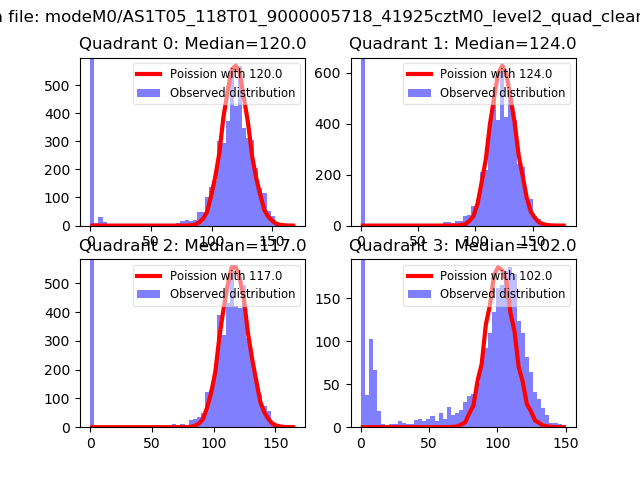 |
 |
| Quadrant-wise count rates Data is divided into 100 sec bins |
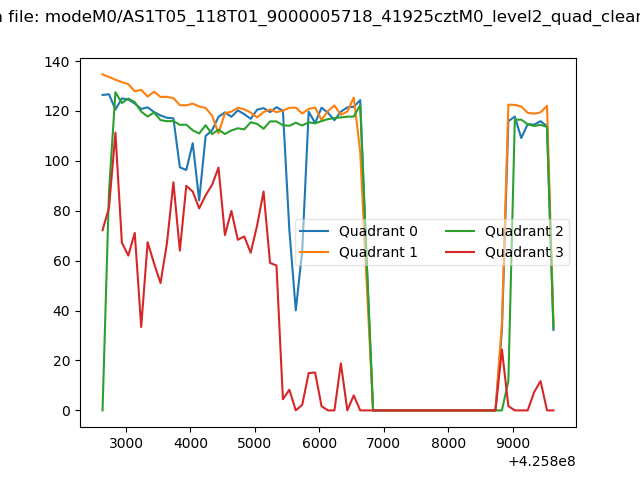 |
|
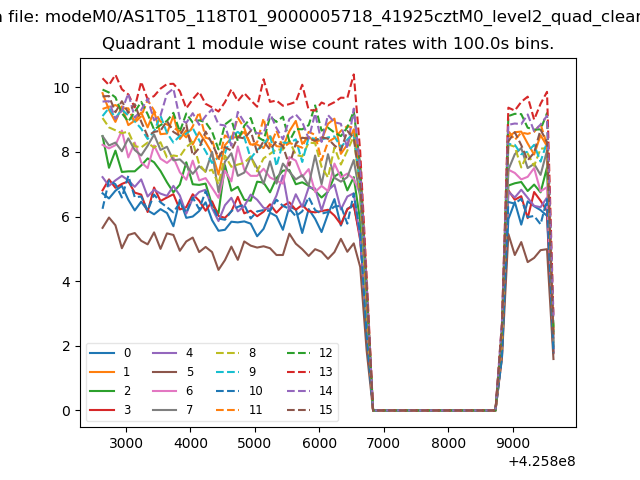
| Module-wise count rates for Quadrant A Data is divided into 100 sec bins |
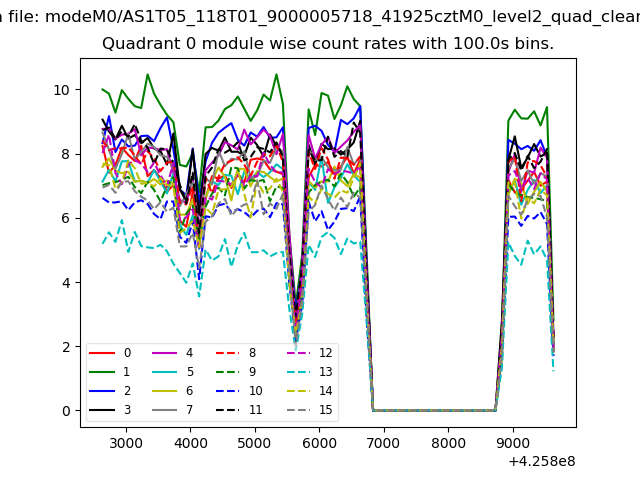 |
 |
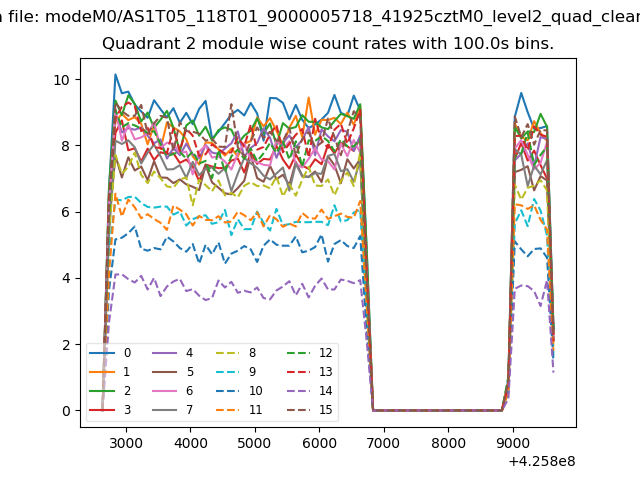
| Module-wise count rates for Quadrant B Data is divided into 100 sec bins |
 |
 |
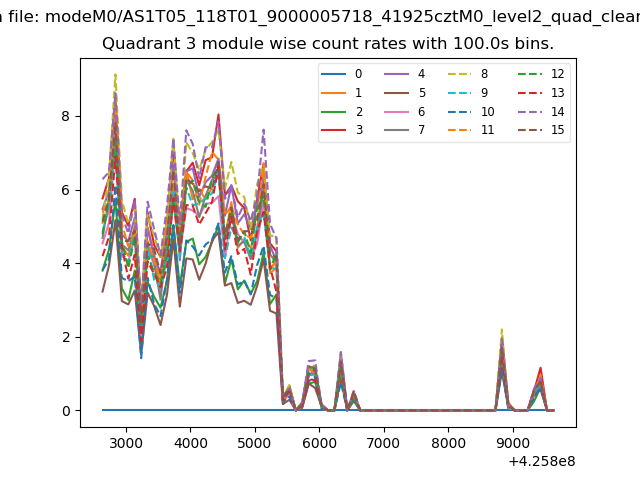
| Module-wise count rates for Quadrant C Data is divided into 100 sec bins |
 |
 |
| Module-wise count rates for Quadrant D Data is divided into 100 sec bins |
 |
 |
| Parameter | Plot |
|---|---|
| CZT HV Monitor | 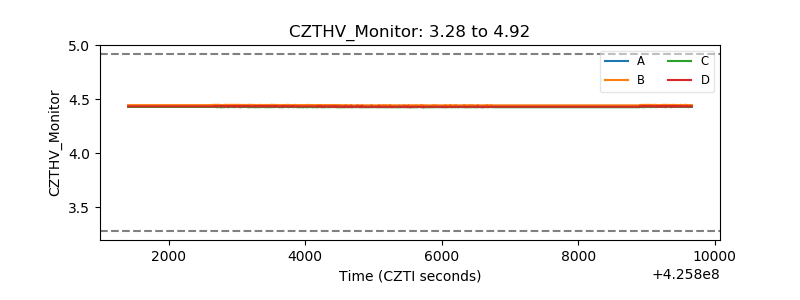 |
| D_VDD | 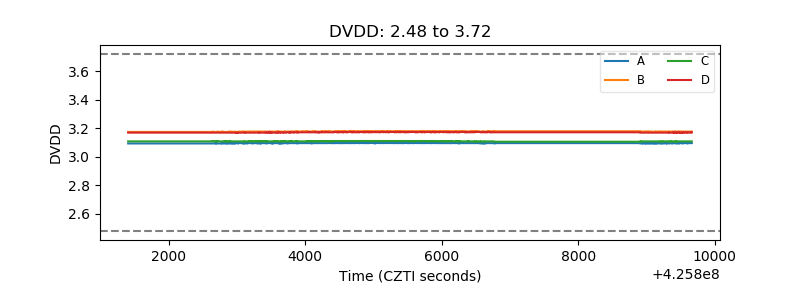 |
| Temperature 1 | 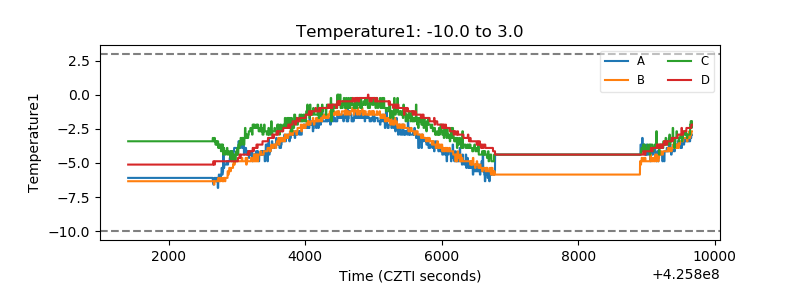 |
| Veto HV Monitor | 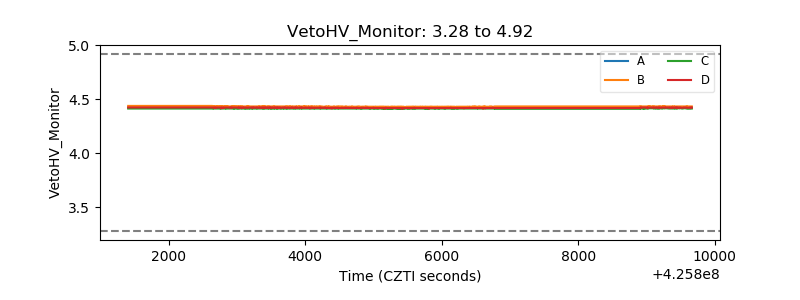 |
| Veto LLD | 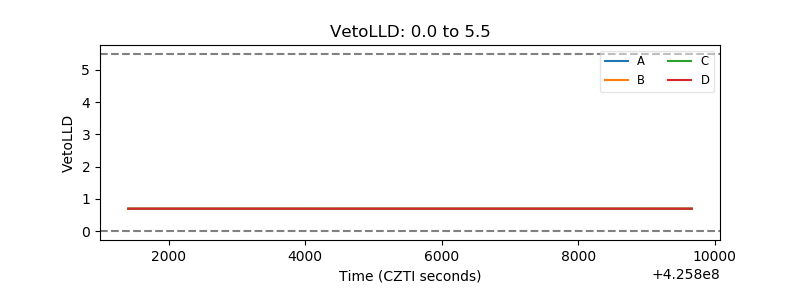 |
| Alpha Counter | 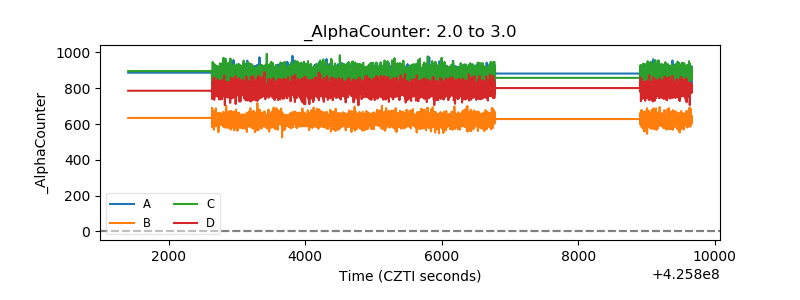 |
| _CPM_Rate | 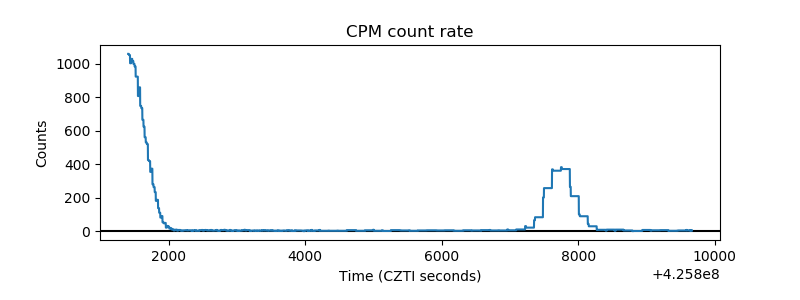 |
| CZT Counter | 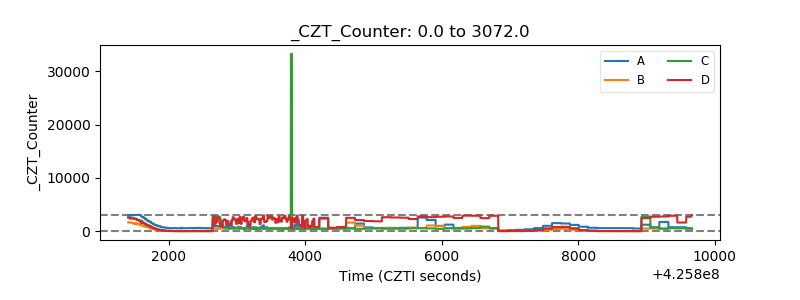 |
| +2.5 Volts monitor |  |
| +5 Volts monitor | 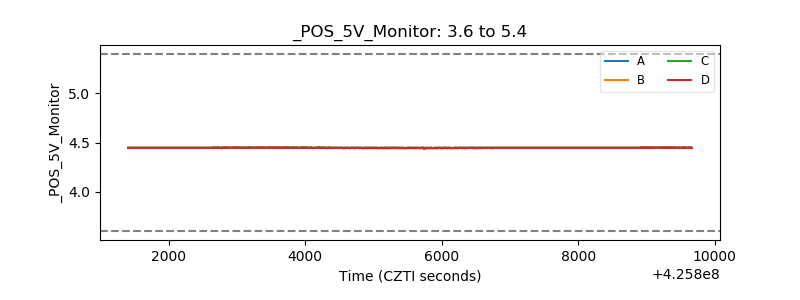 |
| _ROLL_ROT | 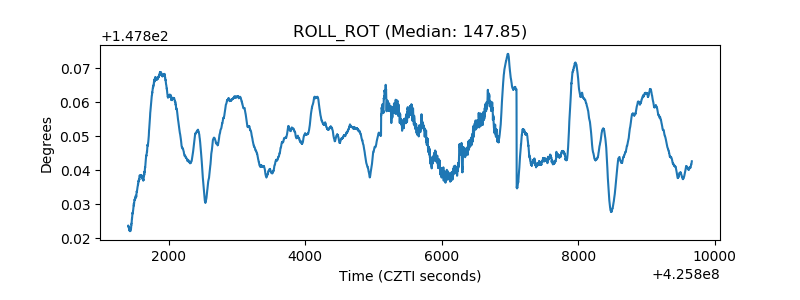 |
| _Roll_DEC | 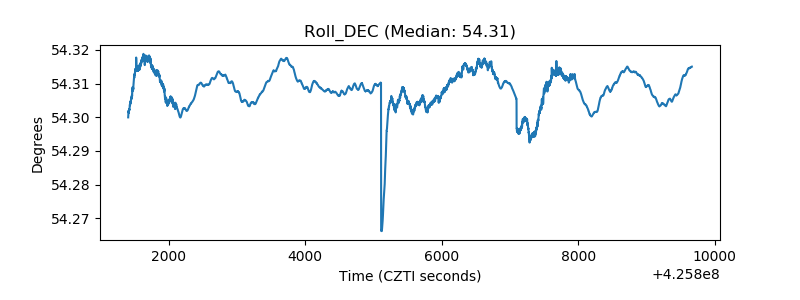 |
| _Roll_RA | 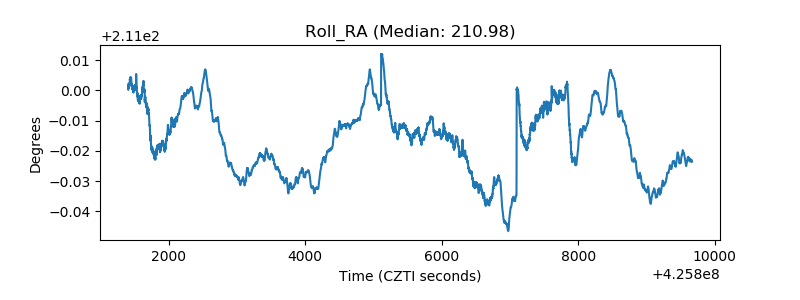 |
| Veto Counter | 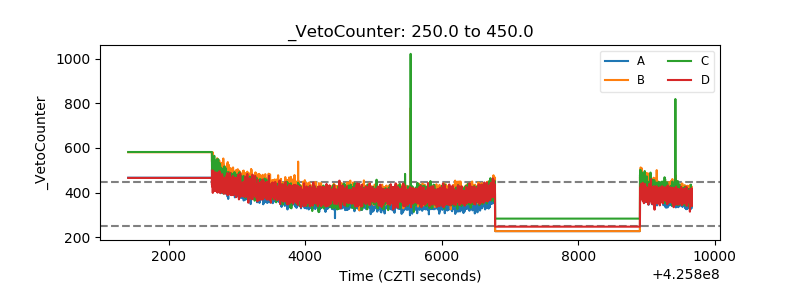 |