| Param | Original file | Final file |
|---|---|---|
| Filename | modeM0/AS1T05_118T01_9000005718_41926cztM0_level2.fits | modeM0/AS1T05_118T01_9000005718_41926cztM0_level2_quad_clean.evt |
| Size (bytes) | 471,340,800 | 47,917,440 |
| Size | 449.5 MB | 45.7 MB |
| Events in quadrant A | 2,721,230 | 399,761 |
| Events in quadrant B | 2,279,794 | 411,483 |
| Events in quadrant C | 2,368,324 | 381,973 |
| Events in quadrant D | 9,798,232 | 3,726 |
| Mode SS | |||
|---|---|---|---|
| Quadrant | BADHDUFLAG | Total packets | Discarded packets |
| A | 0 | 72 | 0 |
| B | 0 | 72 | 0 |
| C | 0 | 72 | 0 |
| D | 0 | 72 | 0 |
| Mode M0 | |||
|---|---|---|---|
| Quadrant | BADHDUFLAG | Total packets | Discarded packets |
| A | 0 | 10311 | 0 |
| B | 0 | 9119 | 0 |
| C | 0 | 9184 | 0 |
| D | 0 | 31351 | 0 |
| Quadrant | Total seconds | Saturated seconds | Saturation percentage |
|---|---|---|---|
| A | 3586 | 166 | 4.629113% |
| B | 3587 | 124 | 3.456928% |
| C | 3587 | 177 | 4.934486% |
| D | 3587 | 3561 | 99.275160% |
Noise dominated data is calculated using 1-second bins in cleaned event files. If a bin has >2000 counts, and if more than 50% of those come from <1% of pixels, then it is considered to be noise-dominated and hence unusable.
| Quadrant | # 1 sec bins | Bins with >0 counts | Bins with >2000 counts | High rate bins dominated by noise | Noise dominated (total time) | Noise dominated (detector-on time) | Marked lightcurve |
|---|---|---|---|---|---|---|---|
| A | 3586 | 3586 | 115 | 115 | 3.21% | 3.21% | 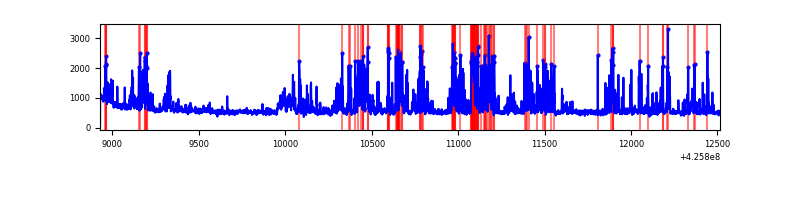 |
| B | 3587 | 3587 | 99 | 99 | 2.76% | 2.76% | 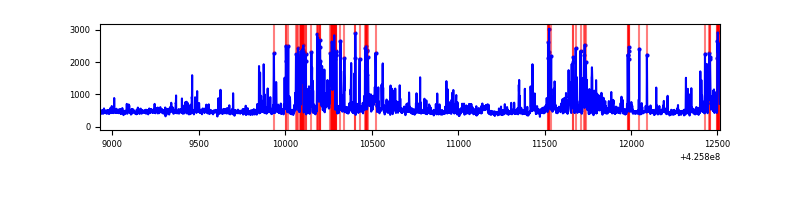 |
| C | 3587 | 3587 | 179 | 179 | 4.99% | 4.99% | 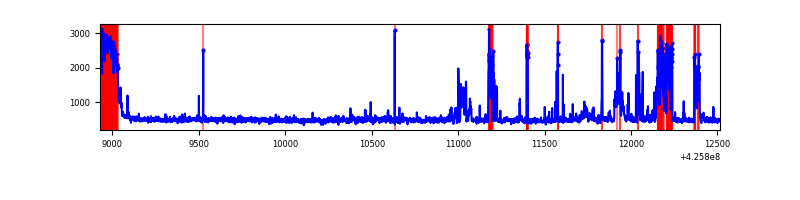 |
| D | 3587 | 3587 | 3477 | 3477 | 96.93% | 96.93% | 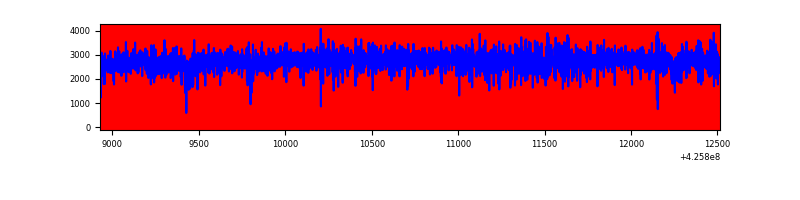 |
Top three noisy pixels from each quadrant. If the there are fewer than three noisy pixels in the level2.evt file, extra rows are filled as -1
| Pixel properties | Quadrant properties | ||||||
|---|---|---|---|---|---|---|---|
| Quadrant | DetID | PixID | Counts | Sigma | Mean | Median | Sigma |
| A | 14 | 24 | 783077 | 9771.02 | 386 | 379 | 80.1 |
| A | 10 | 83 | 344307 | 4293.52 | 386 | 379 | 80.1 |
| A | 14 | 250 | 81567 | 1013.53 | 386 | 379 | 80.1 |
| B | 5 | 255 | 322250 | 4363.61 | 383 | 373 | 73.8 |
| B | 0 | 229 | 266133 | 3602.85 | 383 | 373 | 73.8 |
| B | 0 | 190 | 69333 | 934.87 | 383 | 373 | 73.8 |
| C | 14 | 254 | 355701 | 4100.81 | 371 | 372 | 86.6 |
| C | 0 | 10 | 307558 | 3545.19 | 371 | 372 | 86.6 |
| C | 15 | 214 | 144206 | 1659.97 | 371 | 372 | 86.6 |
| D | 12 | 79 | 8892080 | 335033.98 | 101 | 98 | 26.5 |
| D | 13 | 249 | 187649 | 7066.59 | 101 | 98 | 26.5 |
| D | 1 | 52 | 101128 | 3806.63 | 101 | 98 | 26.5 |
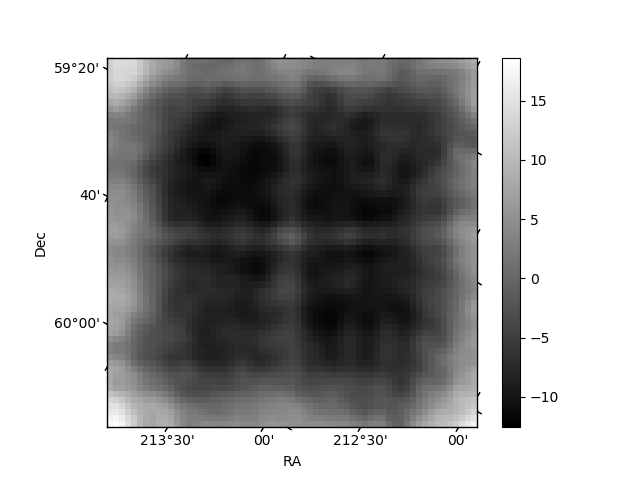
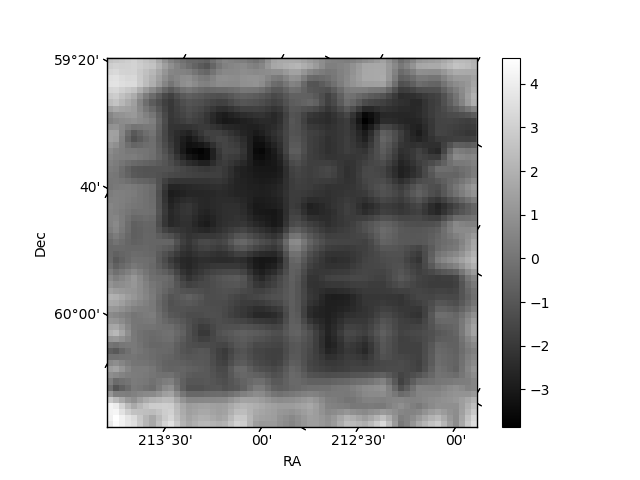
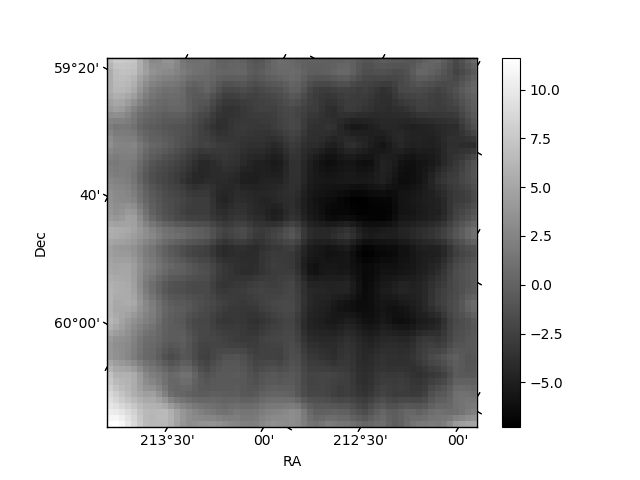
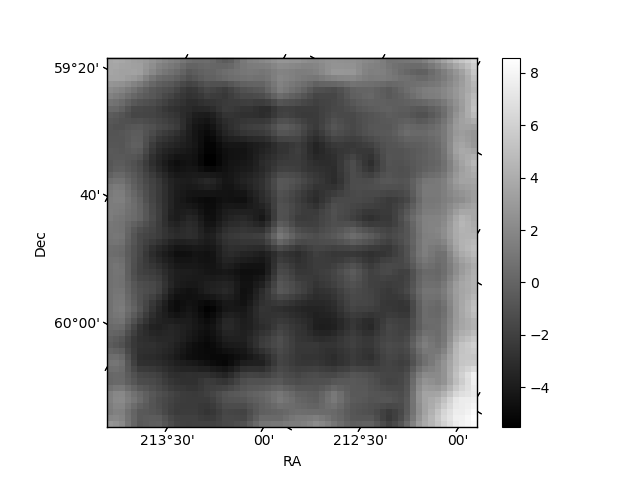
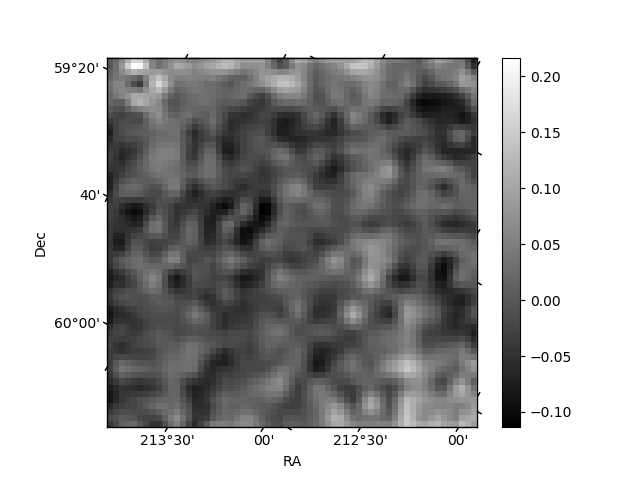
Histogram calculated using DETX and DETY for each event in the final _common_clean file
| Quadrant A | 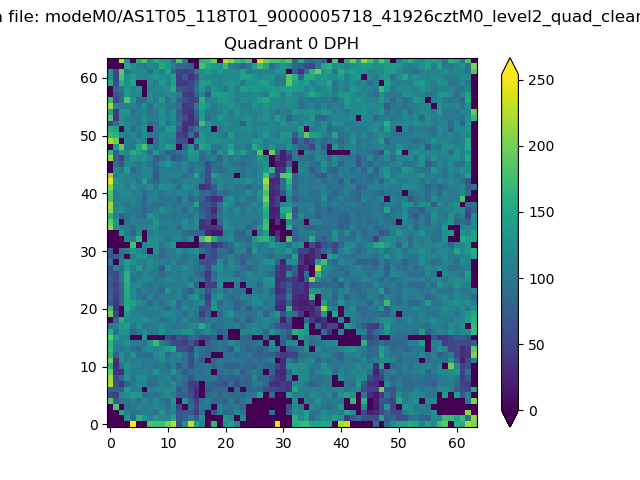 |
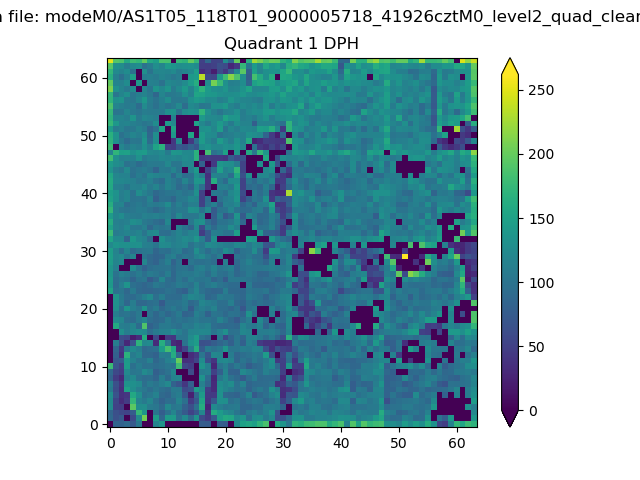 |
Quadrant B |
|---|---|---|---|
| Quadrant D | 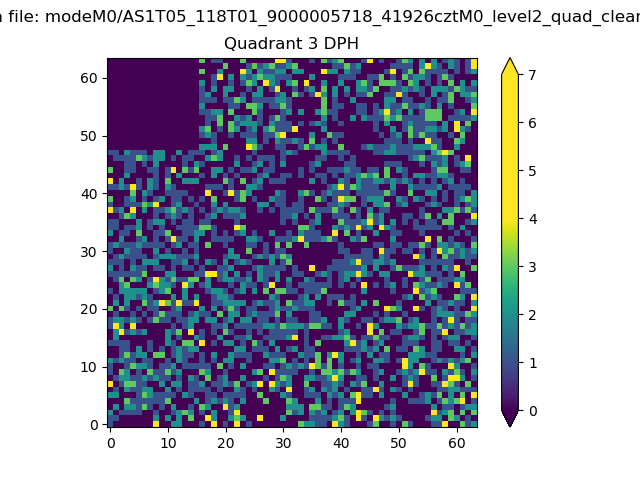 |
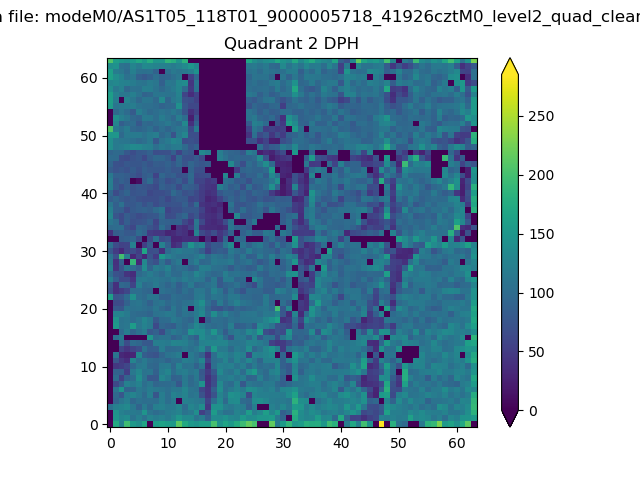 |
Quadrant C |
| Plot type | Count rate plots | Images |
|---|---|---|
| Comparison with Poisson distribution Blue bars denote a histogram of data divided into 1 sec bins. Red curve is a Poisson curve with rate = median count rate of data. |
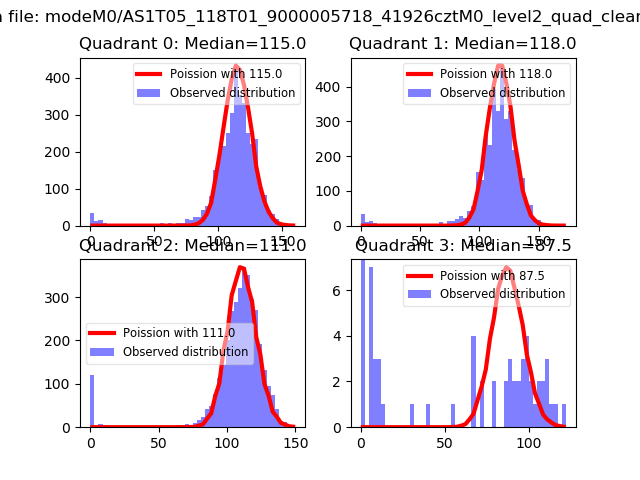 |
 |
| Quadrant-wise count rates Data is divided into 100 sec bins |
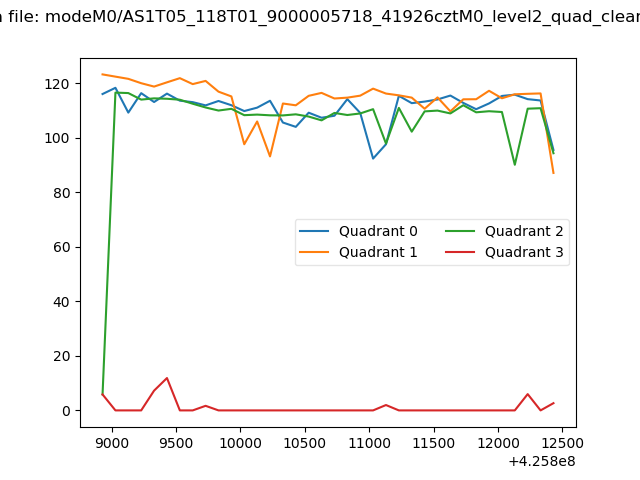 |
|
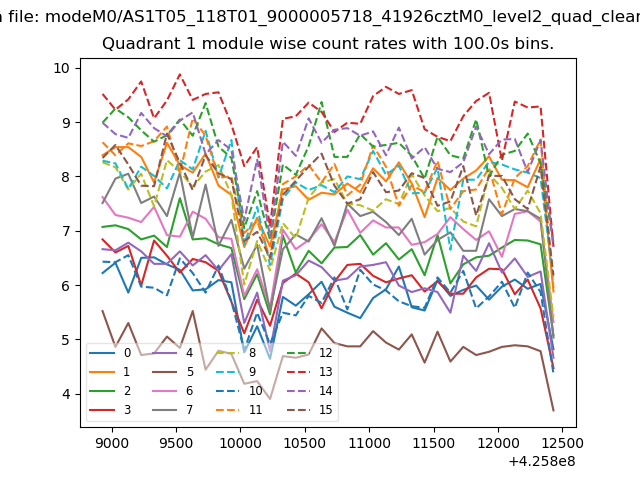
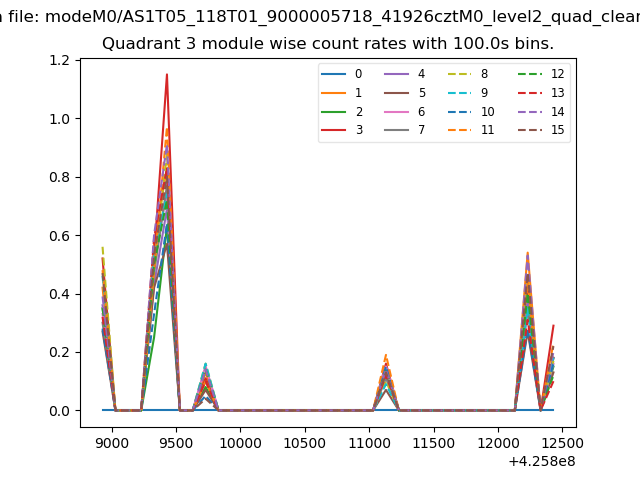
| Module-wise count rates for Quadrant A Data is divided into 100 sec bins |
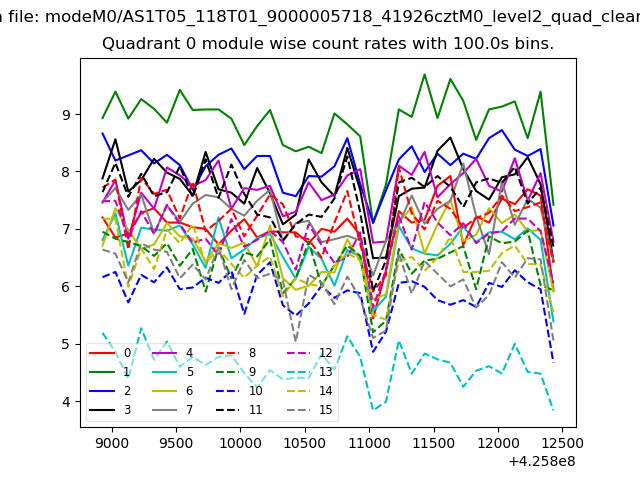 |
 |
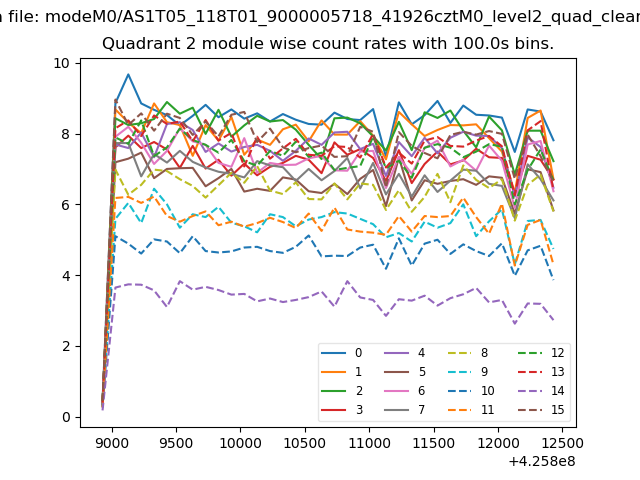
| Module-wise count rates for Quadrant B Data is divided into 100 sec bins |
 |
 |
| Module-wise count rates for Quadrant C Data is divided into 100 sec bins |
 |
 |
| Module-wise count rates for Quadrant D Data is divided into 100 sec bins |
 |
 |
| Parameter | Plot |
|---|---|
| CZT HV Monitor | 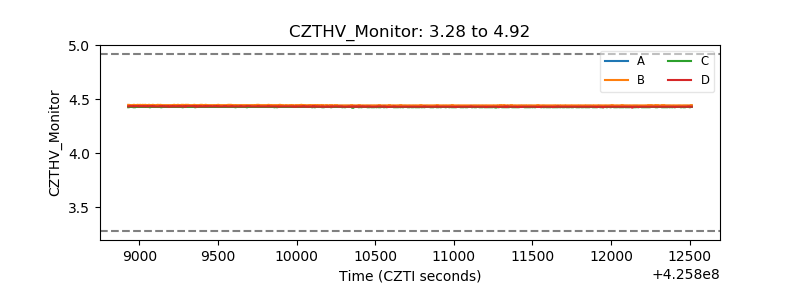 |
| D_VDD | 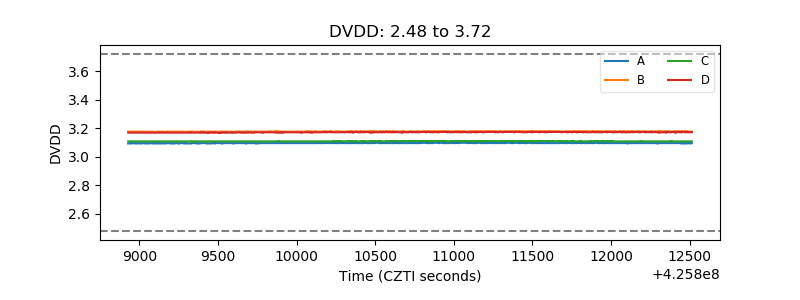 |
| Temperature 1 | 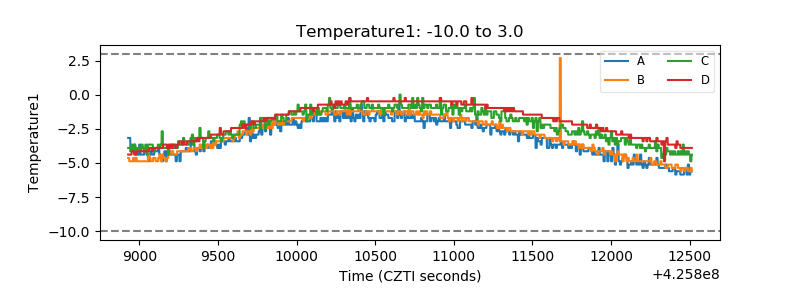 |
| Veto HV Monitor | 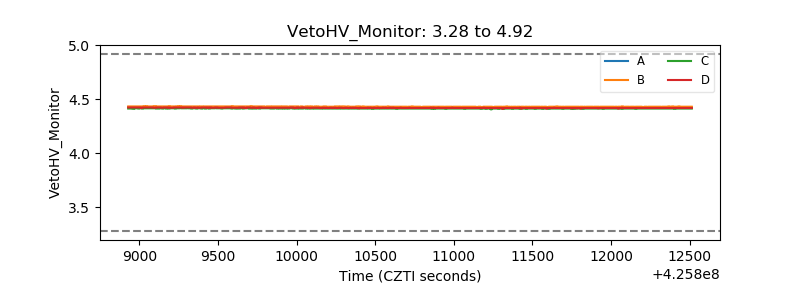 |
| Veto LLD | 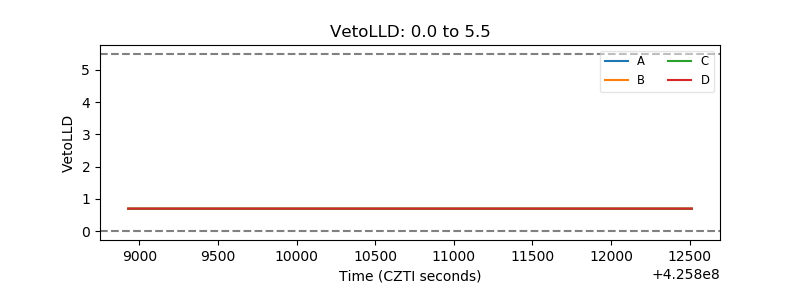 |
| Alpha Counter | 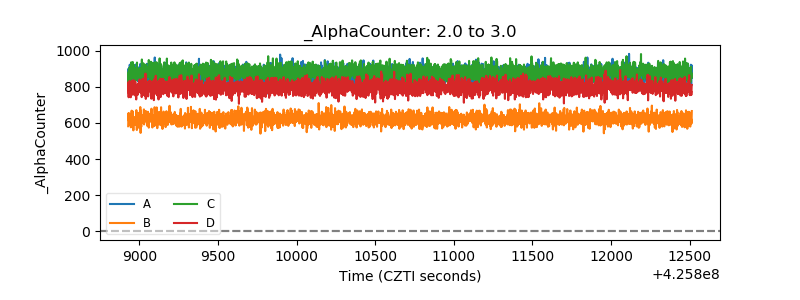 |
| _CPM_Rate | 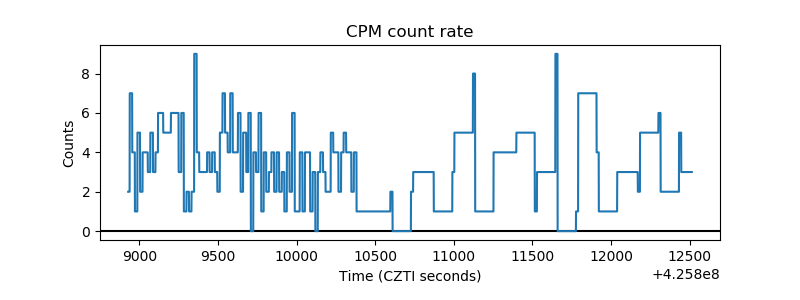 |
| CZT Counter | 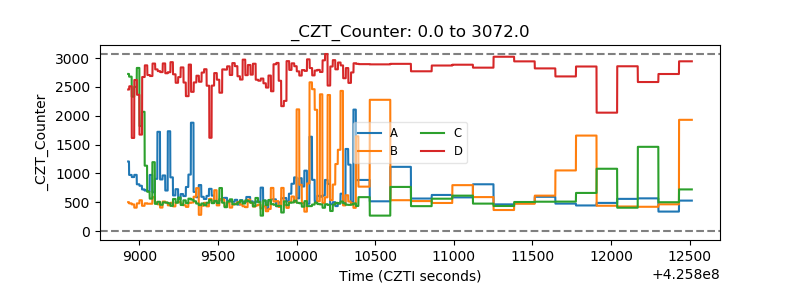 |
| +2.5 Volts monitor | 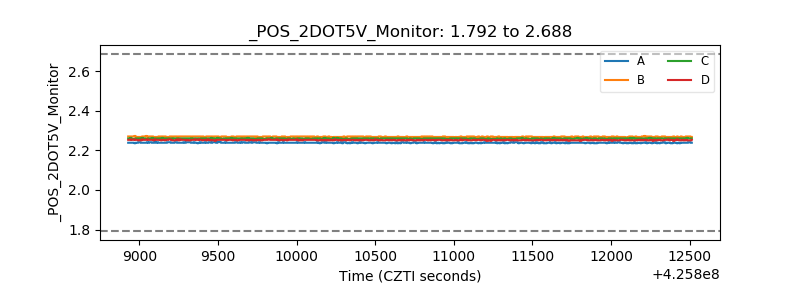 |
| +5 Volts monitor | 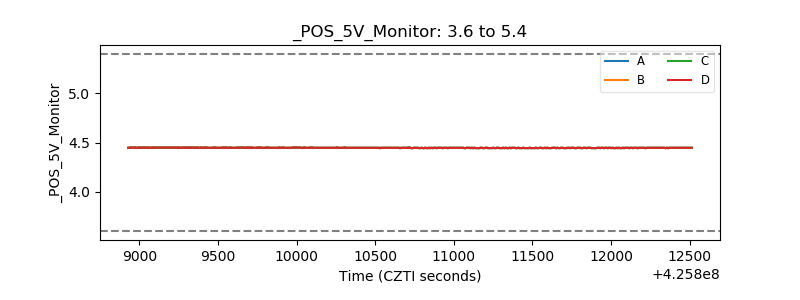 |
| _ROLL_ROT | 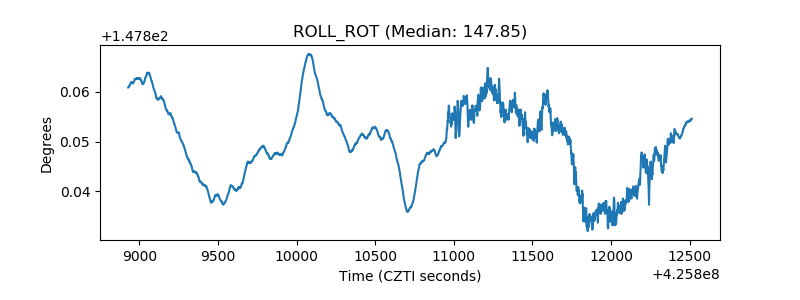 |
| _Roll_DEC | 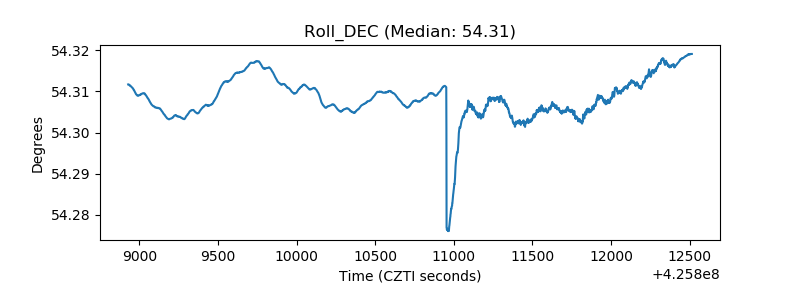 |
| _Roll_RA | 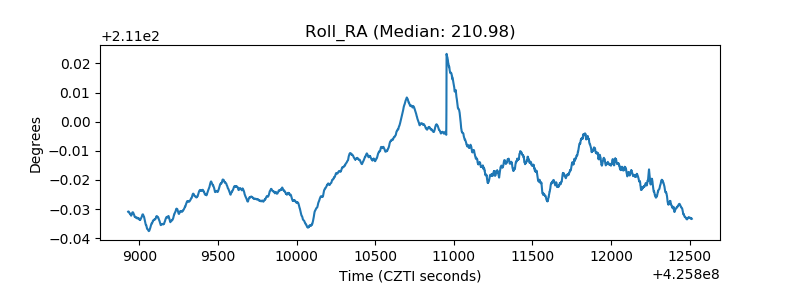 |
| Veto Counter | 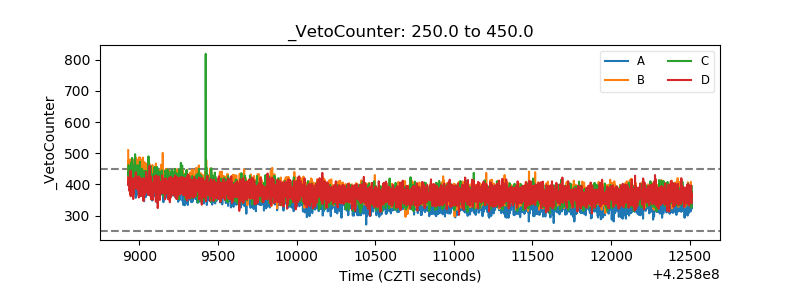 |