| Param | Original file | Final file |
|---|---|---|
| Filename | modeM0/AS1A12_099T03_9000005720_41926cztM0_level2.fits | modeM0/AS1A12_099T03_9000005720_41926cztM0_level2_quad_clean.evt |
| Size (bytes) | 124,983,360 | 13,386,240 |
| Size | 119.2 MB | 12.8 MB |
| Events in quadrant A | 633,402 | 111,954 |
| Events in quadrant B | 526,899 | 113,292 |
| Events in quadrant C | 779,457 | 97,358 |
| Events in quadrant D | 2,605,434 | 5,719 |
| Mode M0 | |||
|---|---|---|---|
| Quadrant | BADHDUFLAG | Total packets | Discarded packets |
| A | 0 | 2503 | 1 |
| B | 0 | 2275 | 1 |
| C | 0 | 2902 | 1 |
| D | 0 | 8397 | 1 |
| Mode SS | |||
|---|---|---|---|
| Quadrant | BADHDUFLAG | Total packets | Discarded packets |
| A | 0 | 20 | 0 |
| B | 0 | 20 | 0 |
| C | 0 | 20 | 0 |
| D | 0 | 20 | 0 |
| Mode M9 | |||
|---|---|---|---|
| Quadrant | BADHDUFLAG | Total packets | Discarded packets |
| A | 0 | 13 | 0 |
| B | 0 | 13 | 0 |
| C | 0 | 13 | 0 |
| D | 0 | 13 | 0 |
| Quadrant | Total seconds | Saturated seconds | Saturation percentage |
|---|---|---|---|
| A | 1005 | 11 | 1.094527% |
| B | 1005 | 23 | 2.288557% |
| C | 1005 | 121 | 12.039801% |
| D | 1005 | 966 | 96.119403% |
Noise dominated data is calculated using 1-second bins in cleaned event files. If a bin has >2000 counts, and if more than 50% of those come from <1% of pixels, then it is considered to be noise-dominated and hence unusable.
| Quadrant | # 1 sec bins | Bins with >0 counts | Bins with >2000 counts | High rate bins dominated by noise | Noise dominated (total time) | Noise dominated (detector-on time) | Marked lightcurve |
|---|---|---|---|---|---|---|---|
| A | 1005 | 1005 | 8 | 8 | 0.80% | 0.80% | 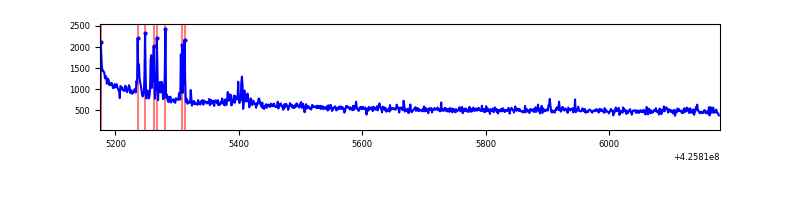 |
| B | 1005 | 1005 | 16 | 16 | 1.59% | 1.59% | 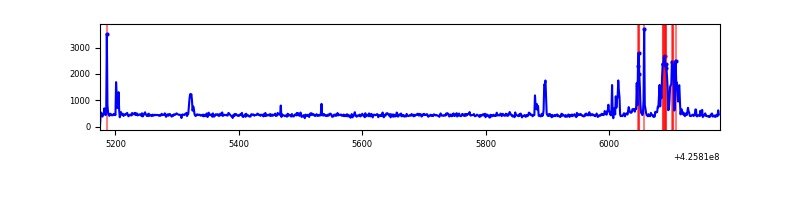 |
| C | 1005 | 1005 | 118 | 118 | 11.74% | 11.74% | 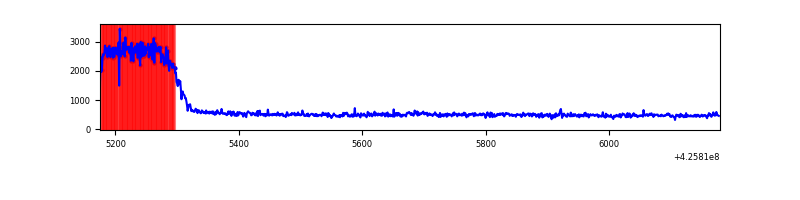 |
| D | 1005 | 1005 | 941 | 941 | 93.63% | 93.63% | 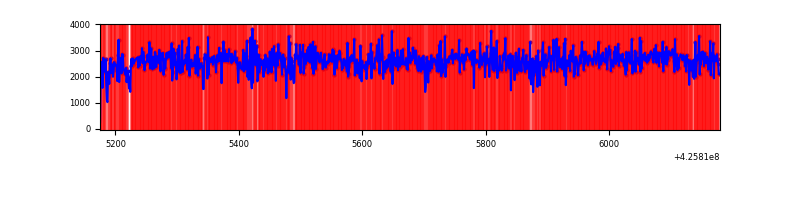 |
Top three noisy pixels from each quadrant. If the there are fewer than three noisy pixels in the level2.evt file, extra rows are filled as -1
| Pixel properties | Quadrant properties | ||||||
|---|---|---|---|---|---|---|---|
| Quadrant | DetID | PixID | Counts | Sigma | Mean | Median | Sigma |
| A | 10 | 83 | 158465 | 6433.68 | 111 | 108 | 24.6 |
| A | 14 | 24 | 39641 | 1606.13 | 111 | 108 | 24.6 |
| A | 2 | 79 | 3254 | 127.81 | 111 | 108 | 24.6 |
| B | 5 | 255 | 72453 | 3152.34 | 107 | 104 | 23.0 |
| B | 0 | 229 | 26581 | 1153.64 | 107 | 104 | 23.0 |
| B | 7 | 202 | 3947 | 167.44 | 107 | 104 | 23.0 |
| C | 0 | 10 | 341009 | 13684.85 | 99 | 99 | 24.9 |
| C | 15 | 214 | 40962 | 1640.33 | 99 | 99 | 24.9 |
| C | 0 | 15 | 7312 | 289.55 | 99 | 99 | 24.9 |
| D | 12 | 79 | 2291587 | 152746.53 | 53 | 52 | 15.0 |
| D | 12 | 218 | 41506 | 2763.19 | 53 | 52 | 15.0 |
| D | 2 | 249 | 39366 | 2620.55 | 53 | 52 | 15.0 |
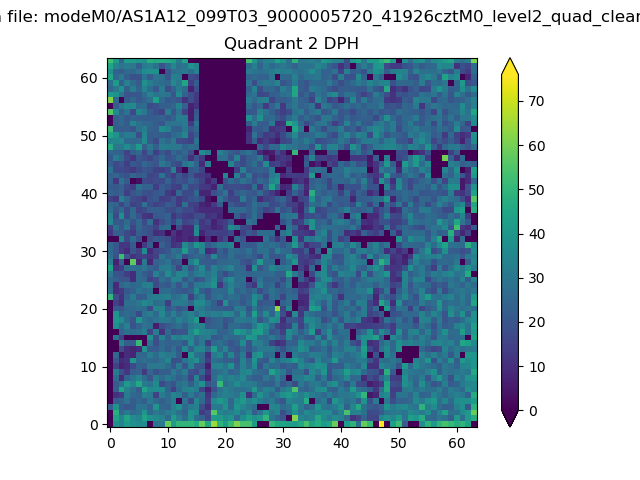
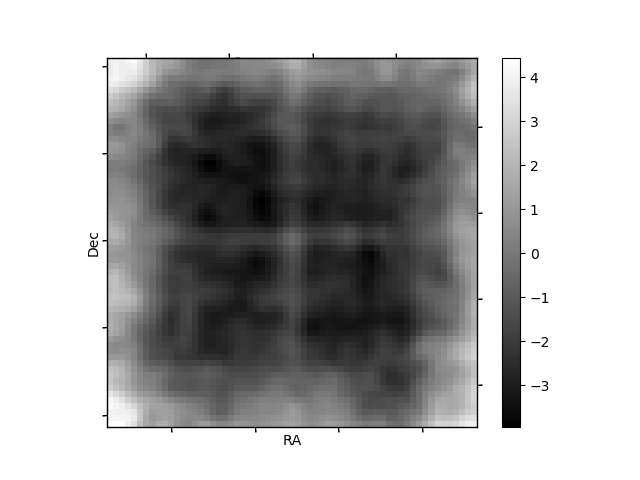
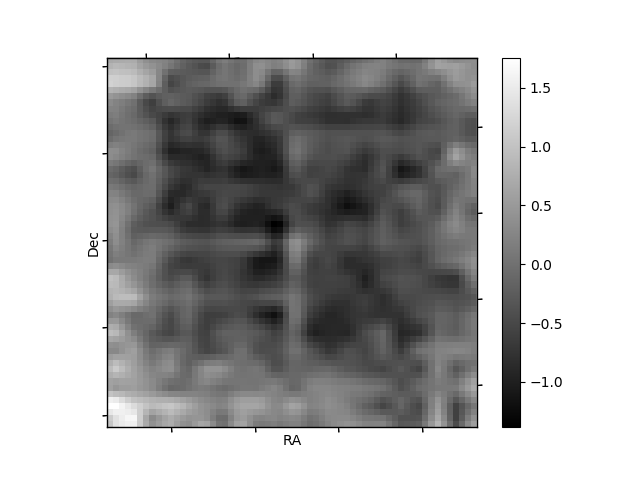
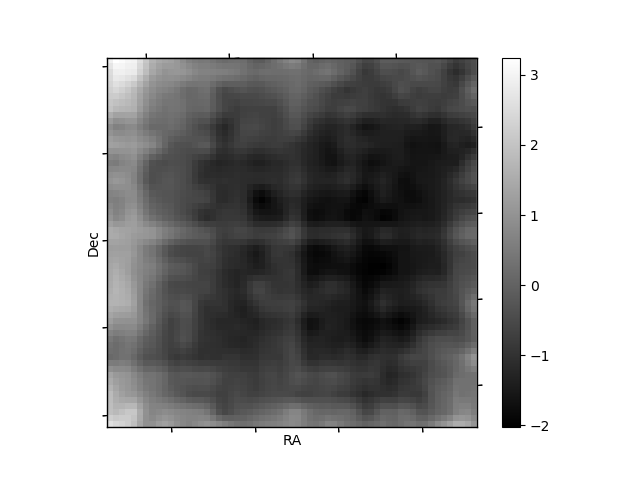
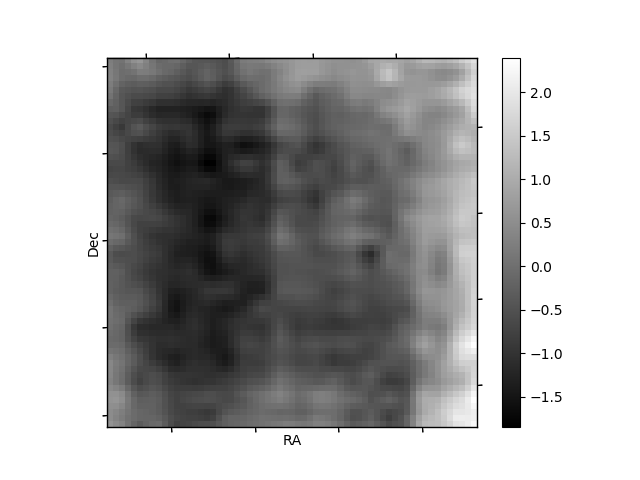
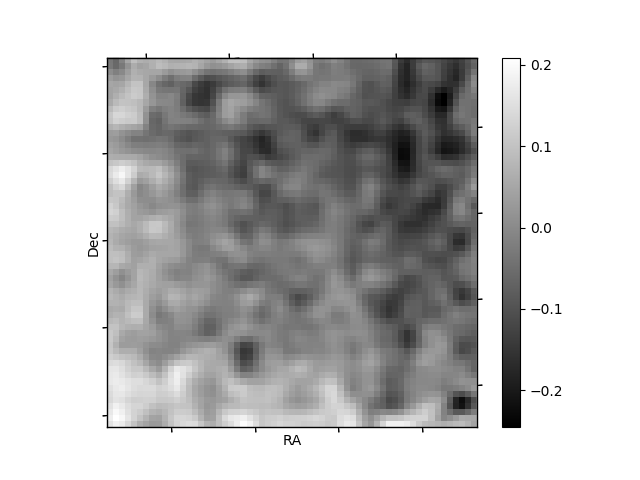
Histogram calculated using DETX and DETY for each event in the final _common_clean file
| Quadrant A | 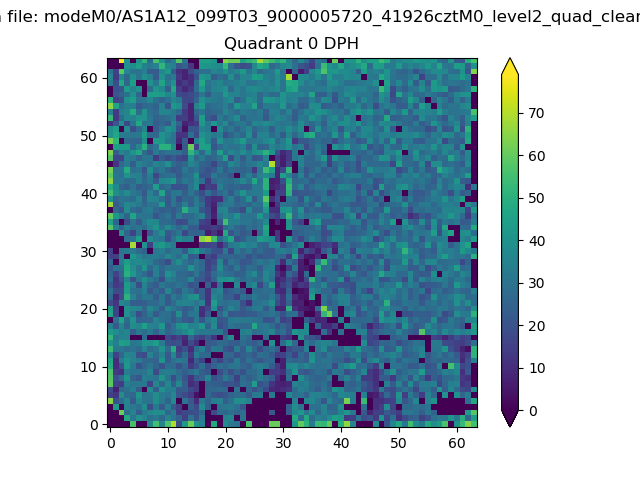 |
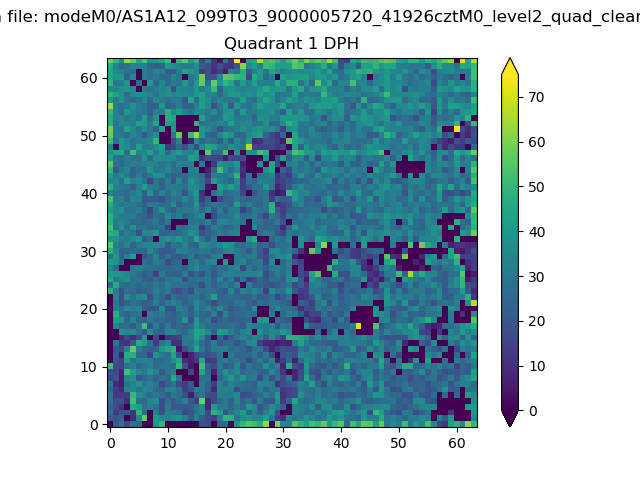 |
Quadrant B |
|---|---|---|---|
| Quadrant D | 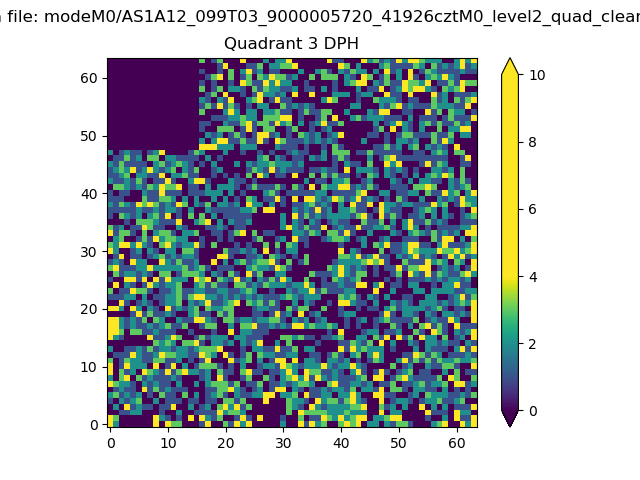 |
 |
Quadrant C |
| Plot type | Count rate plots | Images |
|---|---|---|
| Comparison with Poisson distribution Blue bars denote a histogram of data divided into 1 sec bins. Red curve is a Poisson curve with rate = median count rate of data. |
 |
 |
| Quadrant-wise count rates Data is divided into 100 sec bins |
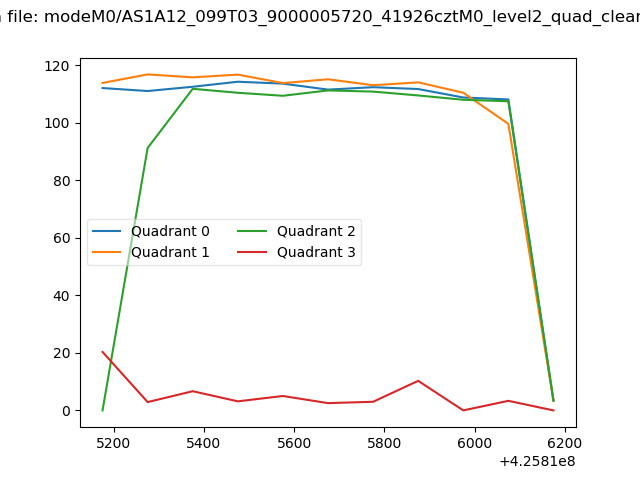 |
|
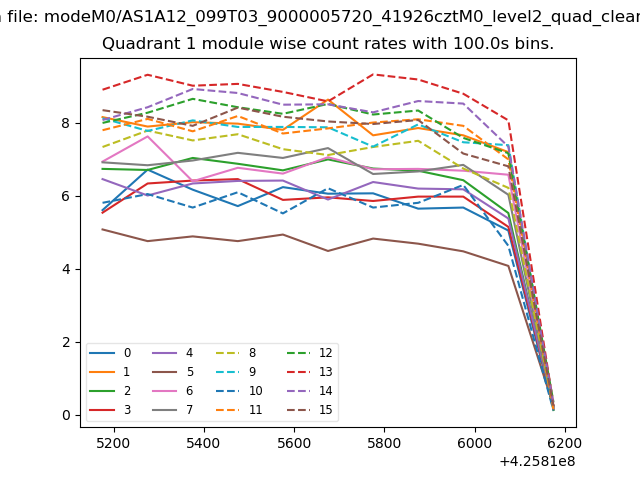
| Module-wise count rates for Quadrant A Data is divided into 100 sec bins |
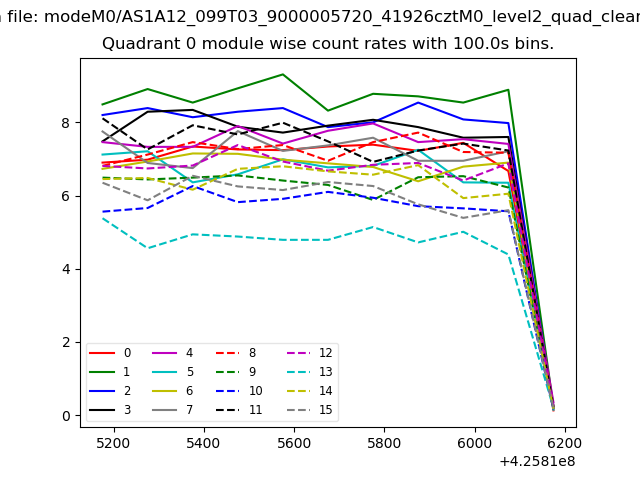 |
 |
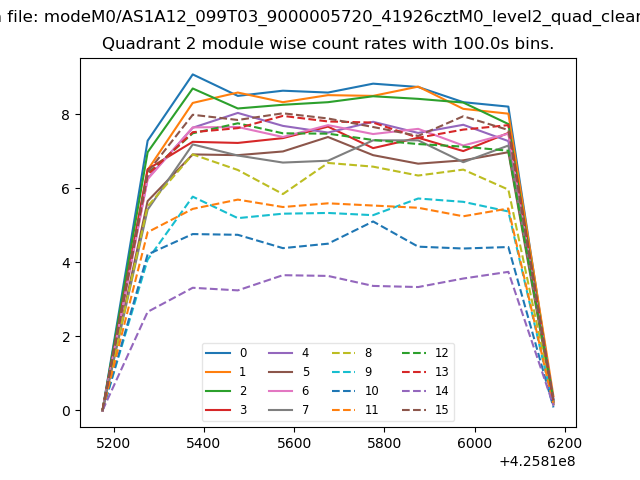
| Module-wise count rates for Quadrant B Data is divided into 100 sec bins |
 |
 |
| Module-wise count rates for Quadrant C Data is divided into 100 sec bins |
 |
 |
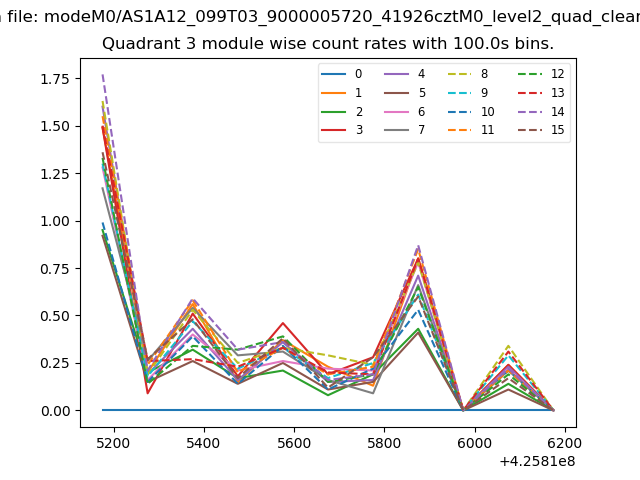
| Module-wise count rates for Quadrant D Data is divided into 100 sec bins |
 |
 |
| Parameter | Plot |
|---|---|
| CZT HV Monitor | 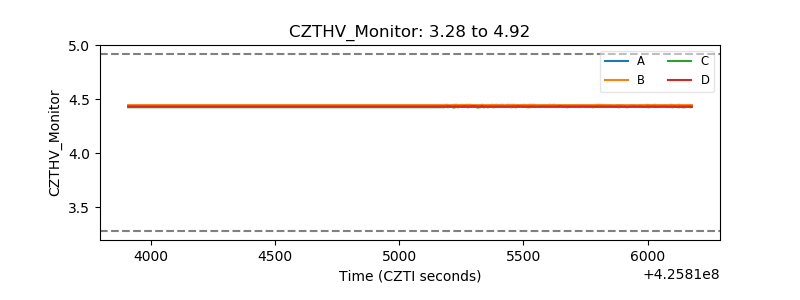 |
| D_VDD | 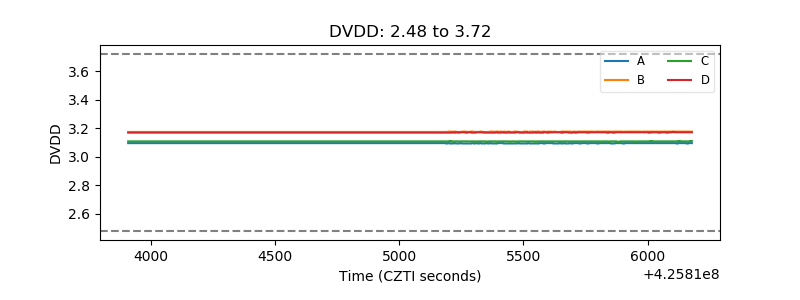 |
| Temperature 1 | 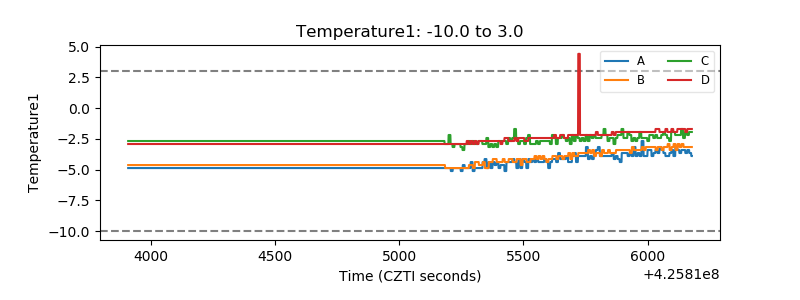 |
| Veto HV Monitor | 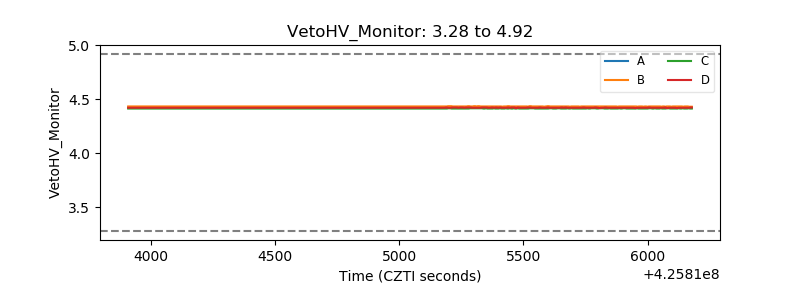 |
| Veto LLD | 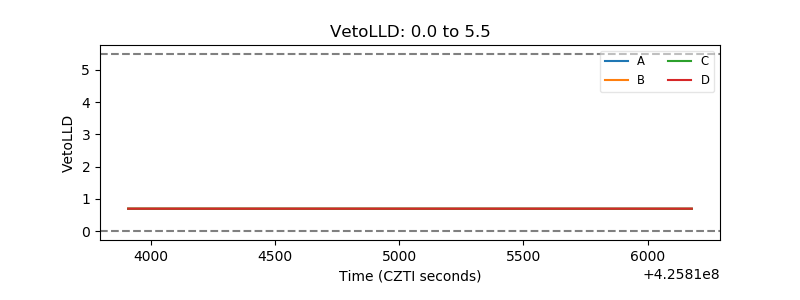 |
| Alpha Counter | 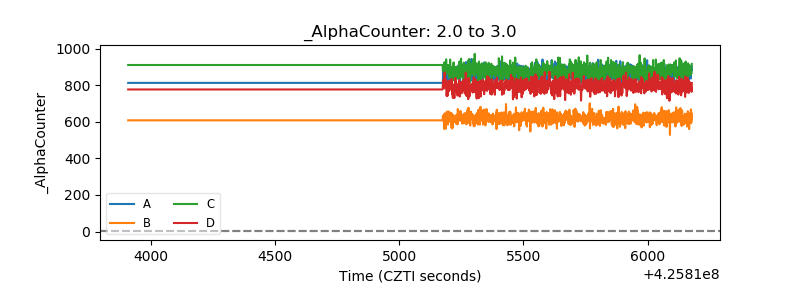 |
| _CPM_Rate | 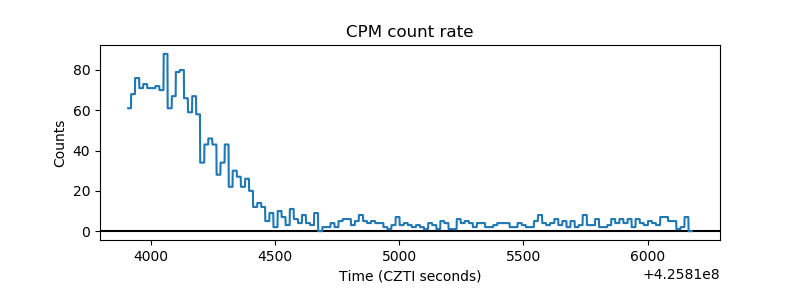 |
| CZT Counter | 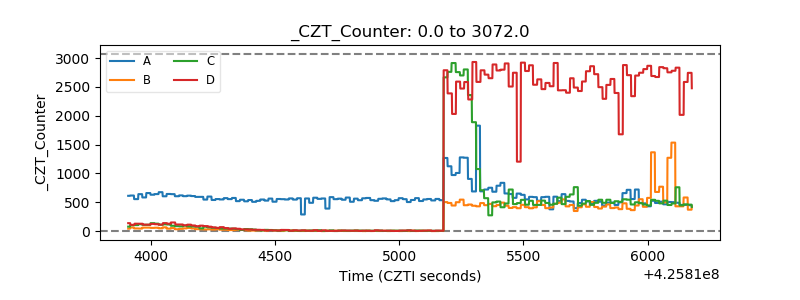 |
| +2.5 Volts monitor | 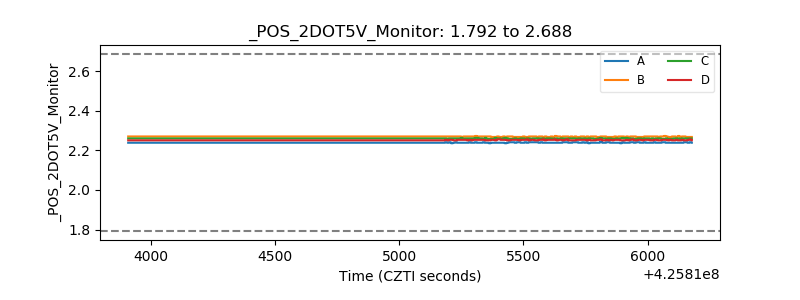 |
| +5 Volts monitor | 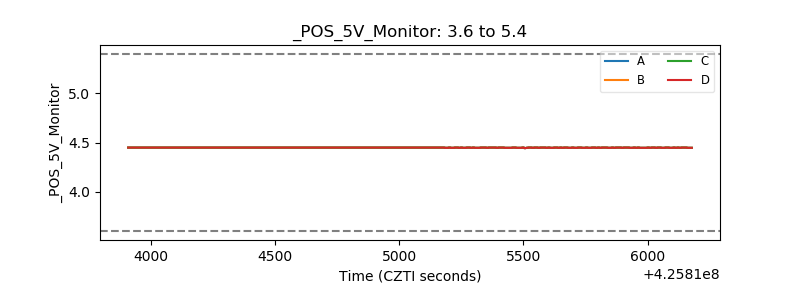 |
| _ROLL_ROT | 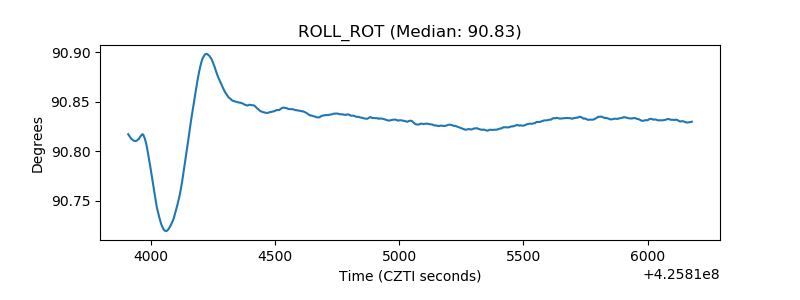 |
| _Roll_DEC | 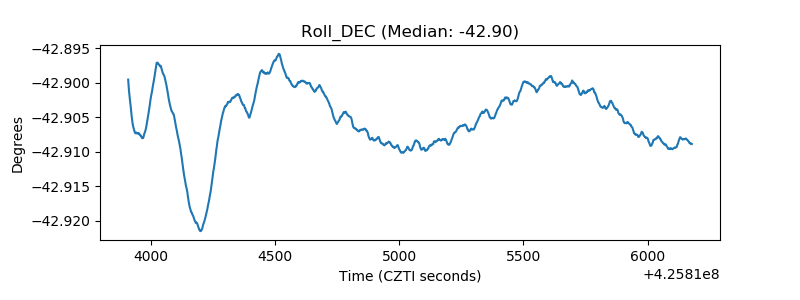 |
| _Roll_RA | 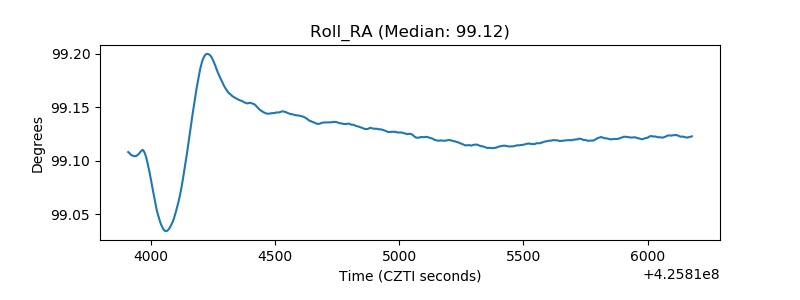 |
| Veto Counter | 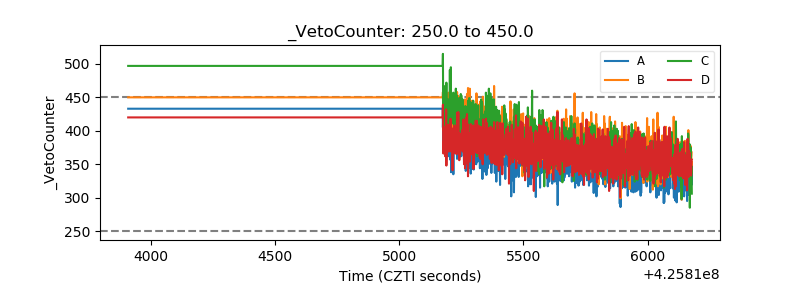 |