| Param | Original file | Final file |
|---|---|---|
| Filename | modeM0/AS1A12_099T03_9000005720_41927cztM0_level2.fits | modeM0/AS1A12_099T03_9000005720_41927cztM0_level2_quad_clean.evt |
| Size (bytes) | 681,914,880 | 71,550,720 |
| Size | 650.3 MB | 68.2 MB |
| Events in quadrant A | 3,249,060 | 602,287 |
| Events in quadrant B | 3,407,626 | 596,257 |
| Events in quadrant C | 3,452,029 | 554,917 |
| Events in quadrant D | 14,706,523 | 28,421 |
| Mode M0 | |||
|---|---|---|---|
| Quadrant | BADHDUFLAG | Total packets | Discarded packets |
| A | 0 | 13081 | 2 |
| B | 0 | 13901 | 2 |
| C | 0 | 13680 | 2 |
| D | 0 | 47068 | 2 |
| Mode SS | |||
|---|---|---|---|
| Quadrant | BADHDUFLAG | Total packets | Discarded packets |
| A | 0 | 112 | 0 |
| B | 0 | 112 | 0 |
| C | 0 | 112 | 0 |
| D | 0 | 112 | 0 |
| Mode M9 | |||
|---|---|---|---|
| Quadrant | BADHDUFLAG | Total packets | Discarded packets |
| A | 0 | 17 | 0 |
| B | 0 | 18 | 0 |
| C | 0 | 18 | 0 |
| D | 0 | 18 | 0 |
| Quadrant | Total seconds | Saturated seconds | Saturation percentage |
|---|---|---|---|
| A | 5493 | 53 | 0.964864% |
| B | 5493 | 246 | 4.478427% |
| C | 5493 | 341 | 6.207901% |
| D | 5493 | 5274 | 96.013108% |
Noise dominated data is calculated using 1-second bins in cleaned event files. If a bin has >2000 counts, and if more than 50% of those come from <1% of pixels, then it is considered to be noise-dominated and hence unusable.
| Quadrant | # 1 sec bins | Bins with >0 counts | Bins with >2000 counts | High rate bins dominated by noise | Noise dominated (total time) | Noise dominated (detector-on time) | Marked lightcurve |
|---|---|---|---|---|---|---|---|
| A | 7196 | 5494 | 33 | 33 | 0.46% | 0.60% | 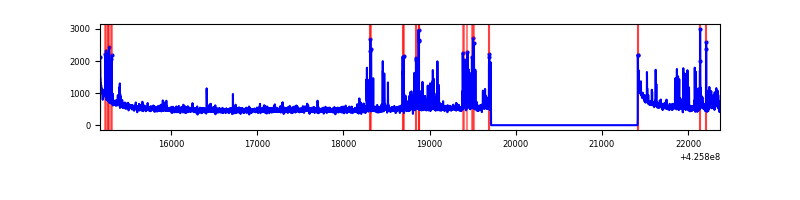 |
| B | 7196 | 5494 | 187 | 187 | 2.60% | 3.40% | 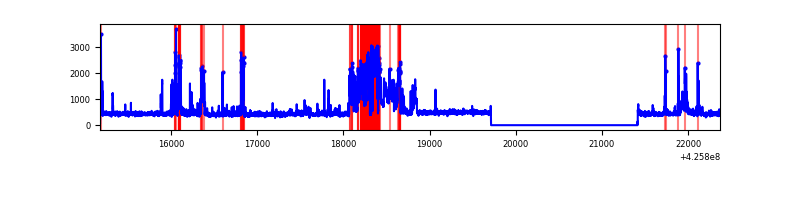 |
| C | 7196 | 5494 | 289 | 289 | 4.02% | 5.26% | 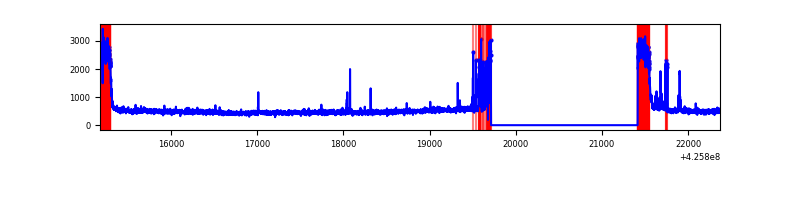 |
| D | 7196 | 5494 | 5199 | 5199 | 72.25% | 94.63% | 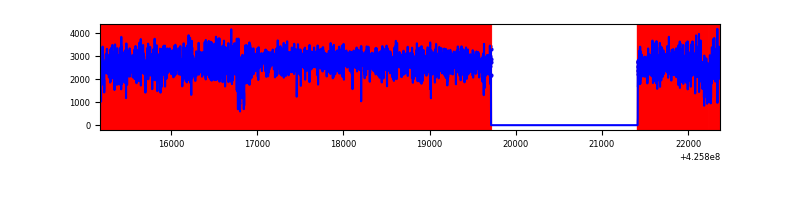 |
Top three noisy pixels from each quadrant. If the there are fewer than three noisy pixels in the level2.evt file, extra rows are filled as -1
| Pixel properties | Quadrant properties | ||||||
|---|---|---|---|---|---|---|---|
| Quadrant | DetID | PixID | Counts | Sigma | Mean | Median | Sigma |
| A | 10 | 83 | 540840 | 4411.4 | 595 | 584 | 122.5 |
| A | 14 | 24 | 356002 | 2902.13 | 595 | 584 | 122.5 |
| A | 2 | 79 | 29876 | 239.18 | 595 | 584 | 122.5 |
| B | 0 | 229 | 899574 | 8048.72 | 578 | 562 | 111.7 |
| B | 5 | 255 | 97882 | 871.29 | 578 | 562 | 111.7 |
| B | 0 | 156 | 40155 | 354.47 | 578 | 562 | 111.7 |
| C | 0 | 10 | 808431 | 6258.64 | 549 | 553 | 129.1 |
| C | 14 | 254 | 231968 | 1792.77 | 549 | 553 | 129.1 |
| C | 15 | 214 | 213730 | 1651.48 | 549 | 553 | 129.1 |
| D | 12 | 79 | 13548050 | 251093.97 | 215 | 209 | 54.0 |
| D | 13 | 249 | 135265 | 2503.11 | 215 | 209 | 54.0 |
| D | 1 | 52 | 75960 | 1403.96 | 215 | 209 | 54.0 |
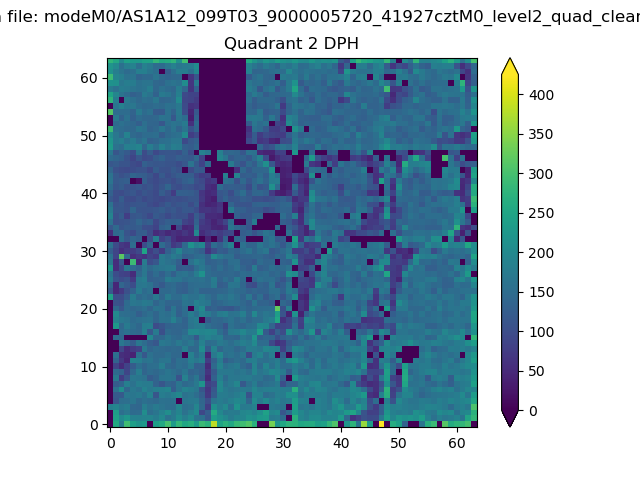
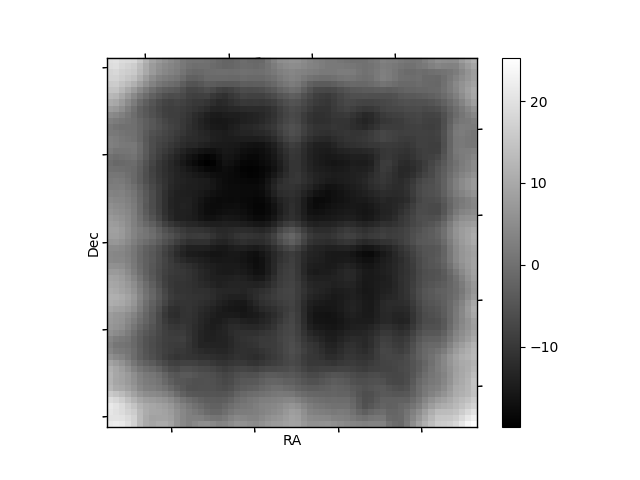
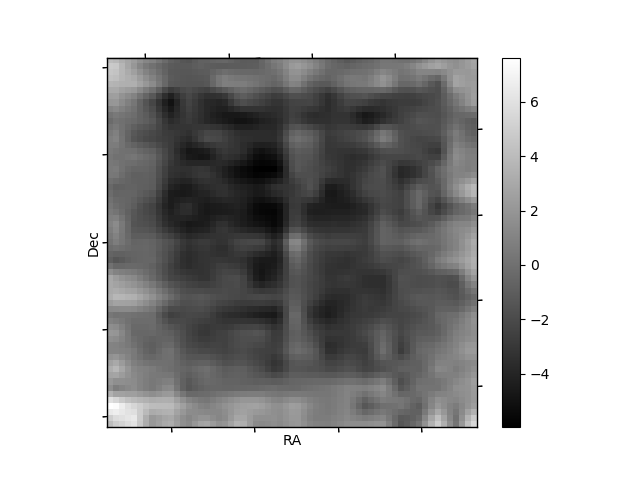
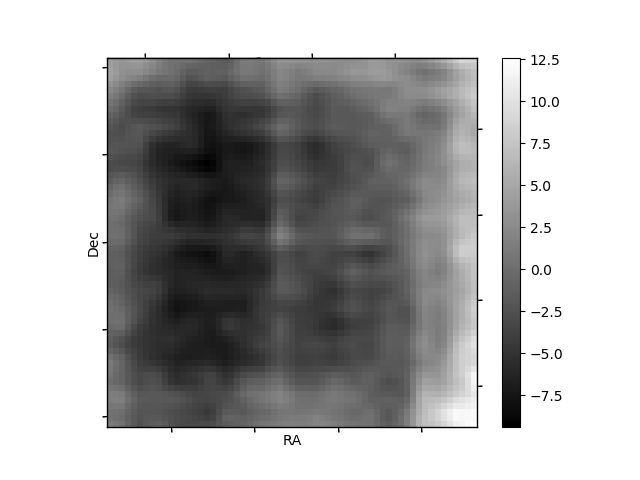
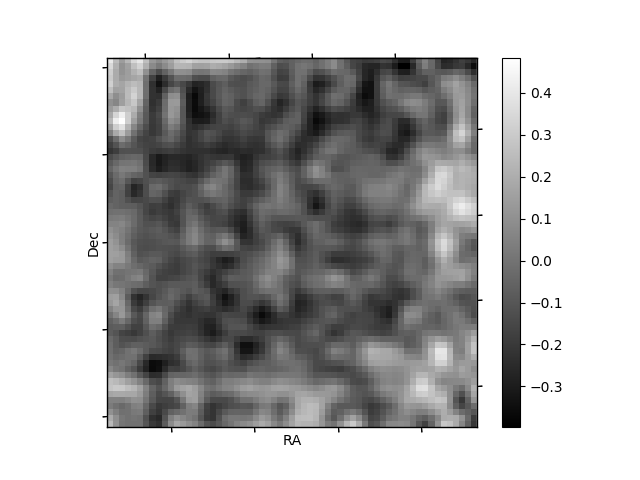
Histogram calculated using DETX and DETY for each event in the final _common_clean file
| Quadrant A | 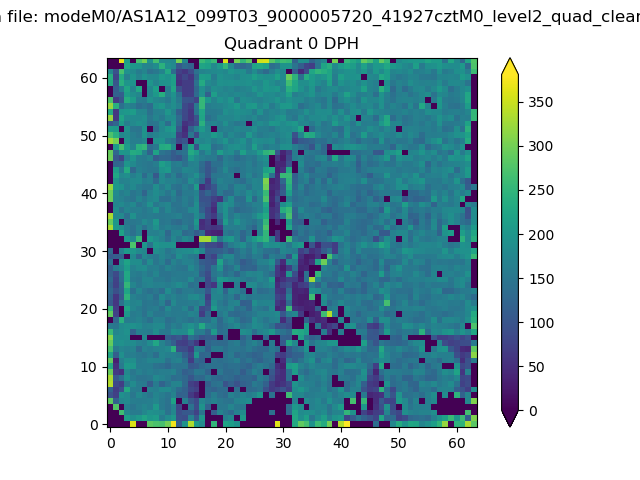 |
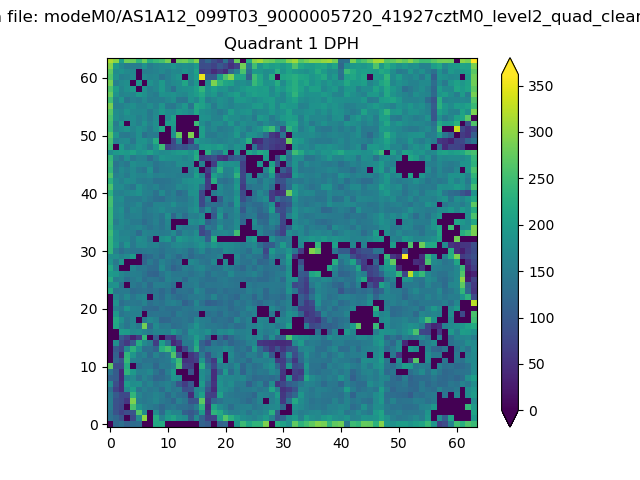 |
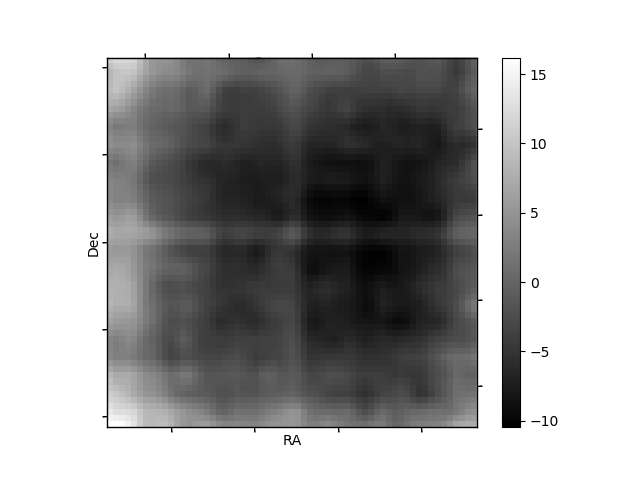
Quadrant B |
|---|---|---|---|
| Quadrant D | 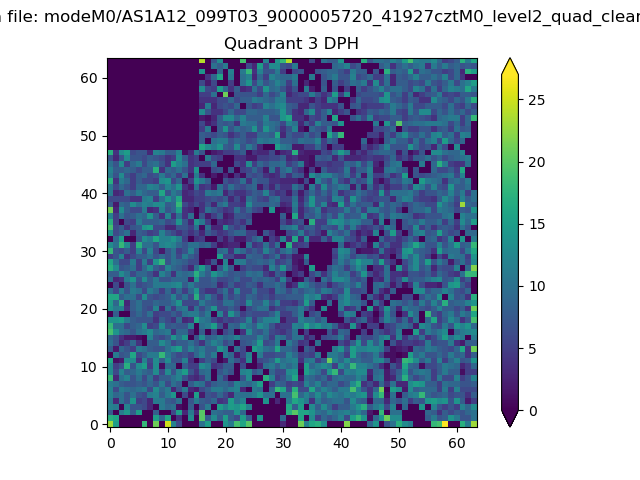 |
 |
Quadrant C |
| Plot type | Count rate plots | Images |
|---|---|---|
| Comparison with Poisson distribution Blue bars denote a histogram of data divided into 1 sec bins. Red curve is a Poisson curve with rate = median count rate of data. |
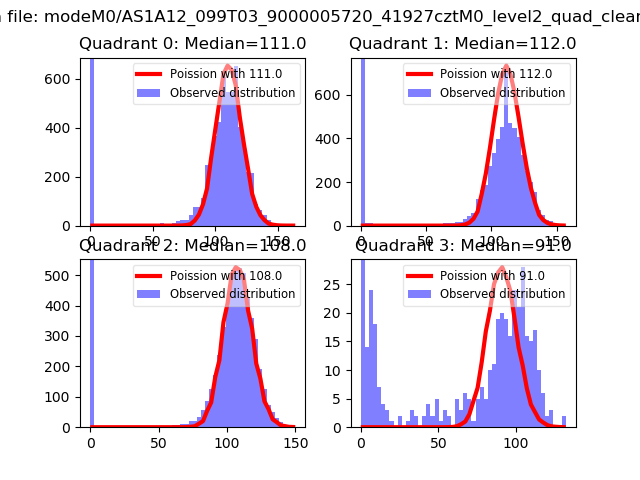 |
 |
| Quadrant-wise count rates Data is divided into 100 sec bins |
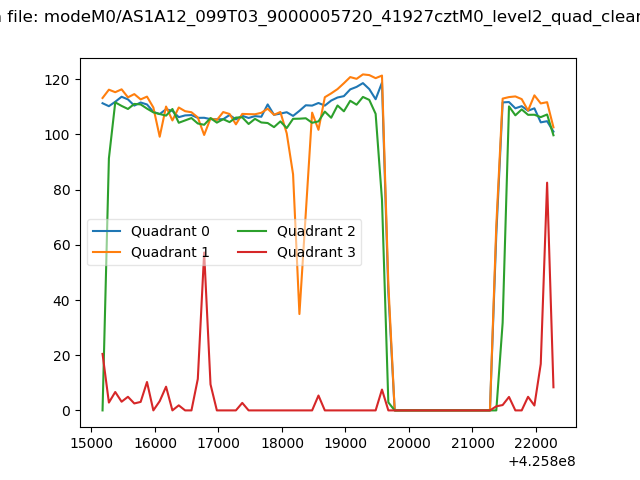 |
|
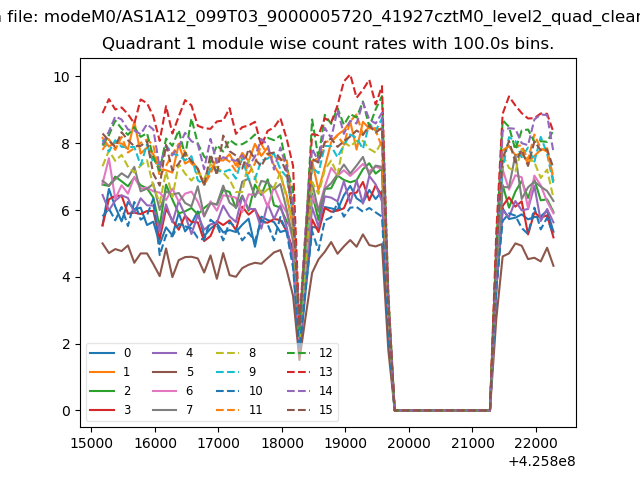
| Module-wise count rates for Quadrant A Data is divided into 100 sec bins |
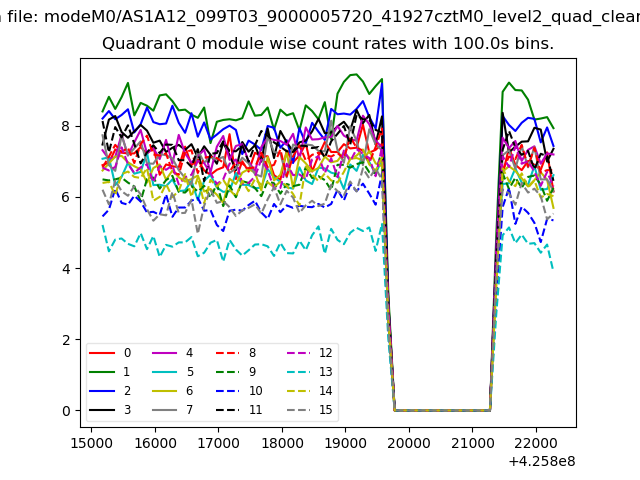 |
 |
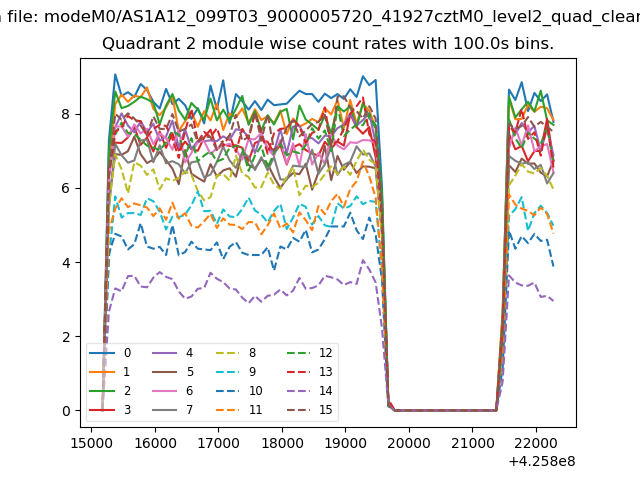
| Module-wise count rates for Quadrant B Data is divided into 100 sec bins |
 |
 |
| Module-wise count rates for Quadrant C Data is divided into 100 sec bins |
 |
 |
| Module-wise count rates for Quadrant D Data is divided into 100 sec bins |
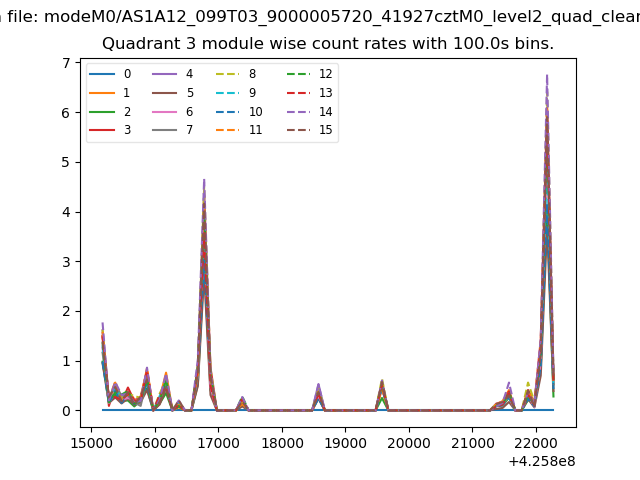 |
 |
| Parameter | Plot |
|---|---|
| CZT HV Monitor | 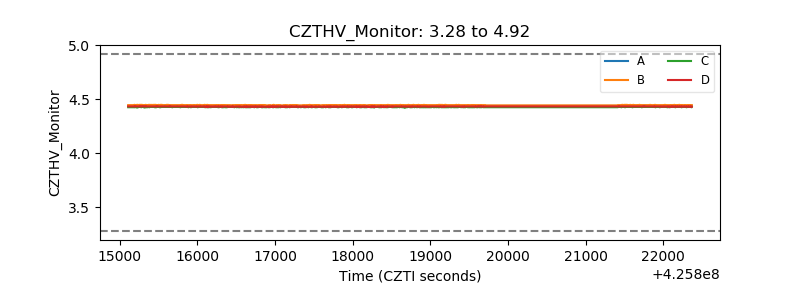 |
| D_VDD | 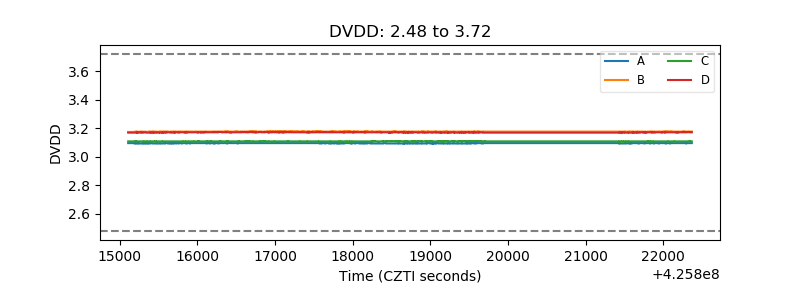 |
| Temperature 1 | 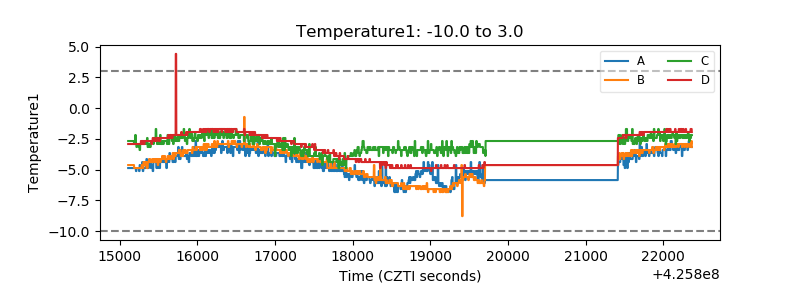 |
| Veto HV Monitor | 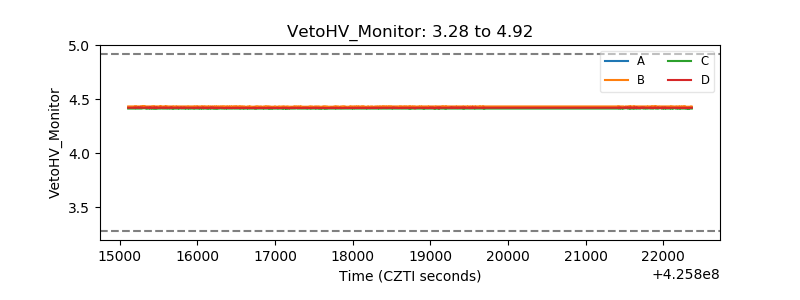 |
| Veto LLD | 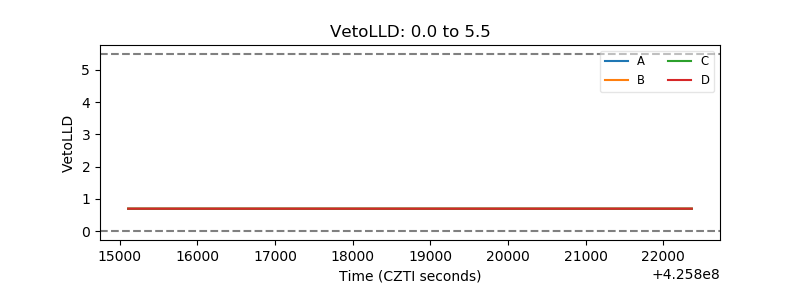 |
| Alpha Counter | 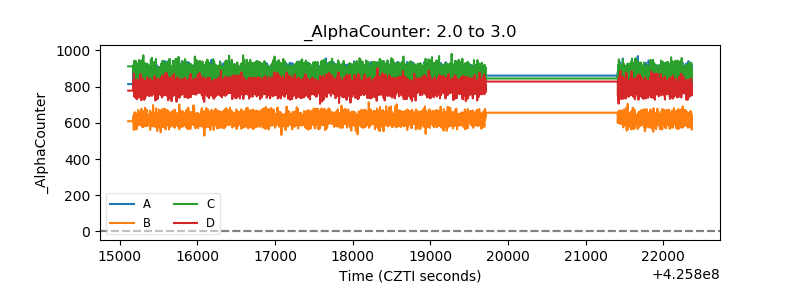 |
| _CPM_Rate | 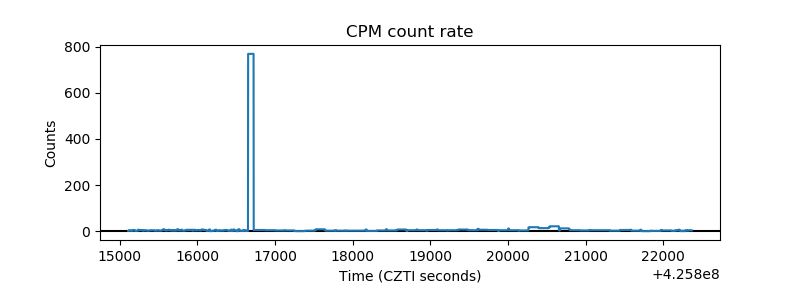 |
| CZT Counter | 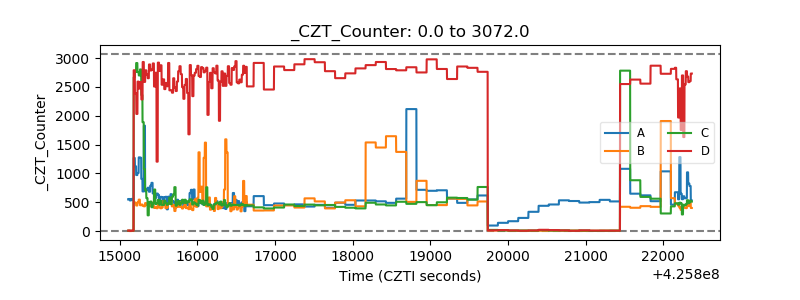 |
| +2.5 Volts monitor | 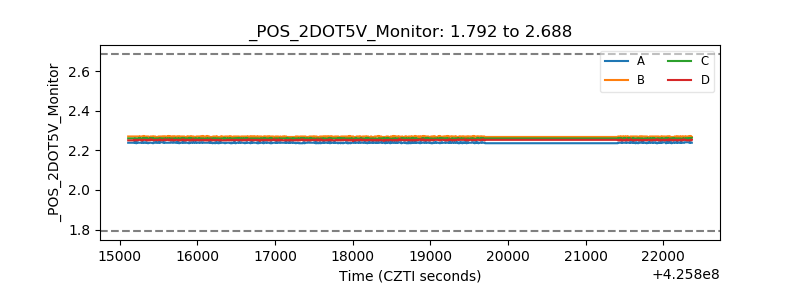 |
| +5 Volts monitor | 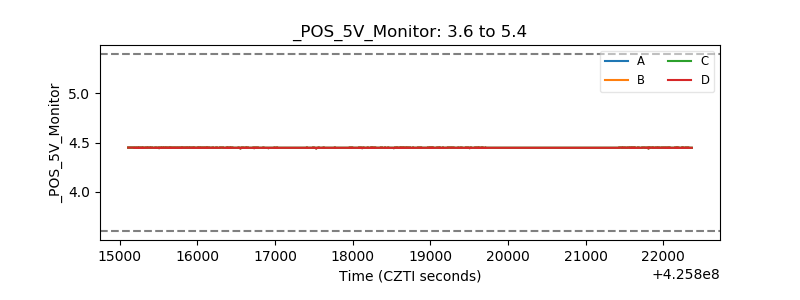 |
| _ROLL_ROT | 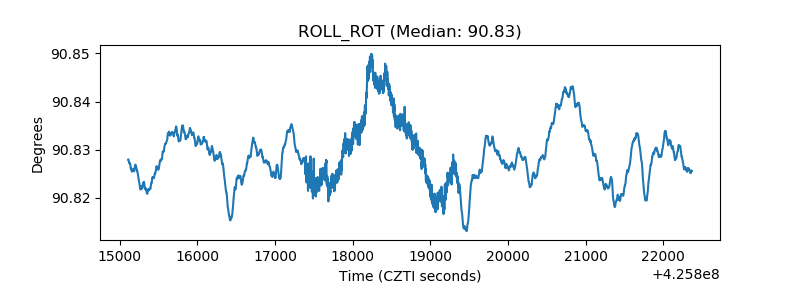 |
| _Roll_DEC | 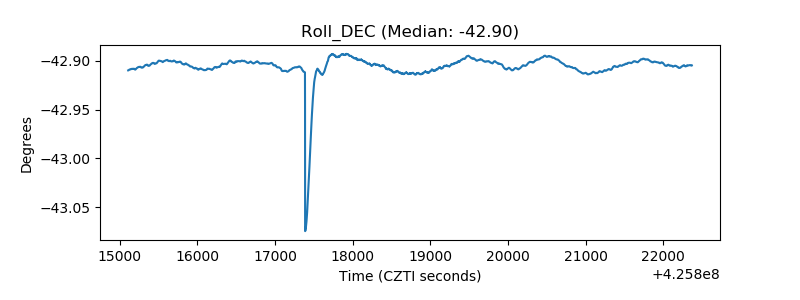 |
| _Roll_RA | 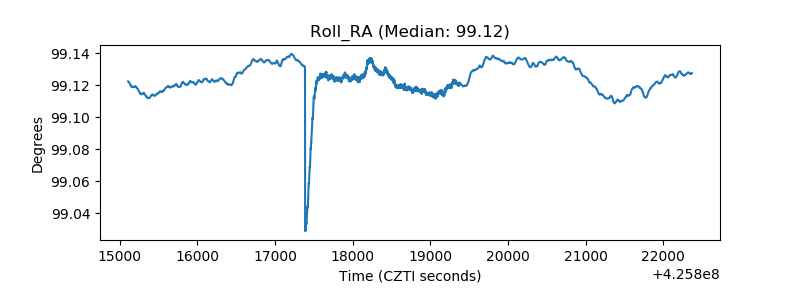 |
| Veto Counter | 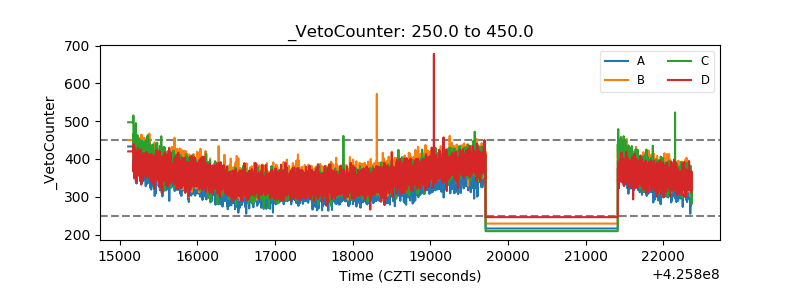 |