| Param | Original file | Final file |
|---|---|---|
| Filename | modeM0/AS1A12_099T03_9000005720_41928cztM0_level2.fits | modeM0/AS1A12_099T03_9000005720_41928cztM0_level2_quad_clean.evt |
| Size (bytes) | 705,081,600 | 73,702,080 |
| Size | 672.4 MB | 70.3 MB |
| Events in quadrant A | 4,436,639 | 577,725 |
| Events in quadrant B | 3,224,673 | 611,544 |
| Events in quadrant C | 3,545,449 | 576,807 |
| Events in quadrant D | 14,457,850 | 73,152 |
| Mode M0 | |||
|---|---|---|---|
| Quadrant | BADHDUFLAG | Total packets | Discarded packets |
| A | 0 | 16777 | 1 |
| B | 0 | 13352 | 1 |
| C | 0 | 13945 | 1 |
| D | 0 | 46547 | 5 |
| Mode SS | |||
|---|---|---|---|
| Quadrant | BADHDUFLAG | Total packets | Discarded packets |
| A | 0 | 114 | 0 |
| B | 0 | 114 | 0 |
| C | 0 | 114 | 0 |
| D | 0 | 114 | 0 |
| Mode M9 | |||
|---|---|---|---|
| Quadrant | BADHDUFLAG | Total packets | Discarded packets |
| A | 0 | 14 | 0 |
| B | 0 | 14 | 0 |
| C | 0 | 14 | 0 |
| D | 0 | 14 | 0 |
| Quadrant | Total seconds | Saturated seconds | Saturation percentage |
|---|---|---|---|
| A | 5605 | 407 | 7.261374% |
| B | 5606 | 126 | 2.247592% |
| C | 5606 | 203 | 3.621120% |
| D | 5605 | 4983 | 88.902765% |
Noise dominated data is calculated using 1-second bins in cleaned event files. If a bin has >2000 counts, and if more than 50% of those come from <1% of pixels, then it is considered to be noise-dominated and hence unusable.
| Quadrant | # 1 sec bins | Bins with >0 counts | Bins with >2000 counts | High rate bins dominated by noise | Noise dominated (total time) | Noise dominated (detector-on time) | Marked lightcurve |
|---|---|---|---|---|---|---|---|
| A | 7009 | 5607 | 295 | 295 | 4.21% | 5.26% | 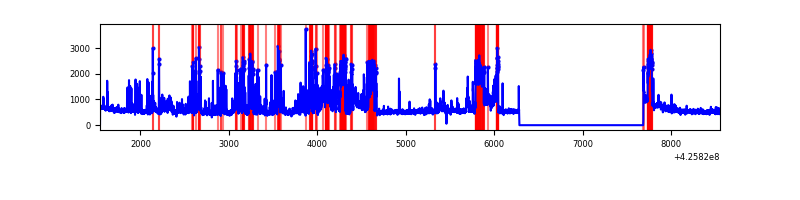 |
| B | 7010 | 5608 | 96 | 96 | 1.37% | 1.71% | 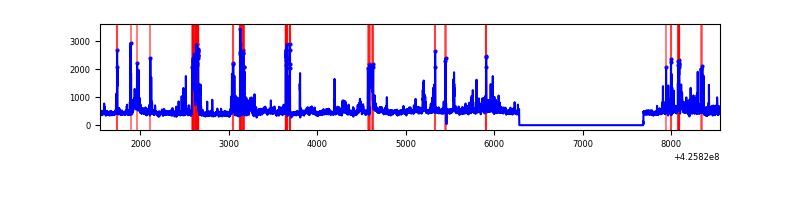 |
| C | 7010 | 5608 | 191 | 191 | 2.72% | 3.41% | 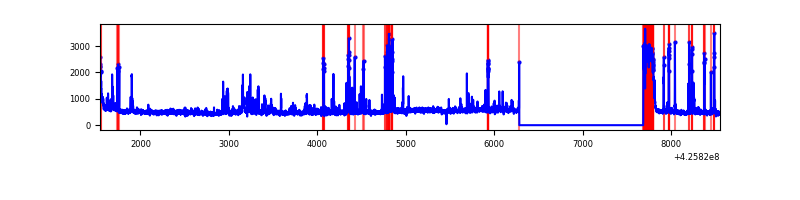 |
| D | 7009 | 5607 | 4992 | 4992 | 71.22% | 89.03% | 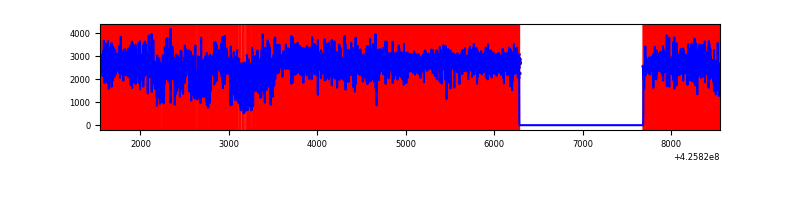 |
Top three noisy pixels from each quadrant. If the there are fewer than three noisy pixels in the level2.evt file, extra rows are filled as -1
| Pixel properties | Quadrant properties | ||||||
|---|---|---|---|---|---|---|---|
| Quadrant | DetID | PixID | Counts | Sigma | Mean | Median | Sigma |
| A | 14 | 24 | 1584734 | 12940.26 | 593 | 582 | 122.4 |
| A | 10 | 83 | 487816 | 3980.0 | 593 | 582 | 122.4 |
| A | 2 | 79 | 29516 | 236.35 | 593 | 582 | 122.4 |
| B | 0 | 229 | 612094 | 5248.59 | 595 | 578 | 116.5 |
| B | 0 | 156 | 83162 | 708.81 | 595 | 578 | 116.5 |
| B | 5 | 255 | 62830 | 534.3 | 595 | 578 | 116.5 |
| C | 0 | 10 | 513576 | 3807.39 | 575 | 578 | 134.7 |
| C | 14 | 254 | 303217 | 2246.14 | 575 | 578 | 134.7 |
| C | 4 | 254 | 233603 | 1729.47 | 575 | 578 | 134.7 |
| D | 12 | 79 | 13294817 | 212350.15 | 251 | 244 | 62.6 |
| D | 13 | 249 | 87679 | 1396.57 | 251 | 244 | 62.6 |
| D | 1 | 52 | 37938 | 602.07 | 251 | 244 | 62.6 |
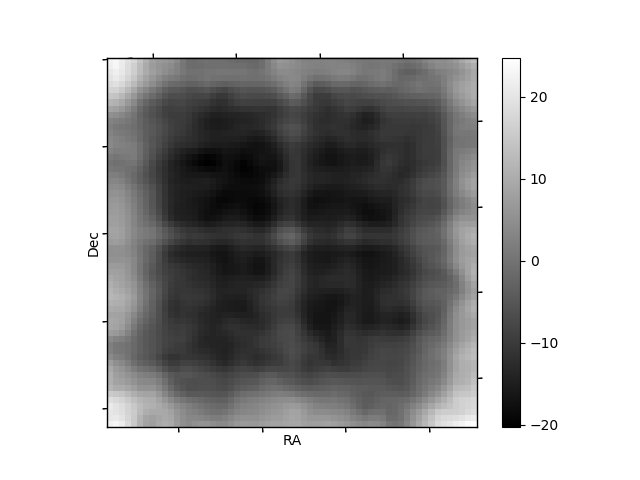
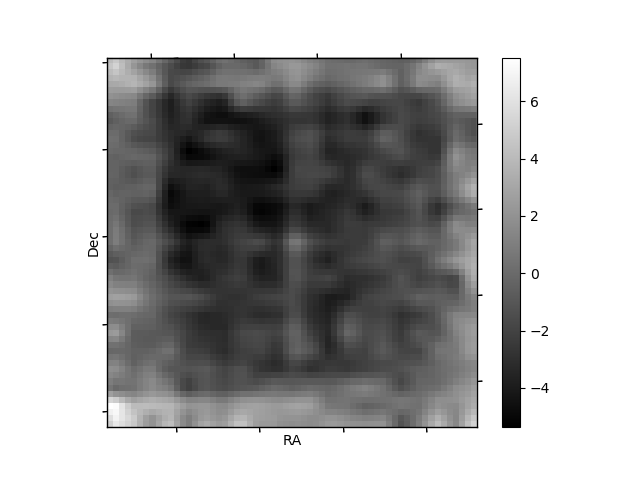
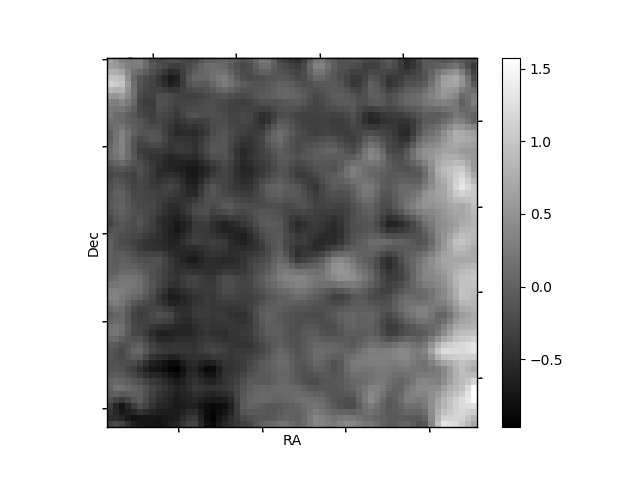
Histogram calculated using DETX and DETY for each event in the final _common_clean file
| Quadrant A | 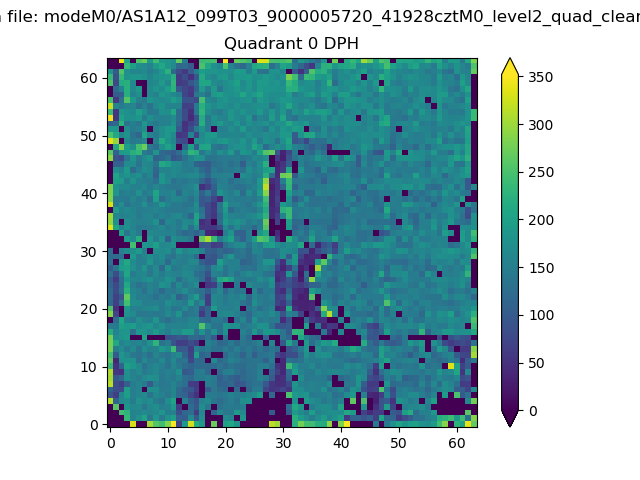 |
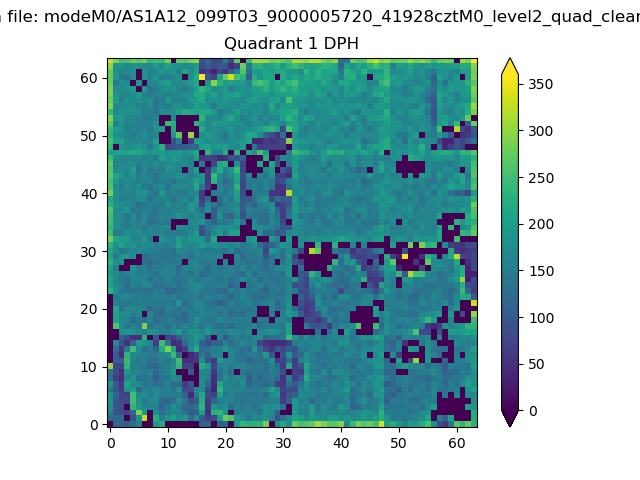 |
Quadrant B |
|---|---|---|---|
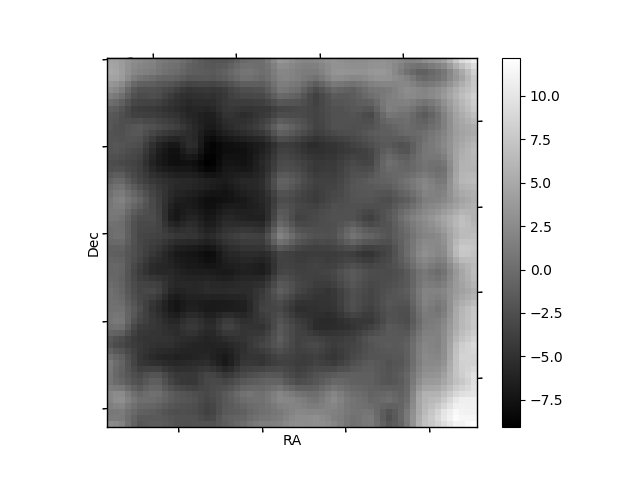
| Quadrant D | 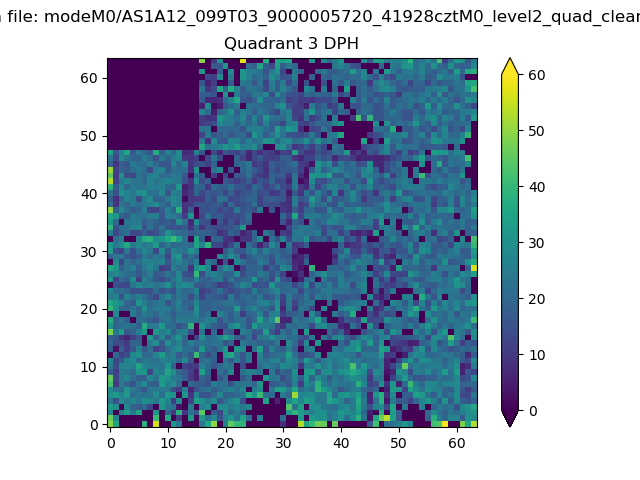 |
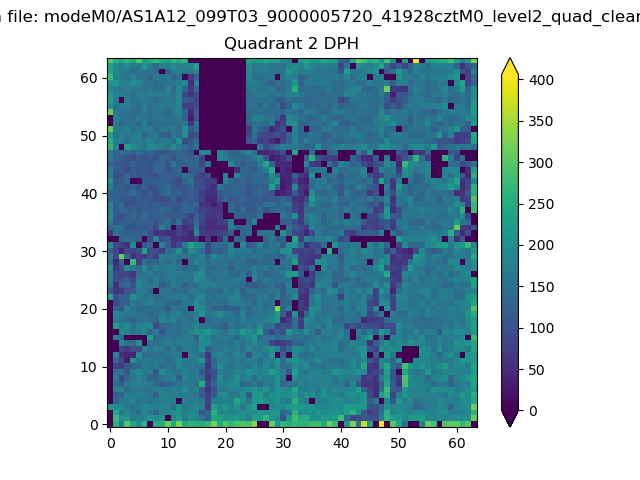 |
Quadrant C |
| Plot type | Count rate plots | Images |
|---|---|---|
| Comparison with Poisson distribution Blue bars denote a histogram of data divided into 1 sec bins. Red curve is a Poisson curve with rate = median count rate of data. |
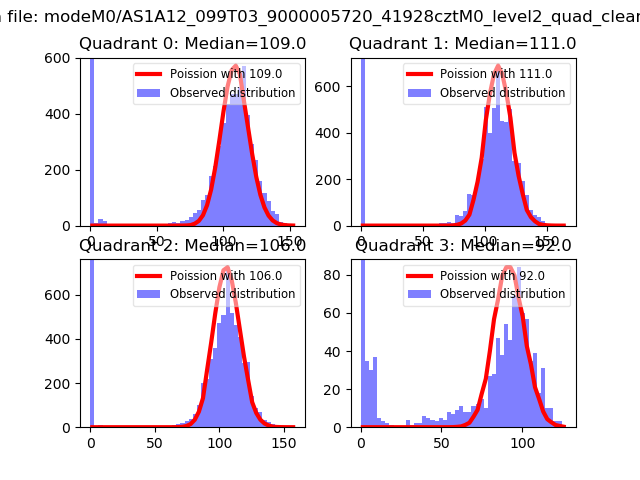 |
 |
| Quadrant-wise count rates Data is divided into 100 sec bins |
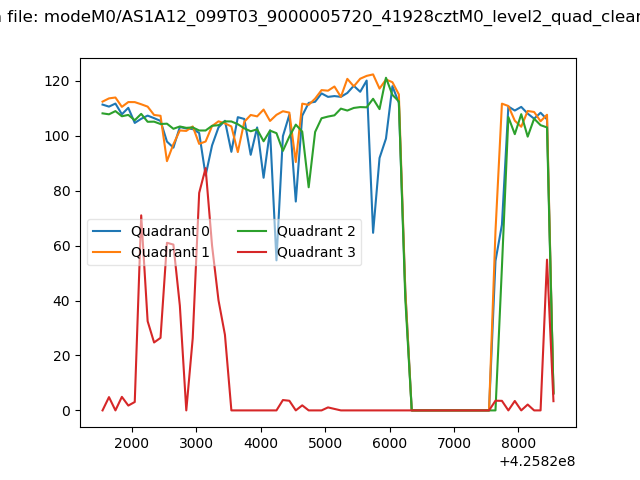 |
|
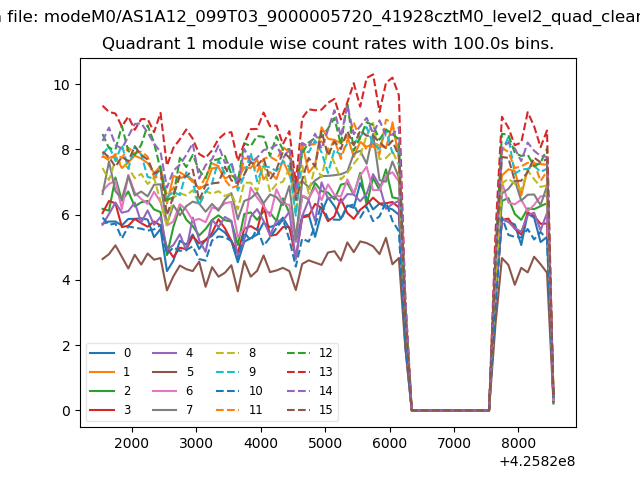
| Module-wise count rates for Quadrant A Data is divided into 100 sec bins |
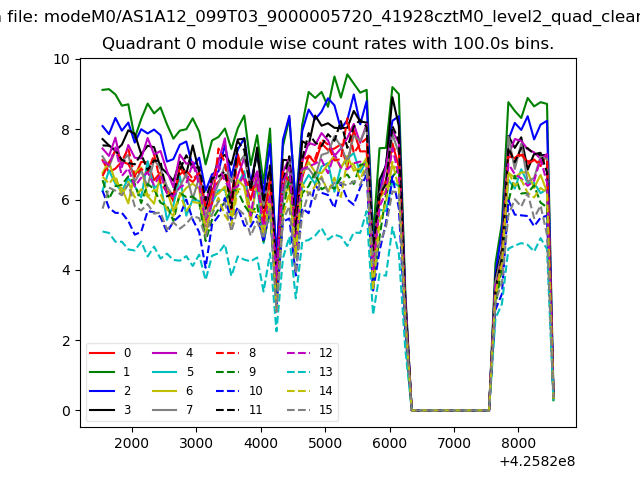 |
 |
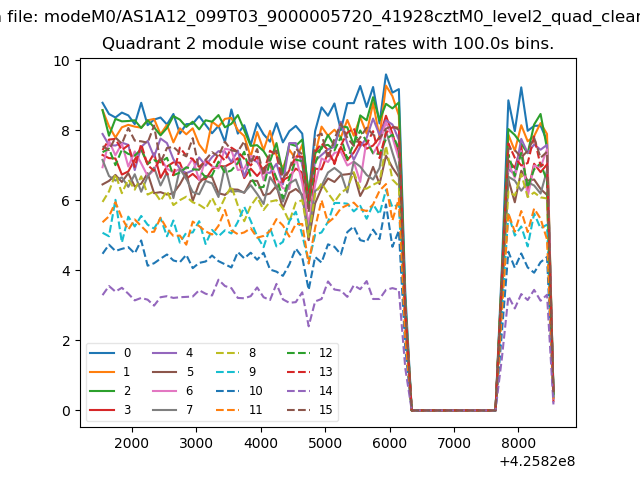
| Module-wise count rates for Quadrant B Data is divided into 100 sec bins |
 |
 |
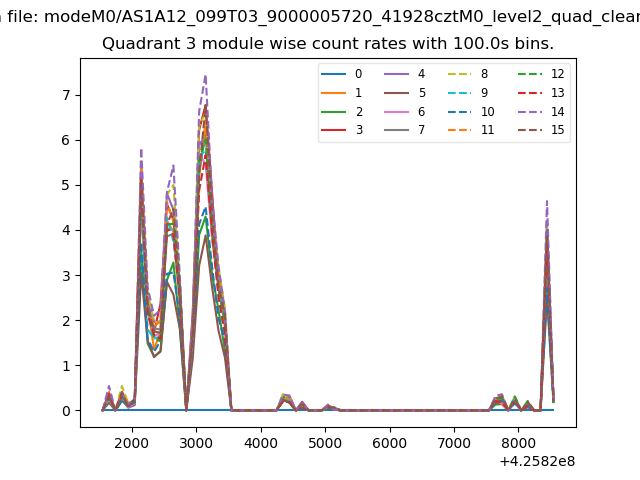
| Module-wise count rates for Quadrant C Data is divided into 100 sec bins |
 |
 |
| Module-wise count rates for Quadrant D Data is divided into 100 sec bins |
 |
 |
| Parameter | Plot |
|---|---|
| CZT HV Monitor | 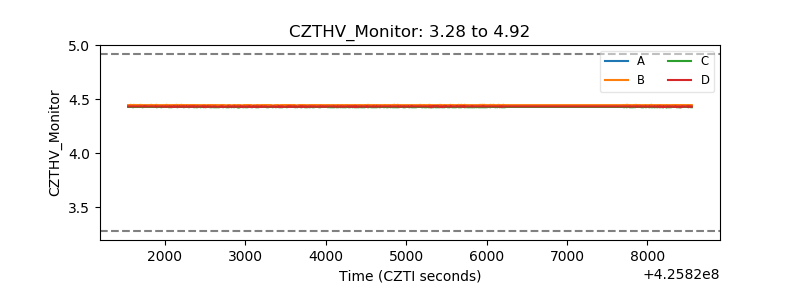 |
| D_VDD | 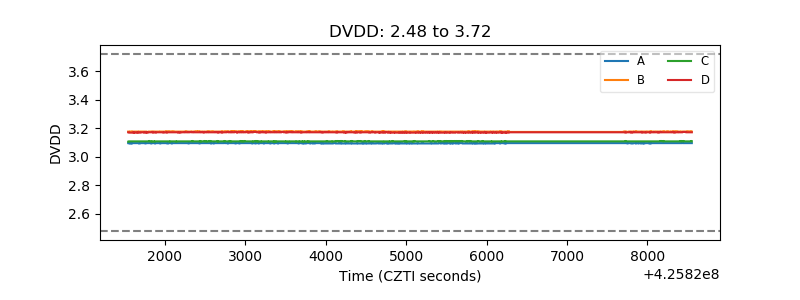 |
| Temperature 1 | 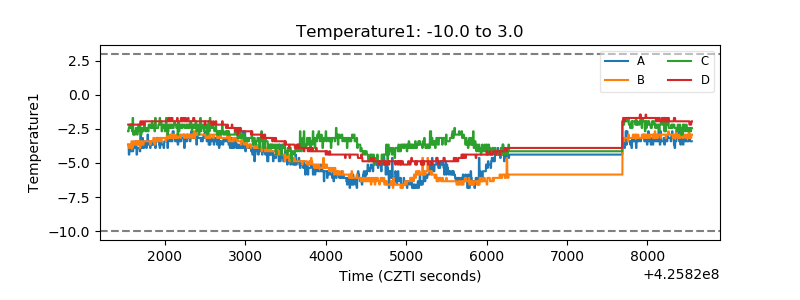 |
| Veto HV Monitor | 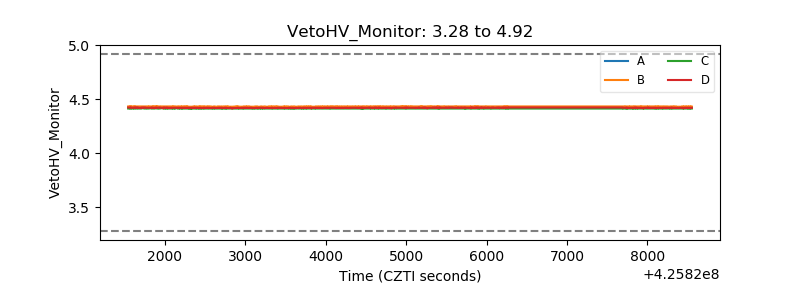 |
| Veto LLD | 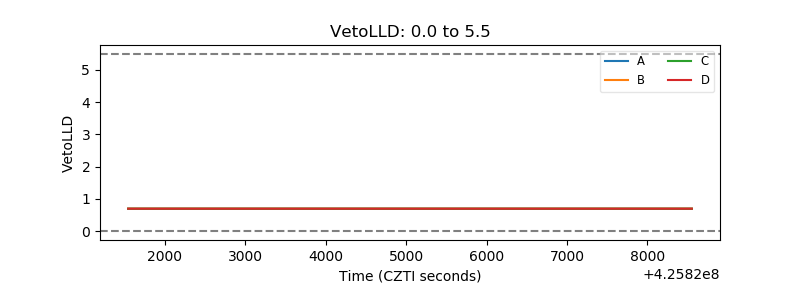 |
| Alpha Counter | 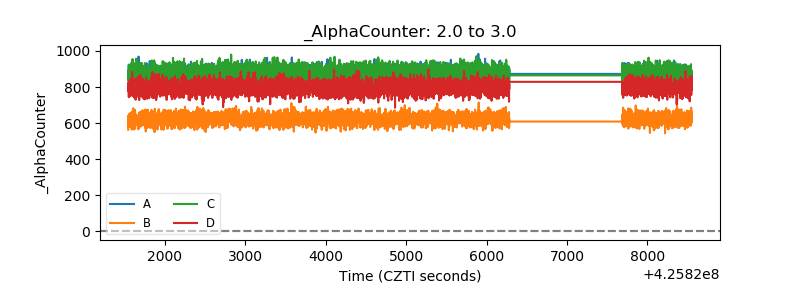 |
| _CPM_Rate | 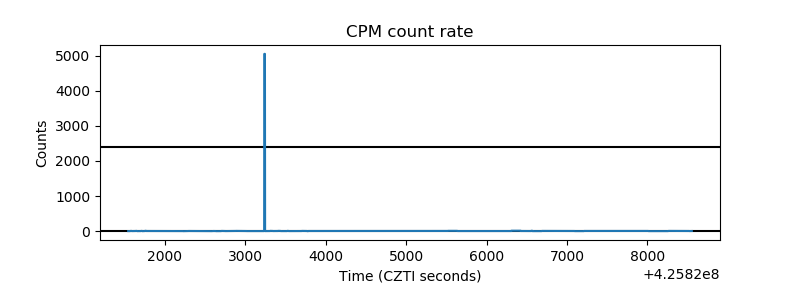 |
| CZT Counter | 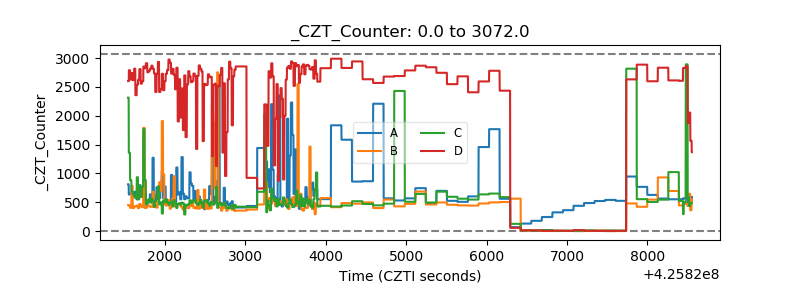 |
| +2.5 Volts monitor | 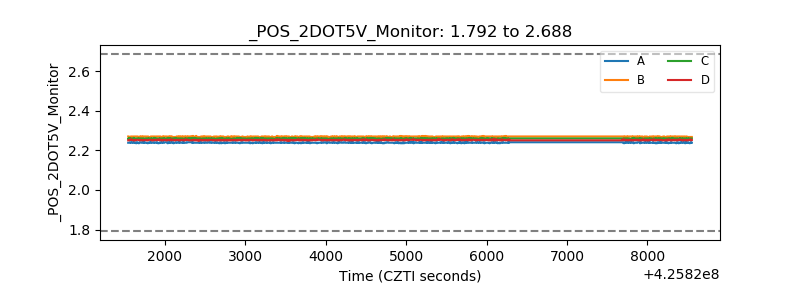 |
| +5 Volts monitor | 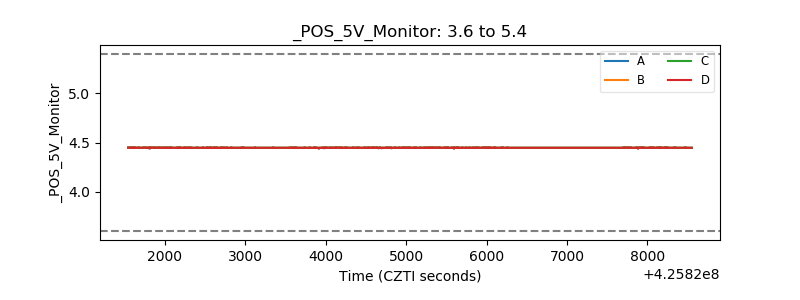 |
| _ROLL_ROT | 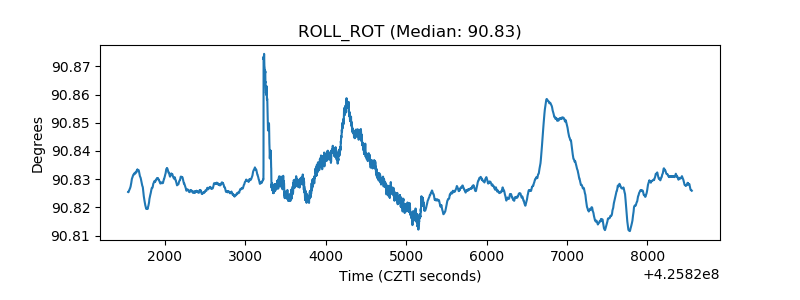 |
| _Roll_DEC | 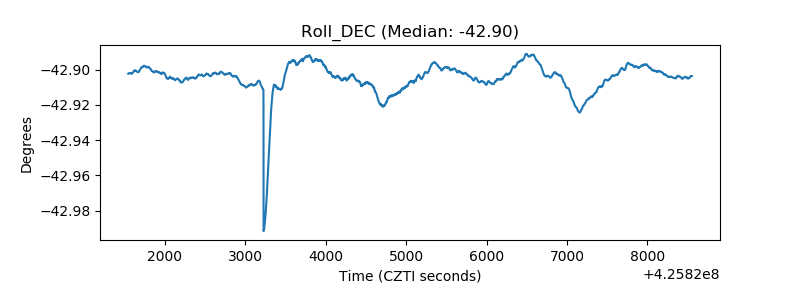 |
| _Roll_RA | 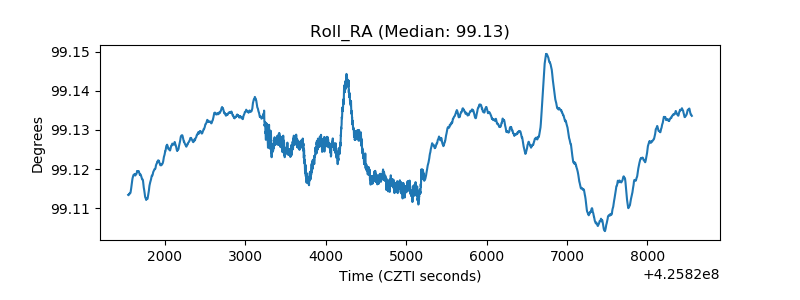 |
| Veto Counter | 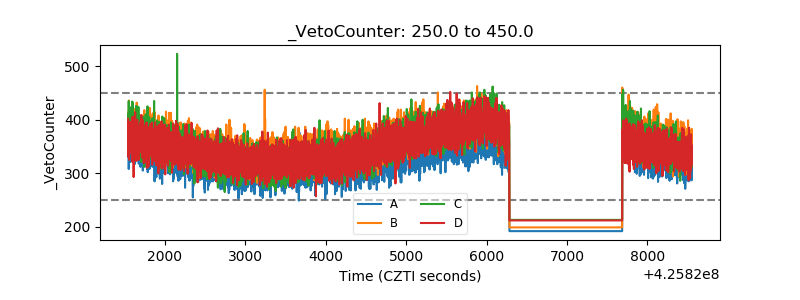 |