| Param | Original file | Final file |
|---|---|---|
| Filename | modeM0/AS1A12_099T03_9000005720_41929cztM0_level2.fits | modeM0/AS1A12_099T03_9000005720_41929cztM0_level2_quad_clean.evt |
| Size (bytes) | 706,582,080 | 76,311,360 |
| Size | 673.8 MB | 72.8 MB |
| Events in quadrant A | 5,015,951 | 563,132 |
| Events in quadrant B | 3,020,125 | 625,893 |
| Events in quadrant C | 3,873,949 | 578,749 |
| Events in quadrant D | 13,799,107 | 140,638 |
| Mode M0 | |||
|---|---|---|---|
| Quadrant | BADHDUFLAG | Total packets | Discarded packets |
| A | 0 | 18602 | 1 |
| B | 0 | 12800 | 1 |
| C | 0 | 15051 | 1 |
| D | 0 | 44766 | 1 |
| Mode SS | |||
|---|---|---|---|
| Quadrant | BADHDUFLAG | Total packets | Discarded packets |
| A | 0 | 116 | 0 |
| B | 0 | 116 | 0 |
| C | 0 | 116 | 0 |
| D | 0 | 116 | 0 |
| Mode M9 | |||
|---|---|---|---|
| Quadrant | BADHDUFLAG | Total packets | Discarded packets |
| A | 0 | 13 | 0 |
| B | 0 | 13 | 0 |
| C | 0 | 13 | 0 |
| D | 0 | 13 | 0 |
| Quadrant | Total seconds | Saturated seconds | Saturation percentage |
|---|---|---|---|
| A | 5751 | 625 | 10.867675% |
| B | 5752 | 45 | 0.782337% |
| C | 5752 | 295 | 5.128651% |
| D | 5752 | 4572 | 79.485396% |
Noise dominated data is calculated using 1-second bins in cleaned event files. If a bin has >2000 counts, and if more than 50% of those come from <1% of pixels, then it is considered to be noise-dominated and hence unusable.
| Quadrant | # 1 sec bins | Bins with >0 counts | Bins with >2000 counts | High rate bins dominated by noise | Noise dominated (total time) | Noise dominated (detector-on time) | Marked lightcurve |
|---|---|---|---|---|---|---|---|
| A | 7064 | 5752 | 568 | 568 | 8.04% | 9.87% | 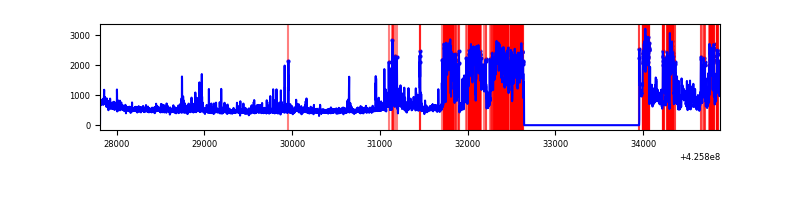 |
| B | 7065 | 5753 | 37 | 37 | 0.52% | 0.64% | 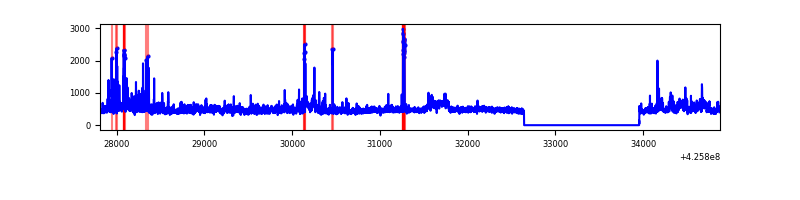 |
| C | 7065 | 5753 | 290 | 290 | 4.10% | 5.04% | 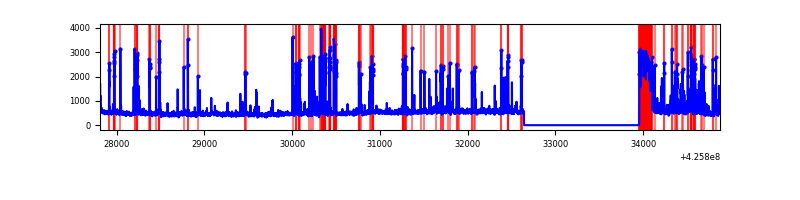 |
| D | 7065 | 5753 | 4550 | 4550 | 64.40% | 79.09% | 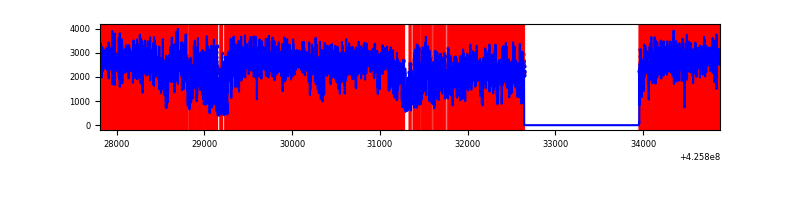 |
Top three noisy pixels from each quadrant. If the there are fewer than three noisy pixels in the level2.evt file, extra rows are filled as -1
| Pixel properties | Quadrant properties | ||||||
|---|---|---|---|---|---|---|---|
| Quadrant | DetID | PixID | Counts | Sigma | Mean | Median | Sigma |
| A | 14 | 24 | 2123919 | 17257.84 | 600 | 588 | 123.0 |
| A | 10 | 83 | 492725 | 3999.95 | 600 | 588 | 123.0 |
| A | 2 | 79 | 56776 | 456.68 | 600 | 588 | 123.0 |
| B | 0 | 229 | 228567 | 1902.84 | 613 | 596 | 119.8 |
| B | 0 | 156 | 209960 | 1747.53 | 613 | 596 | 119.8 |
| B | 5 | 255 | 65078 | 538.22 | 613 | 596 | 119.8 |
| C | 4 | 254 | 857045 | 6212.86 | 587 | 590 | 137.9 |
| C | 0 | 10 | 453556 | 3285.89 | 587 | 590 | 137.9 |
| C | 15 | 214 | 226930 | 1641.91 | 587 | 590 | 137.9 |
| D | 12 | 79 | 12266388 | 139946.51 | 355 | 345 | 87.6 |
| D | 13 | 249 | 78700 | 893.97 | 355 | 345 | 87.6 |
| D | 5 | 222 | 51075 | 578.79 | 355 | 345 | 87.6 |
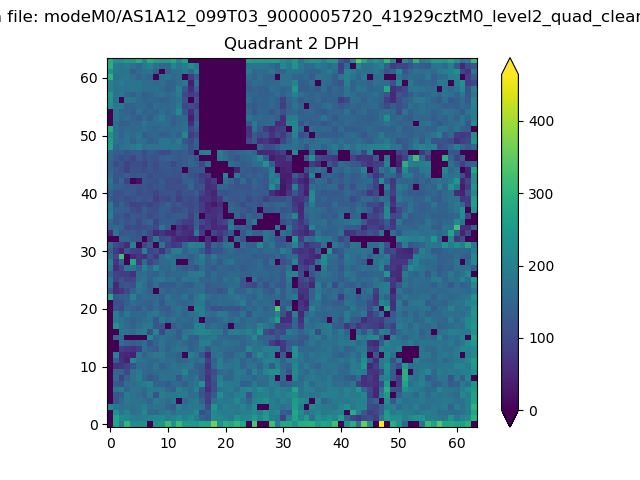
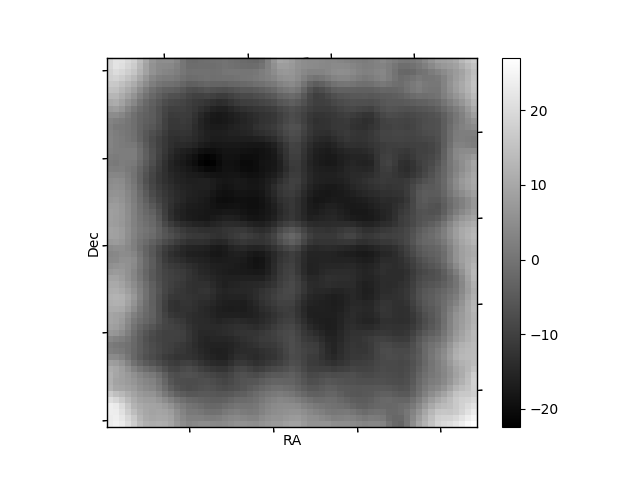
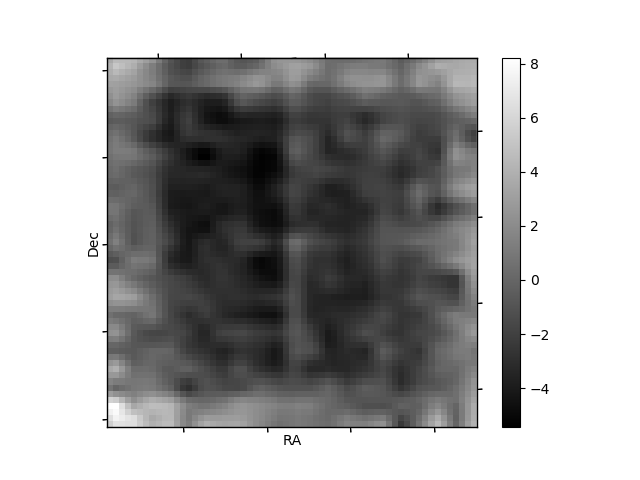
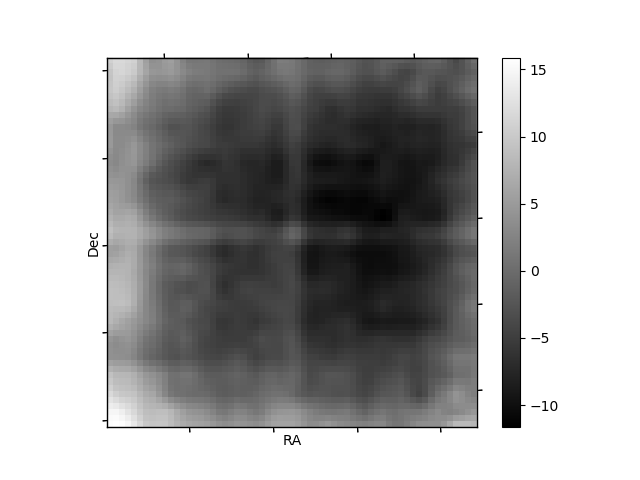
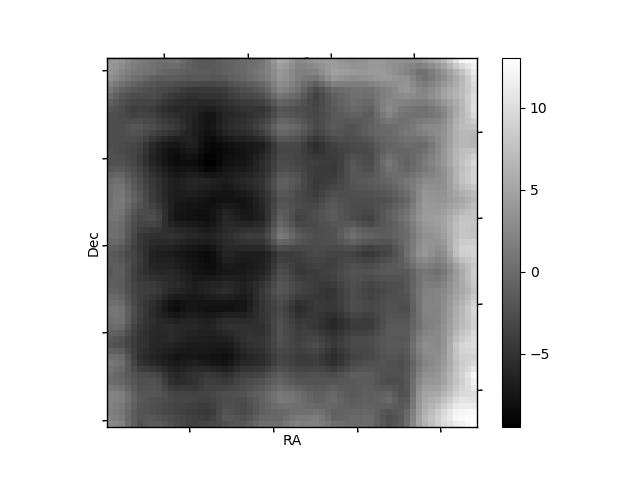
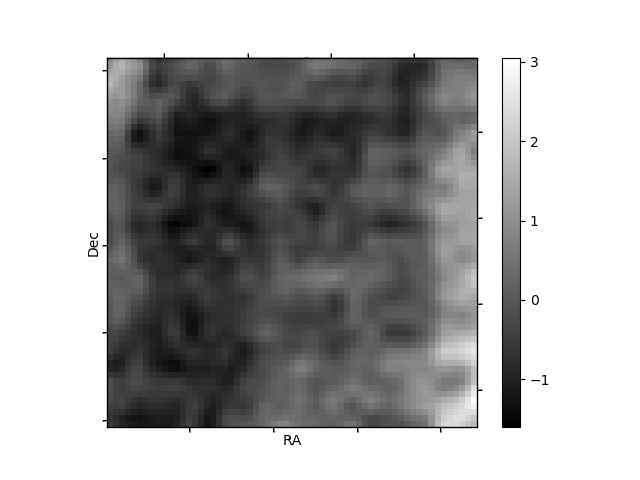
Histogram calculated using DETX and DETY for each event in the final _common_clean file
| Quadrant A | 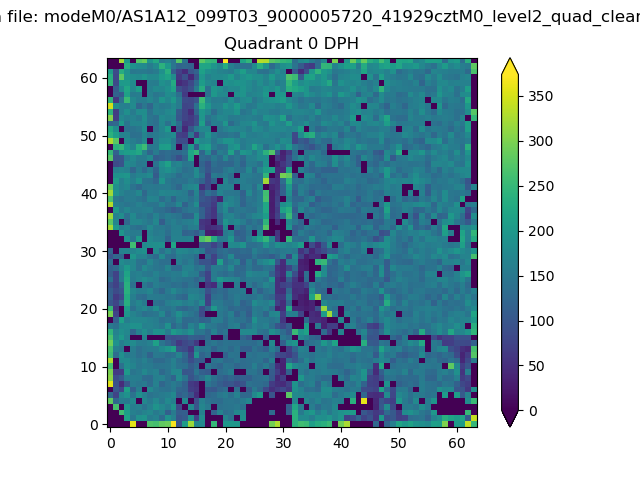 |
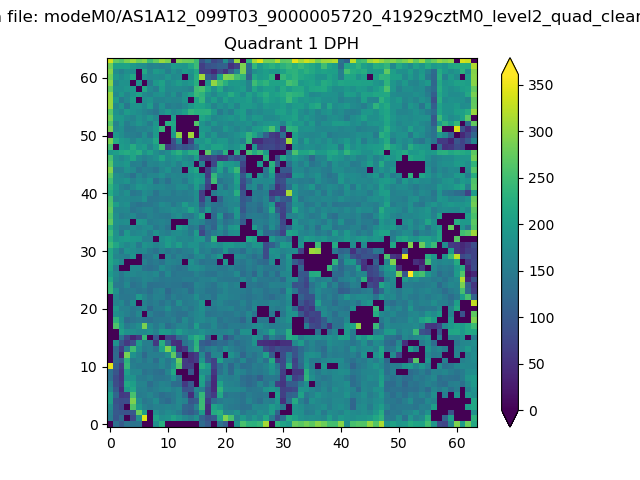 |
Quadrant B |
|---|---|---|---|
| Quadrant D | 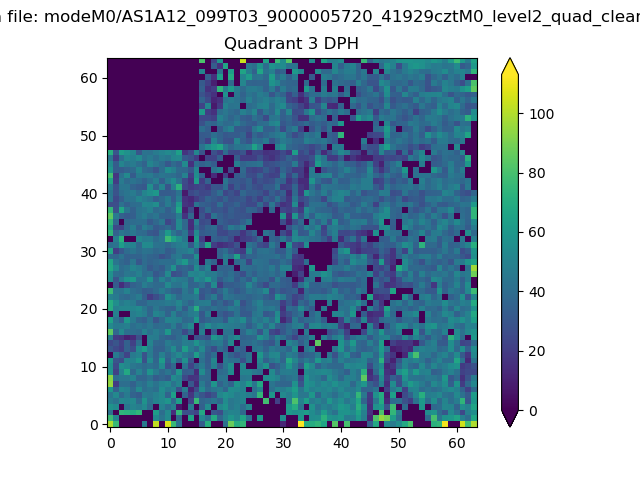 |
 |
Quadrant C |
| Plot type | Count rate plots | Images |
|---|---|---|
| Comparison with Poisson distribution Blue bars denote a histogram of data divided into 1 sec bins. Red curve is a Poisson curve with rate = median count rate of data. |
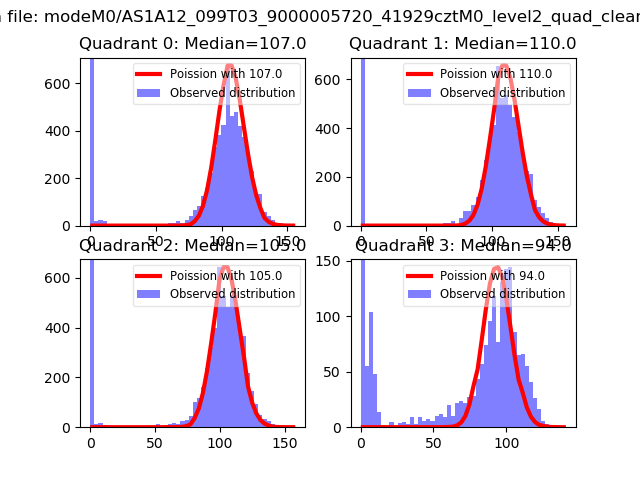 |
 |
| Quadrant-wise count rates Data is divided into 100 sec bins |
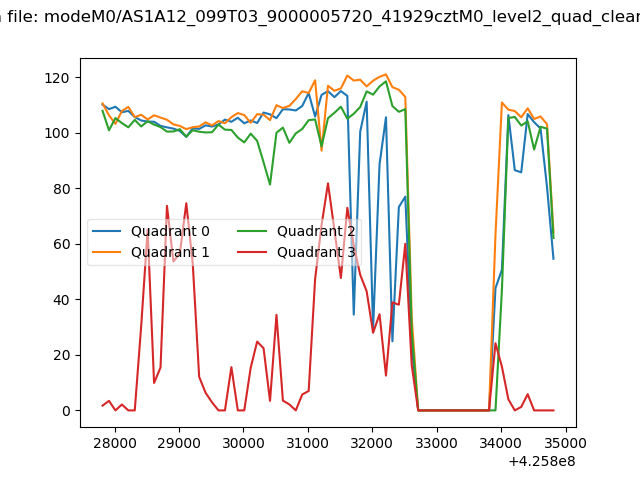 |
|
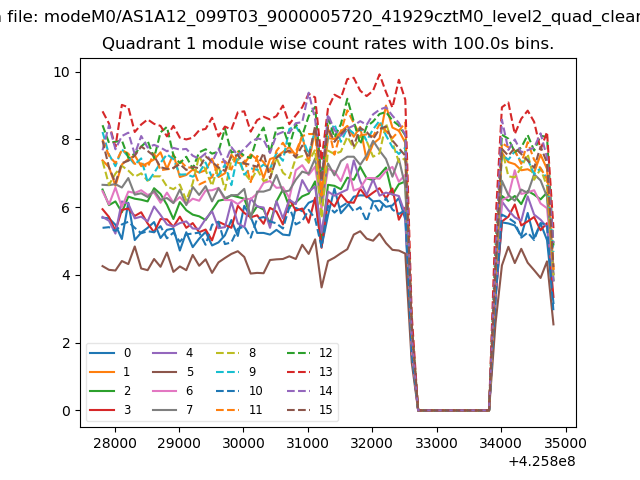
| Module-wise count rates for Quadrant A Data is divided into 100 sec bins |
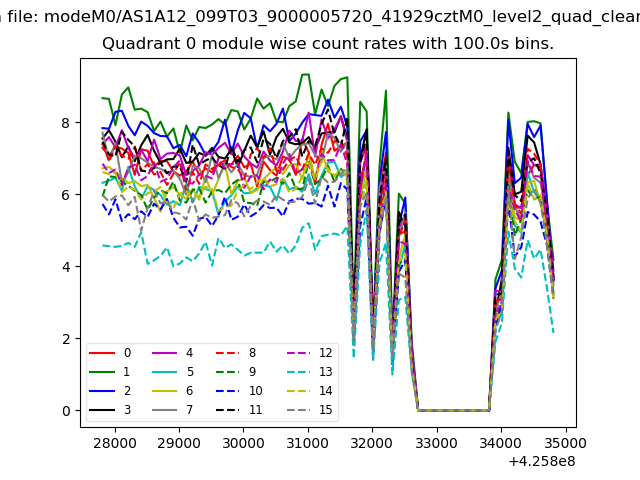 |
 |
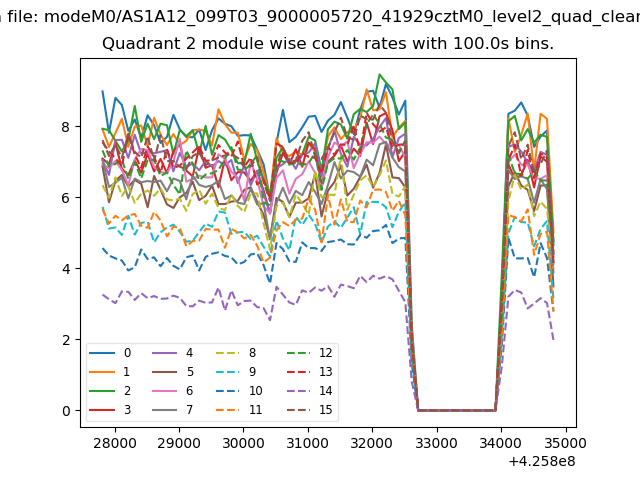
| Module-wise count rates for Quadrant B Data is divided into 100 sec bins |
 |
 |
| Module-wise count rates for Quadrant C Data is divided into 100 sec bins |
 |
 |
| Module-wise count rates for Quadrant D Data is divided into 100 sec bins |
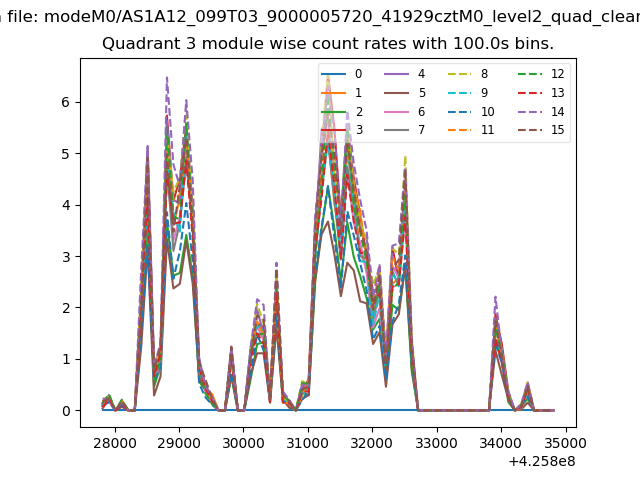 |
 |
| Parameter | Plot |
|---|---|
| CZT HV Monitor | 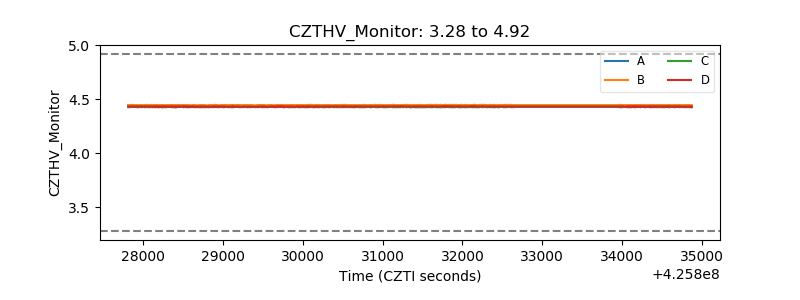 |
| D_VDD | 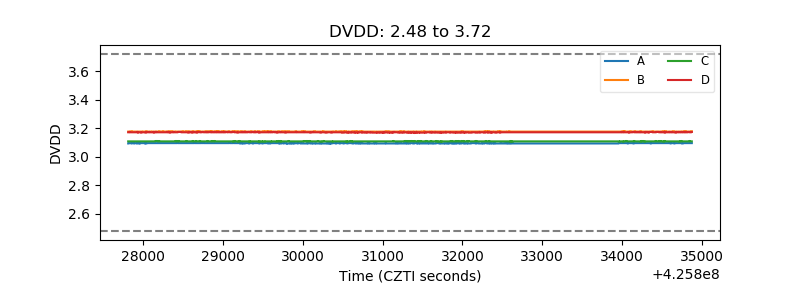 |
| Temperature 1 | 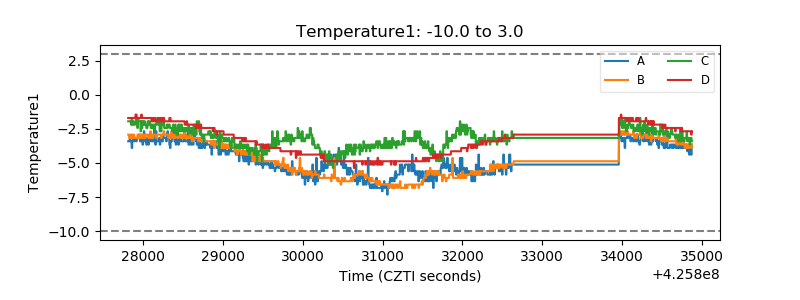 |
| Veto HV Monitor |  |
| Veto LLD | 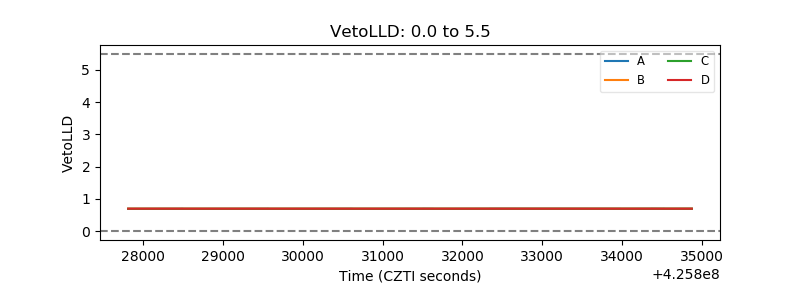 |
| Alpha Counter | 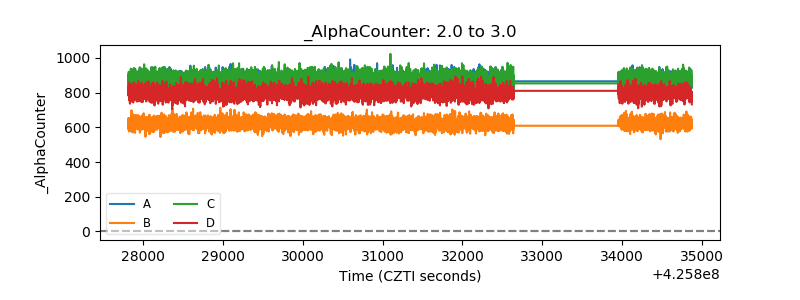 |
| _CPM_Rate | 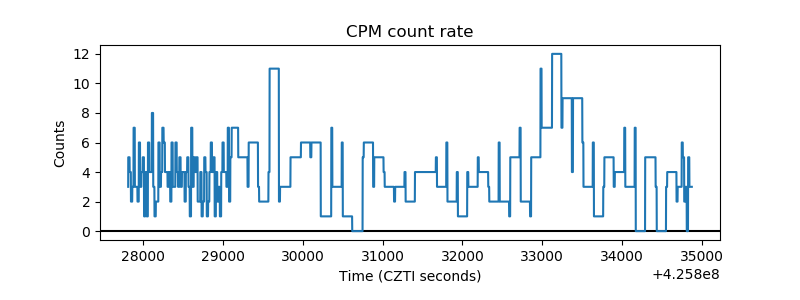 |
| CZT Counter | 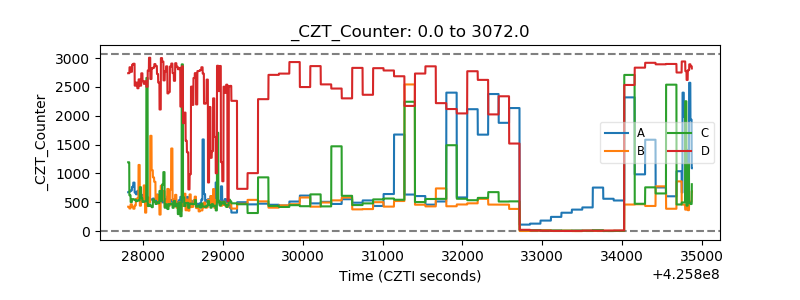 |
| +2.5 Volts monitor | 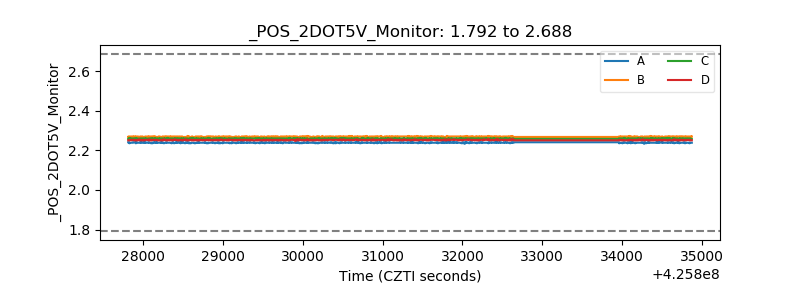 |
| +5 Volts monitor |  |
| _ROLL_ROT |  |
| _Roll_DEC | 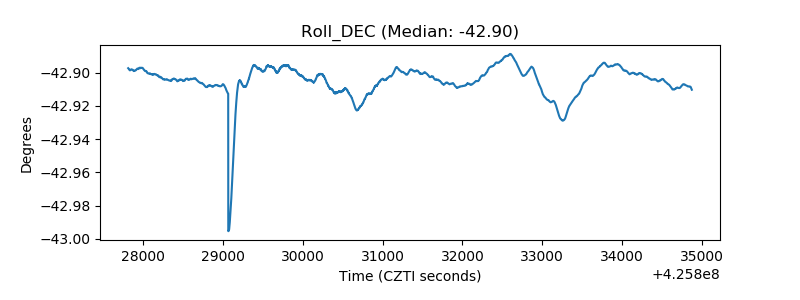 |
| _Roll_RA | 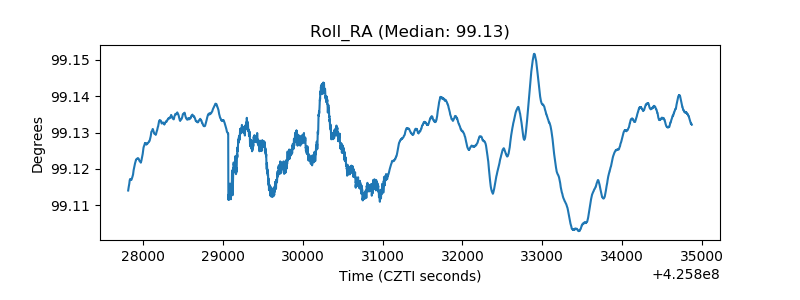 |
| Veto Counter | 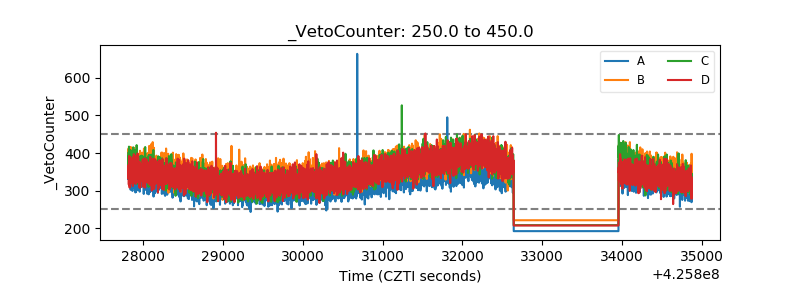 |