| Param | Original file | Final file |
|---|---|---|
| Filename | modeM0/AS1A12_099T03_9000005720_41932cztM0_level2.fits | modeM0/AS1A12_099T03_9000005720_41932cztM0_level2_quad_clean.evt |
| Size (bytes) | 1,866,041,280 | 204,635,520 |
| Size | 1.7 GB | 195.2 MB |
| Events in quadrant A | 13,572,065 | 1,489,089 |
| Events in quadrant B | 7,650,705 | 1,672,601 |
| Events in quadrant C | 12,223,189 | 1,457,725 |
| Events in quadrant D | 34,441,836 | 513,853 |
| Mode M0 | |||
|---|---|---|---|
| Quadrant | BADHDUFLAG | Total packets | Discarded packets |
| A | 0 | 50342 | 3 |
| B | 0 | 33247 | 3 |
| C | 0 | 45984 | 3 |
| D | 0 | 112478 | 3 |
| Mode SS | |||
|---|---|---|---|
| Quadrant | BADHDUFLAG | Total packets | Discarded packets |
| A | 0 | 314 | 0 |
| B | 0 | 314 | 0 |
| C | 0 | 314 | 0 |
| D | 0 | 314 | 0 |
| Mode M9 | |||
|---|---|---|---|
| Quadrant | BADHDUFLAG | Total packets | Discarded packets |
| A | 0 | 42 | 0 |
| B | 0 | 42 | 0 |
| C | 0 | 42 | 0 |
| D | 0 | 42 | 0 |
| Quadrant | Total seconds | Saturated seconds | Saturation percentage |
|---|---|---|---|
| A | 15384 | 1763 | 11.459958% |
| B | 15384 | 77 | 0.500520% |
| C | 15384 | 1403 | 9.119865% |
| D | 15384 | 10765 | 69.975299% |
Noise dominated data is calculated using 1-second bins in cleaned event files. If a bin has >2000 counts, and if more than 50% of those come from <1% of pixels, then it is considered to be noise-dominated and hence unusable.
| Quadrant | # 1 sec bins | Bins with >0 counts | Bins with >2000 counts | High rate bins dominated by noise | Noise dominated (total time) | Noise dominated (detector-on time) | Marked lightcurve |
|---|---|---|---|---|---|---|---|
| A | 19591 | 15387 | 1432 | 1432 | 7.31% | 9.31% | 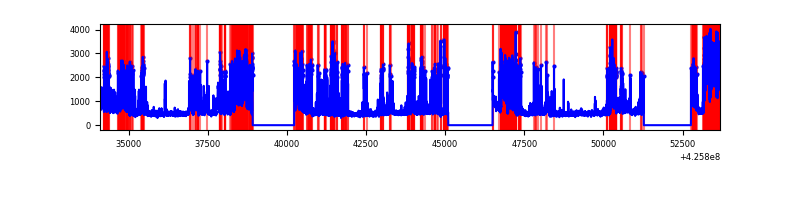 |
| B | 19591 | 15387 | 40 | 40 | 0.20% | 0.26% | 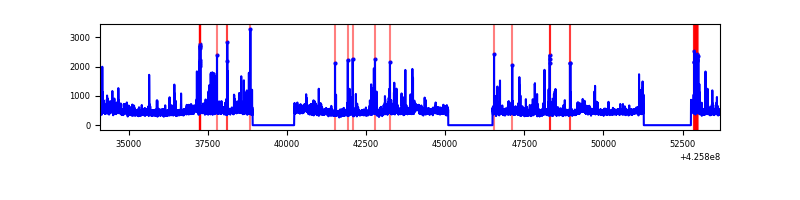 |
| C | 19591 | 15387 | 1392 | 1392 | 7.11% | 9.05% | 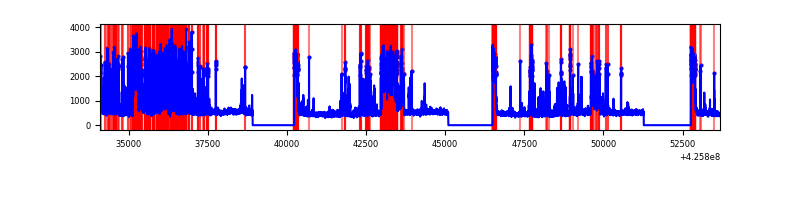 |
| D | 19591 | 15387 | 10912 | 10912 | 55.70% | 70.92% | 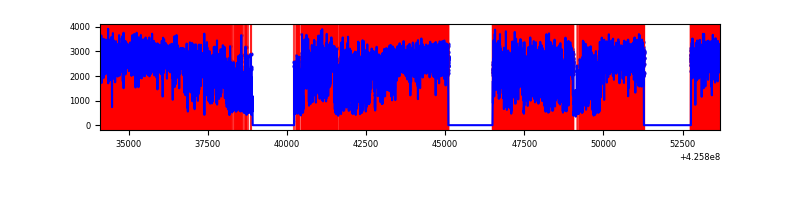 |
Top three noisy pixels from each quadrant. If the there are fewer than three noisy pixels in the level2.evt file, extra rows are filled as -1
| Pixel properties | Quadrant properties | ||||||
|---|---|---|---|---|---|---|---|
| Quadrant | DetID | PixID | Counts | Sigma | Mean | Median | Sigma |
| A | 14 | 24 | 6136594 | 18956.31 | 1587 | 1552 | 323.6 |
| A | 10 | 83 | 1239421 | 3824.82 | 1587 | 1552 | 323.6 |
| A | 14 | 250 | 22901 | 65.97 | 1587 | 1552 | 323.6 |
| B | 0 | 229 | 625118 | 1978.62 | 1645 | 1597 | 315.1 |
| B | 0 | 156 | 238885 | 752.99 | 1645 | 1597 | 315.1 |
| B | 5 | 255 | 110712 | 346.26 | 1645 | 1597 | 315.1 |
| C | 4 | 254 | 3831187 | 10676.14 | 1550 | 1558 | 358.7 |
| C | 0 | 10 | 1028052 | 2861.63 | 1550 | 1558 | 358.7 |
| C | 14 | 254 | 661866 | 1840.79 | 1550 | 1558 | 358.7 |
| D | 12 | 79 | 29741000 | 122393.49 | 988 | 955 | 243.0 |
| D | 13 | 249 | 378101 | 1552.12 | 988 | 955 | 243.0 |
| D | 12 | 6 | 141401 | 578.0 | 988 | 955 | 243.0 |
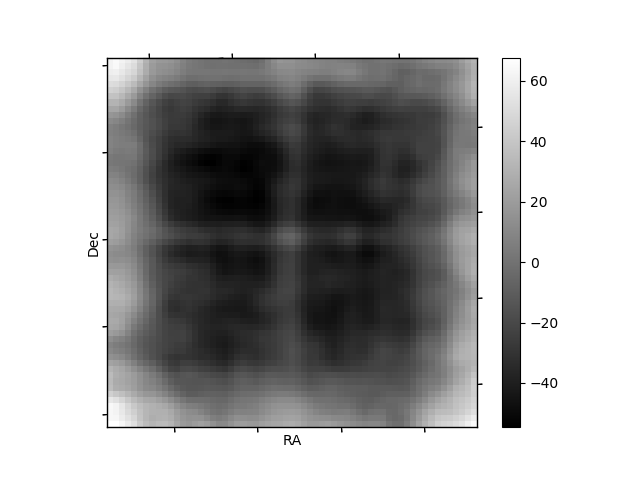
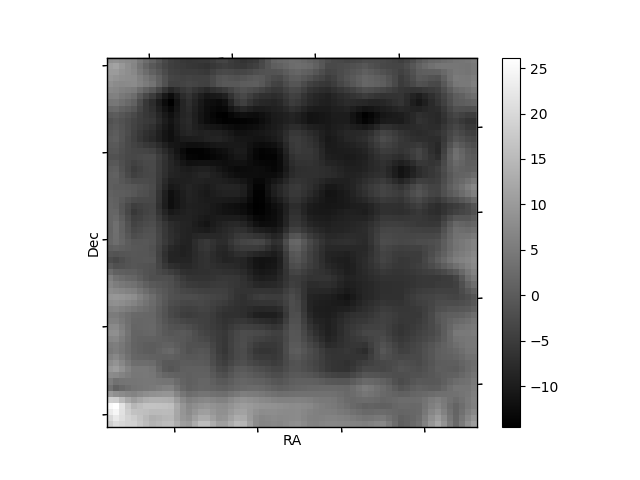
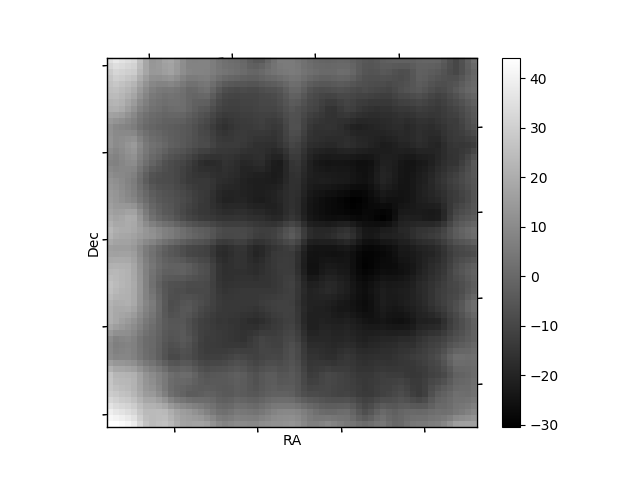
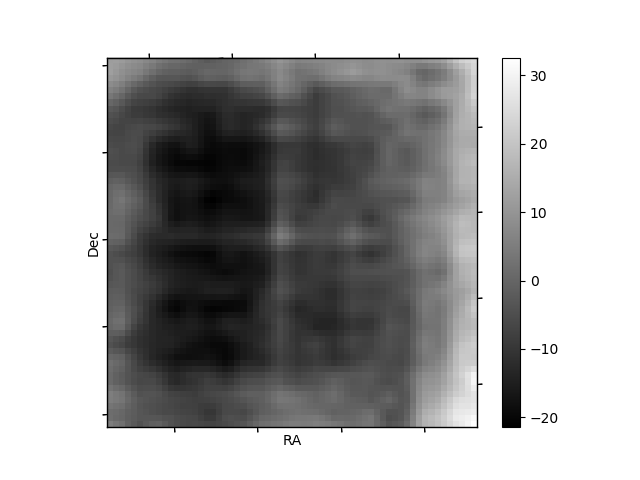
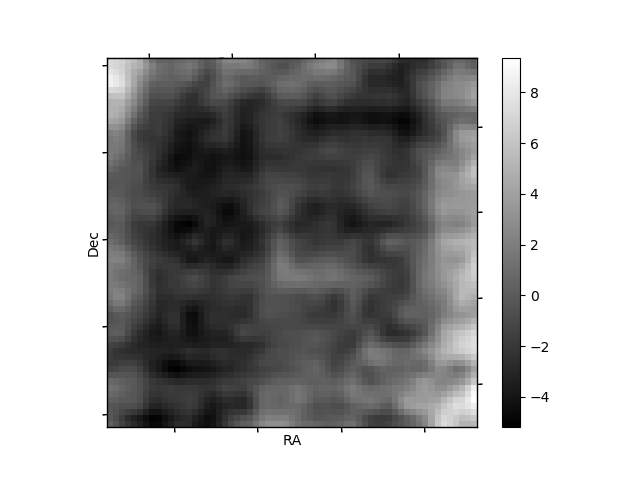
Histogram calculated using DETX and DETY for each event in the final _common_clean file
| Quadrant A | 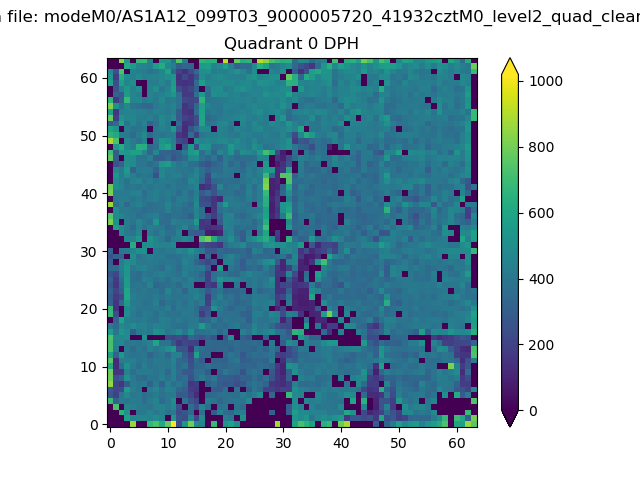 |
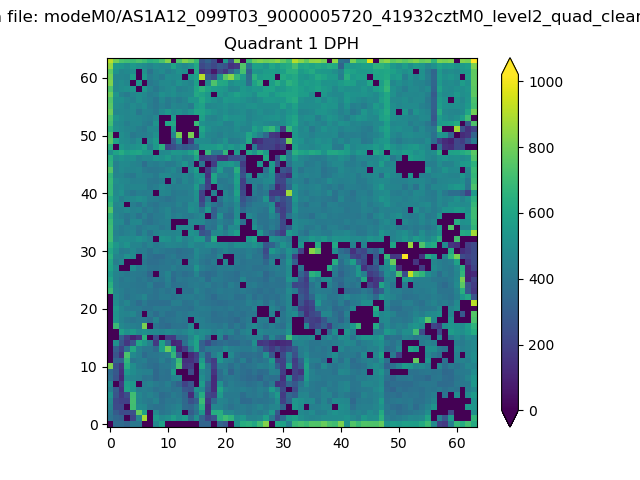 |
Quadrant B |
|---|---|---|---|
| Quadrant D | 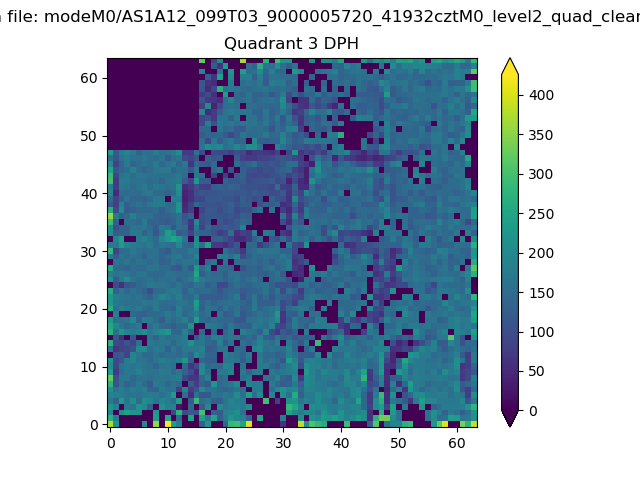 |
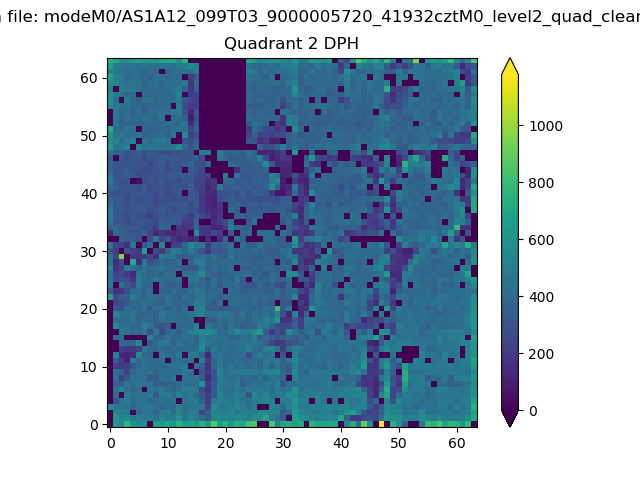 |
Quadrant C |
| Plot type | Count rate plots | Images |
|---|---|---|
| Comparison with Poisson distribution Blue bars denote a histogram of data divided into 1 sec bins. Red curve is a Poisson curve with rate = median count rate of data. |
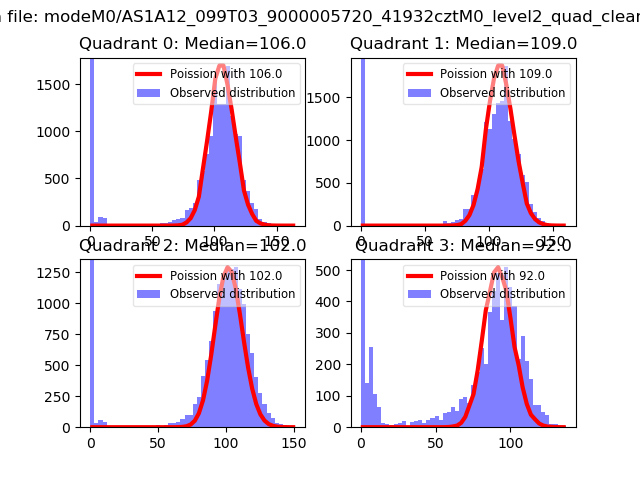 |
 |
| Quadrant-wise count rates Data is divided into 100 sec bins |
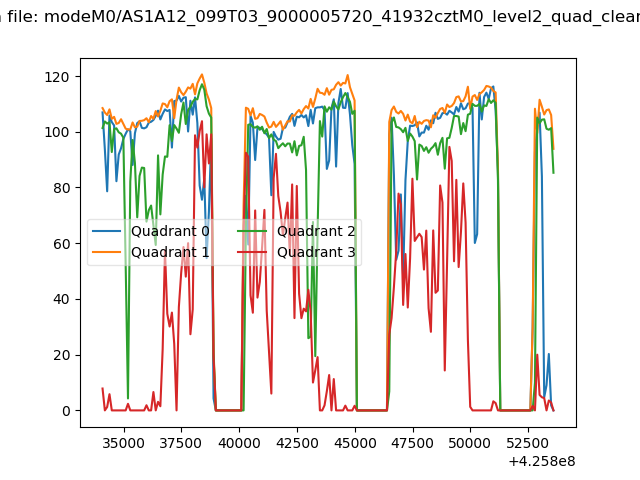 |
|
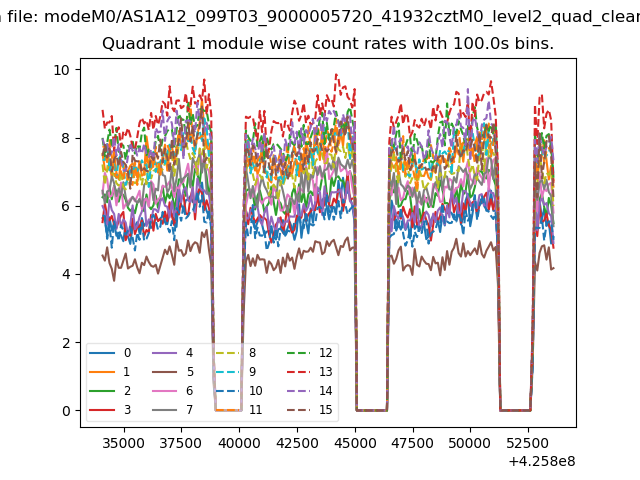
| Module-wise count rates for Quadrant A Data is divided into 100 sec bins |
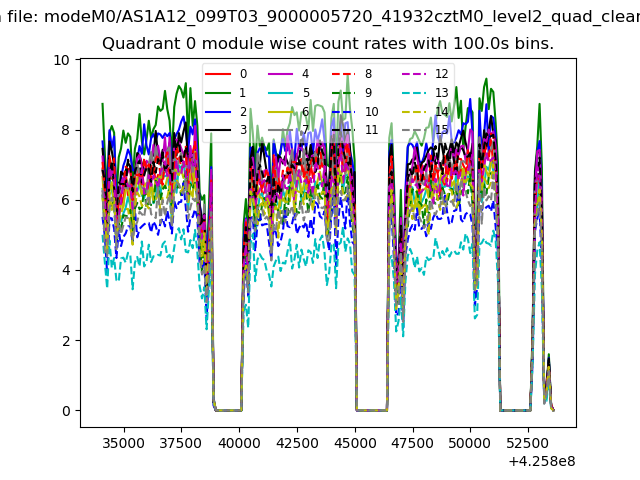 |
 |
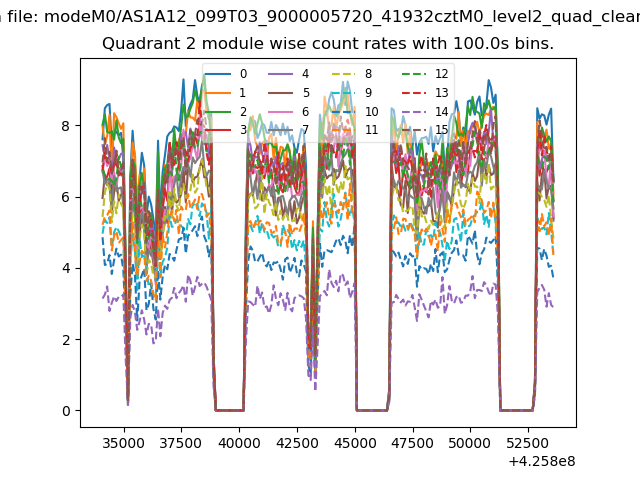
| Module-wise count rates for Quadrant B Data is divided into 100 sec bins |
 |
 |
| Module-wise count rates for Quadrant C Data is divided into 100 sec bins |
 |
 |
| Module-wise count rates for Quadrant D Data is divided into 100 sec bins |
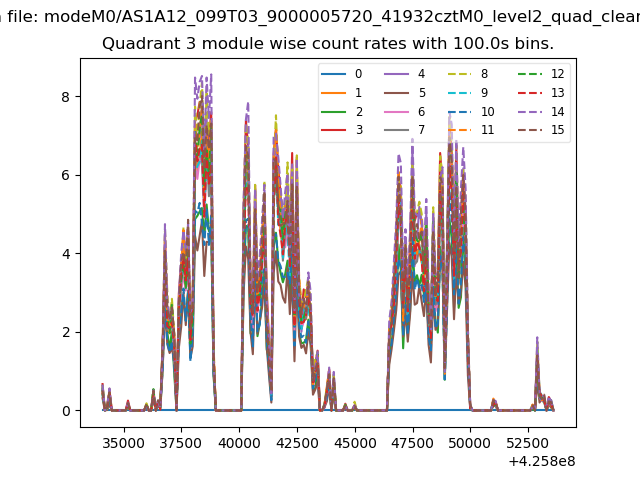 |
 |
| Parameter | Plot |
|---|---|
| CZT HV Monitor | 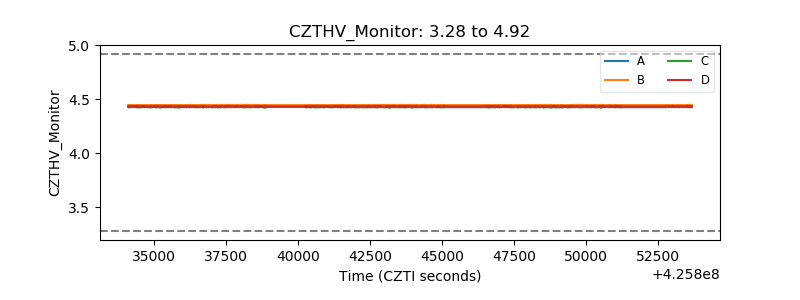 |
| D_VDD | 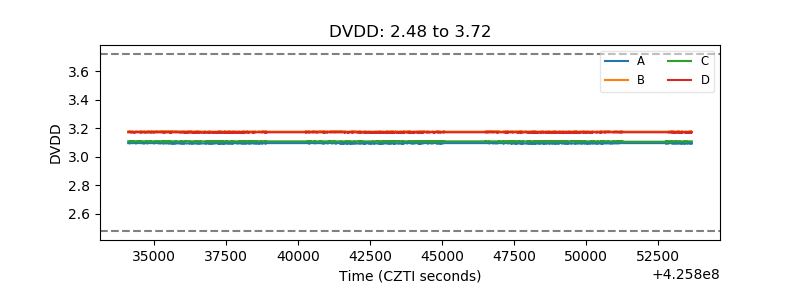 |
| Temperature 1 |  |
| Veto HV Monitor | 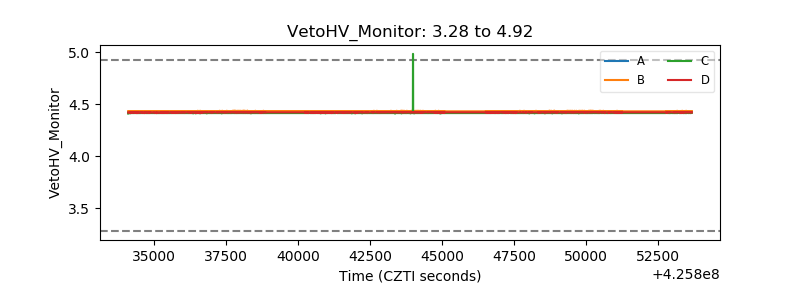 |
| Veto LLD | 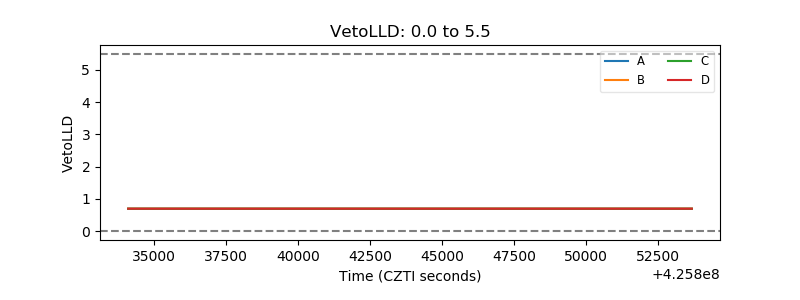 |
| Alpha Counter | 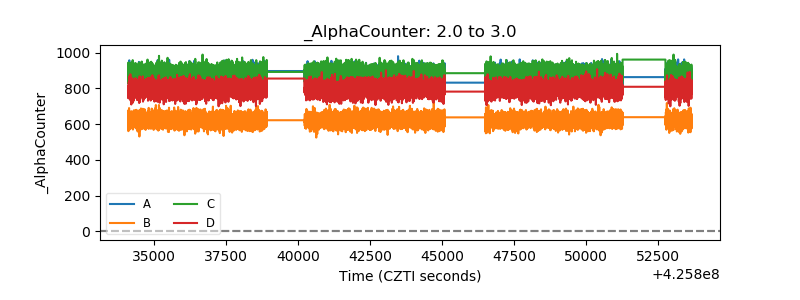 |
| _CPM_Rate | 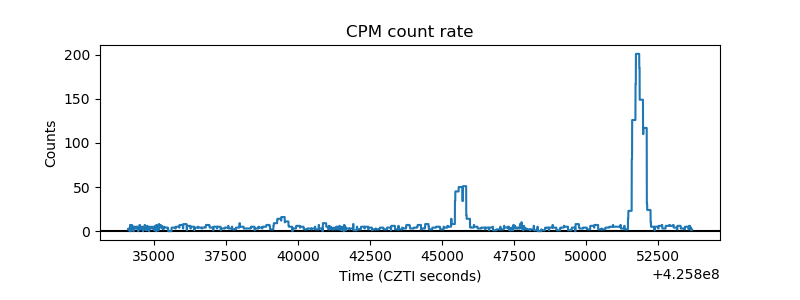 |
| CZT Counter | 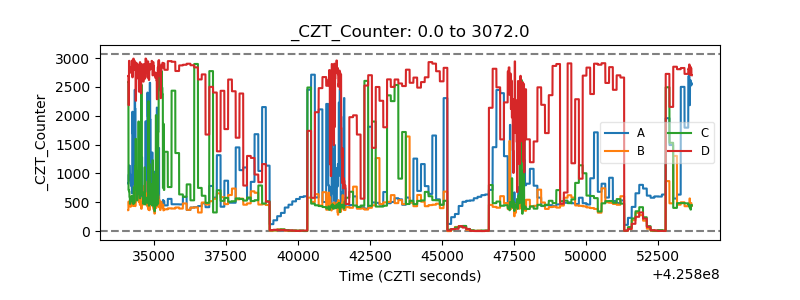 |
| +2.5 Volts monitor | 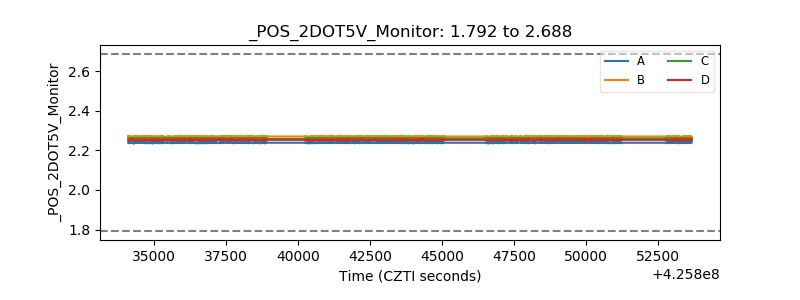 |
| +5 Volts monitor | 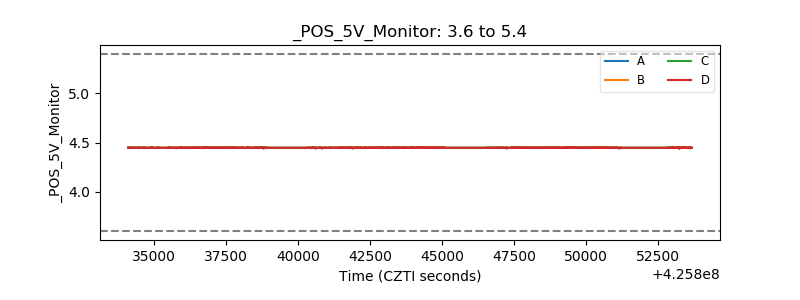 |
| _ROLL_ROT |  |
| _Roll_DEC | 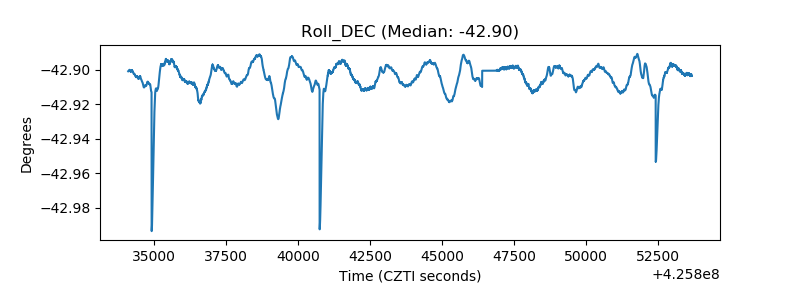 |
| _Roll_RA | 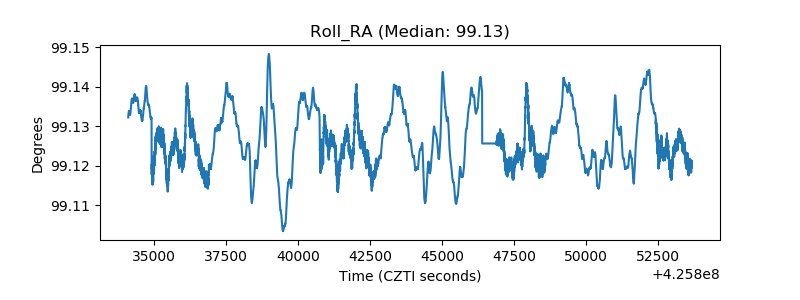 |
| Veto Counter | 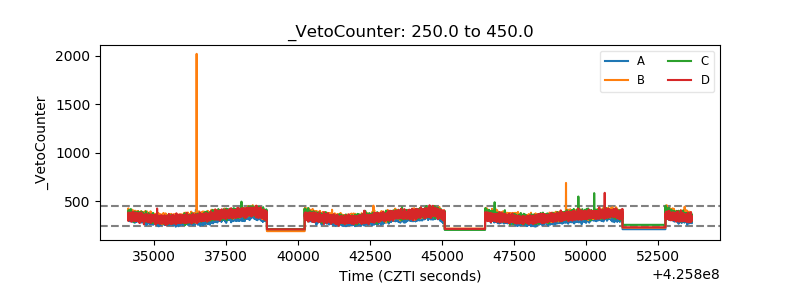 |