| Param | Original file | Final file |
|---|---|---|
| Filename | modeM0/AS1A12_099T03_9000005720_41933cztM0_level2.fits | modeM0/AS1A12_099T03_9000005720_41933cztM0_level2_quad_clean.evt |
| Size (bytes) | 848,220,480 | 58,582,080 |
| Size | 808.9 MB | 55.9 MB |
| Events in quadrant A | 10,333,595 | 207,436 |
| Events in quadrant B | 2,761,848 | 598,238 |
| Events in quadrant C | 3,582,318 | 538,084 |
| Events in quadrant D | 14,296,503 | 46,701 |
| Mode M0 | |||
|---|---|---|---|
| Quadrant | BADHDUFLAG | Total packets | Discarded packets |
| A | 0 | 34488 | 2 |
| B | 0 | 12052 | 2 |
| C | 0 | 13991 | 2 |
| D | 0 | 45992 | 2 |
| Mode SS | |||
|---|---|---|---|
| Quadrant | BADHDUFLAG | Total packets | Discarded packets |
| A | 0 | 112 | 0 |
| B | 0 | 112 | 0 |
| C | 0 | 112 | 0 |
| D | 0 | 112 | 0 |
| Mode M9 | |||
|---|---|---|---|
| Quadrant | BADHDUFLAG | Total packets | Discarded packets |
| A | 0 | 20 | 0 |
| B | 0 | 21 | 0 |
| C | 0 | 21 | 0 |
| D | 0 | 21 | 0 |
| Quadrant | Total seconds | Saturated seconds | Saturation percentage |
|---|---|---|---|
| A | 5472 | 3684 | 67.324561% |
| B | 5472 | 92 | 1.681287% |
| C | 5472 | 338 | 6.176901% |
| D | 5472 | 5106 | 93.311404% |
Noise dominated data is calculated using 1-second bins in cleaned event files. If a bin has >2000 counts, and if more than 50% of those come from <1% of pixels, then it is considered to be noise-dominated and hence unusable.
| Quadrant | # 1 sec bins | Bins with >0 counts | Bins with >2000 counts | High rate bins dominated by noise | Noise dominated (total time) | Noise dominated (detector-on time) | Marked lightcurve |
|---|---|---|---|---|---|---|---|
| A | 7084 | 5473 | 3100 | 3100 | 43.76% | 56.64% | 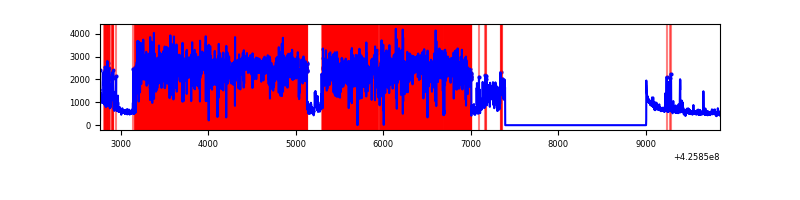 |
| B | 7084 | 5473 | 69 | 69 | 0.97% | 1.26% | 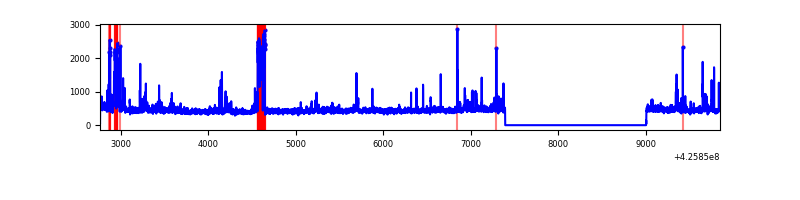 |
| C | 7084 | 5473 | 333 | 333 | 4.70% | 6.08% | 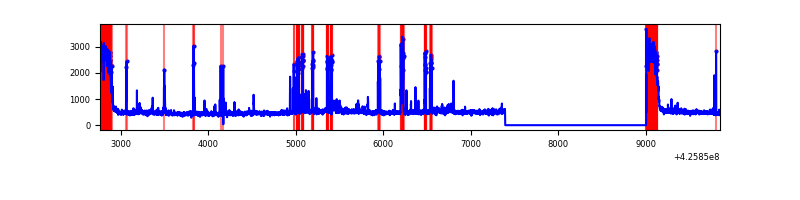 |
| D | 7084 | 5473 | 5037 | 5037 | 71.10% | 92.03% | 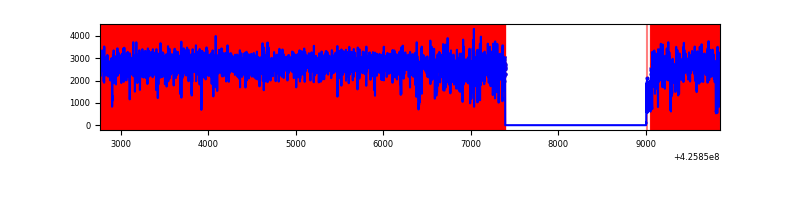 |
Top three noisy pixels from each quadrant. If the there are fewer than three noisy pixels in the level2.evt file, extra rows are filled as -1
| Pixel properties | Quadrant properties | ||||||
|---|---|---|---|---|---|---|---|
| Quadrant | DetID | PixID | Counts | Sigma | Mean | Median | Sigma |
| A | 14 | 24 | 8832110 | 143959.99 | 293 | 286 | 61.3 |
| A | 10 | 83 | 357690 | 5825.74 | 293 | 286 | 61.3 |
| A | 13 | 6 | 6301 | 98.05 | 293 | 286 | 61.3 |
| B | 0 | 229 | 363937 | 3178.87 | 585 | 566 | 114.3 |
| B | 0 | 245 | 52412 | 453.56 | 585 | 566 | 114.3 |
| B | 5 | 255 | 35016 | 301.38 | 585 | 566 | 114.3 |
| C | 0 | 10 | 725620 | 5585.66 | 555 | 557 | 129.8 |
| C | 4 | 254 | 397662 | 3059.17 | 555 | 557 | 129.8 |
| C | 15 | 214 | 214227 | 1646.05 | 555 | 557 | 129.8 |
| D | 12 | 79 | 13036277 | 214629.86 | 243 | 235 | 60.7 |
| D | 13 | 249 | 147107 | 2418.15 | 243 | 235 | 60.7 |
| D | 12 | 6 | 31566 | 515.84 | 243 | 235 | 60.7 |
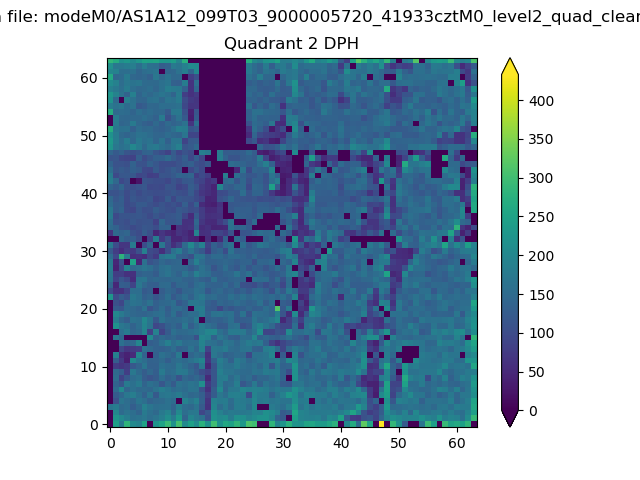
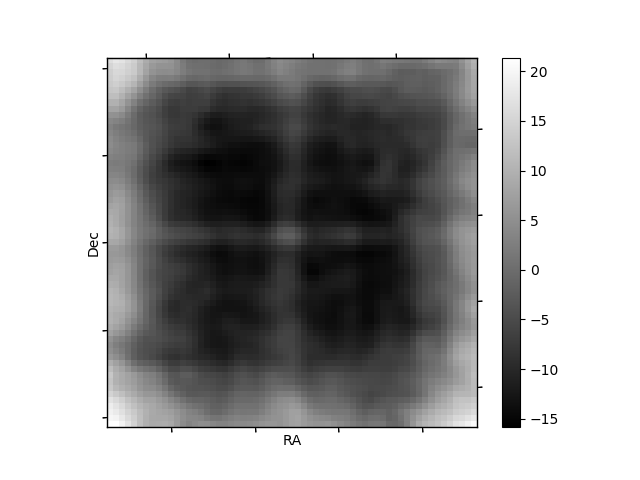
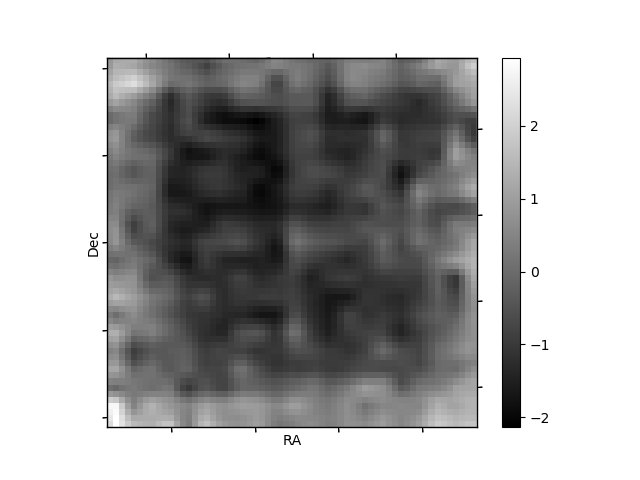
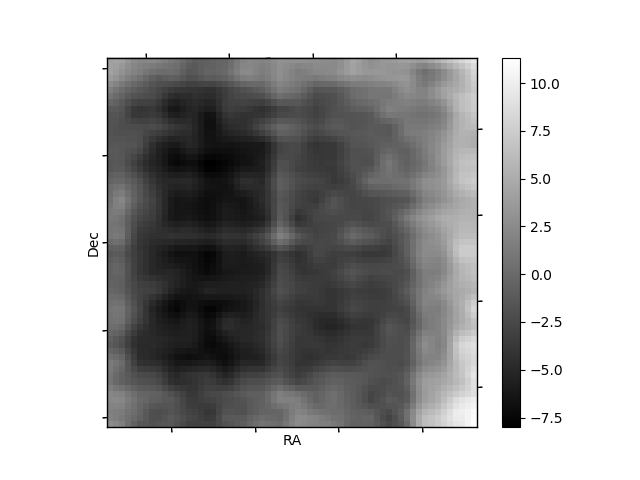
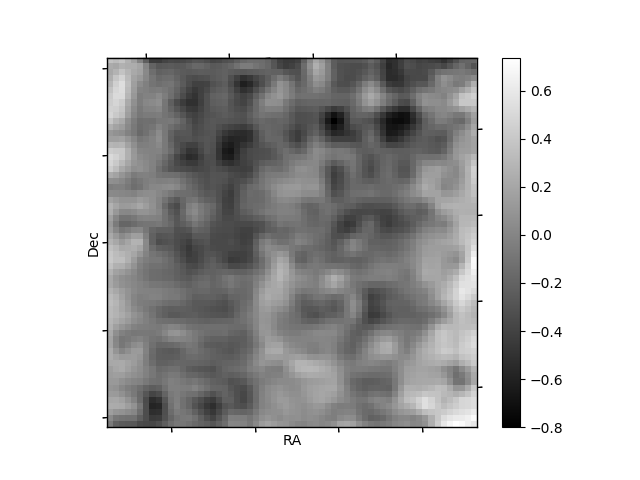
Histogram calculated using DETX and DETY for each event in the final _common_clean file
| Quadrant A | 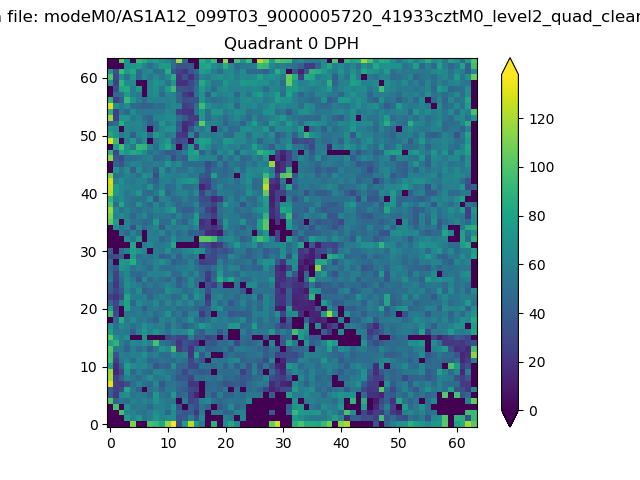 |
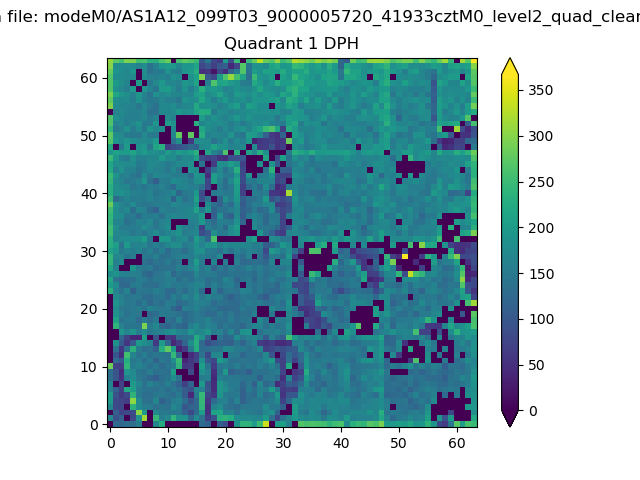 |
Quadrant B |
|---|---|---|---|
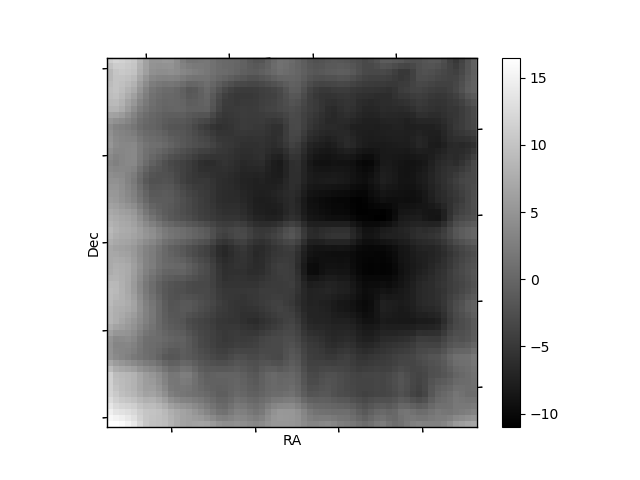
| Quadrant D | 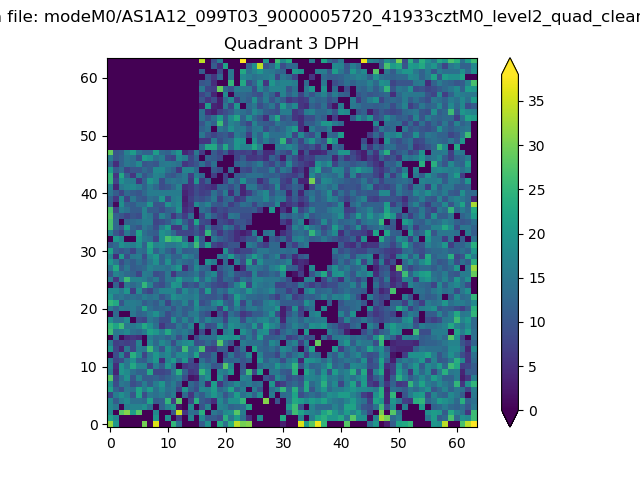 |
 |
Quadrant C |
| Plot type | Count rate plots | Images |
|---|---|---|
| Comparison with Poisson distribution Blue bars denote a histogram of data divided into 1 sec bins. Red curve is a Poisson curve with rate = median count rate of data. |
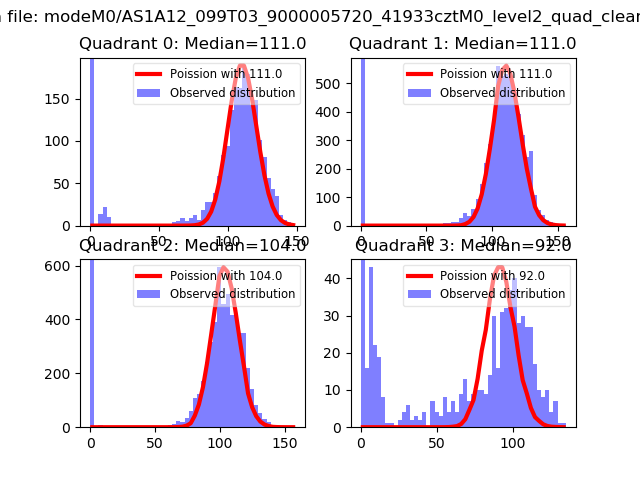 |
 |
| Quadrant-wise count rates Data is divided into 100 sec bins |
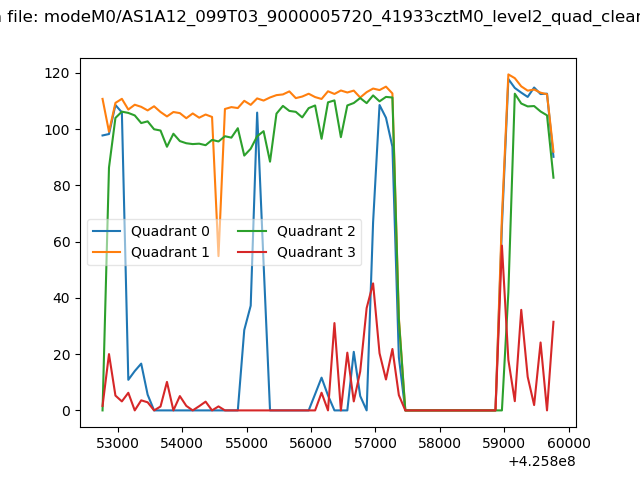 |
|
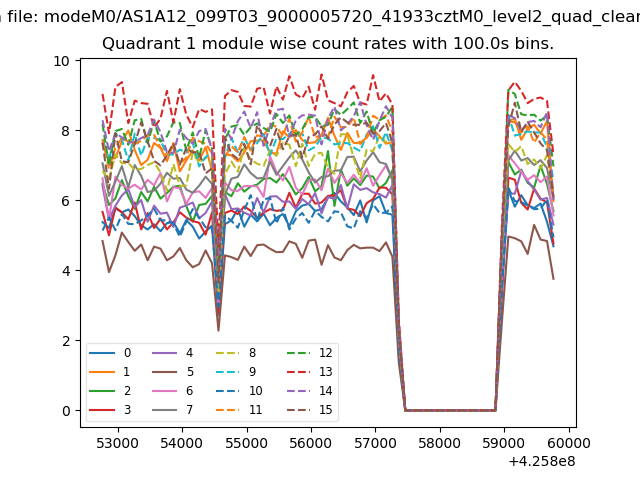
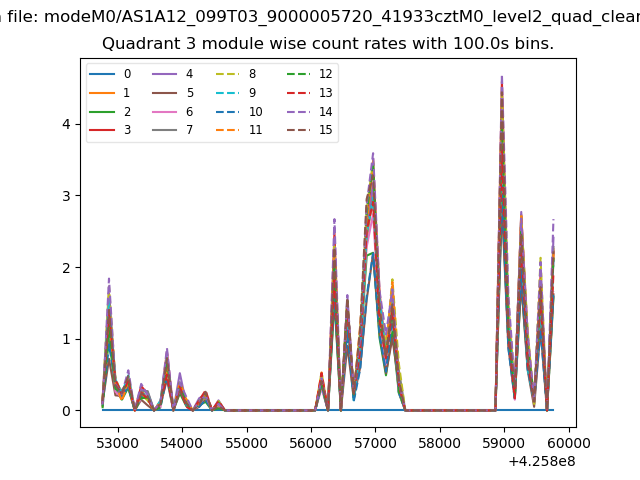
| Module-wise count rates for Quadrant A Data is divided into 100 sec bins |
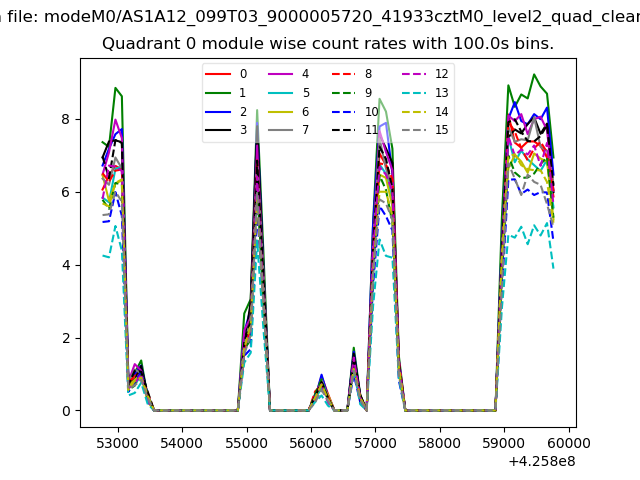 |
 |
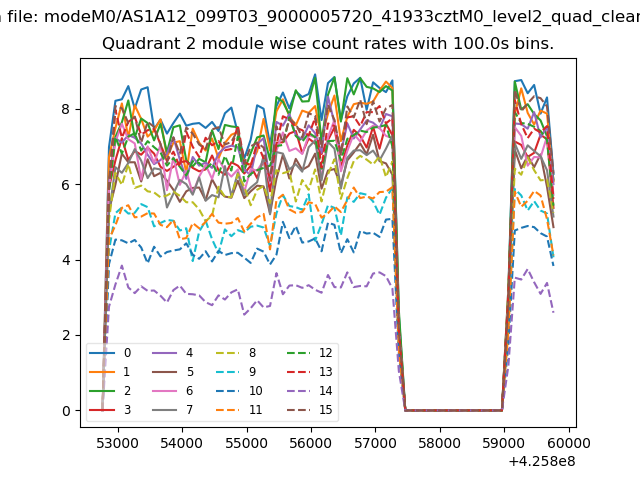
| Module-wise count rates for Quadrant B Data is divided into 100 sec bins |
 |
 |
| Module-wise count rates for Quadrant C Data is divided into 100 sec bins |
 |
 |
| Module-wise count rates for Quadrant D Data is divided into 100 sec bins |
 |
 |
| Parameter | Plot |
|---|---|
| CZT HV Monitor | 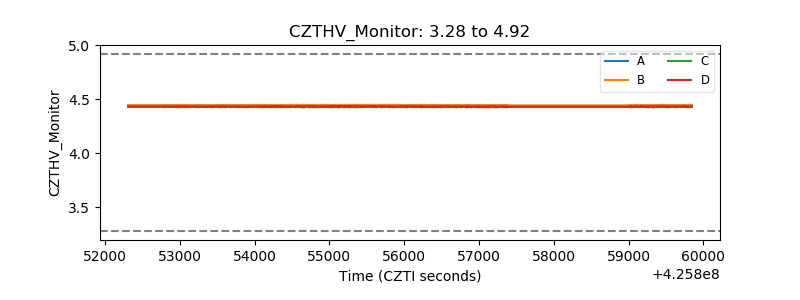 |
| D_VDD | 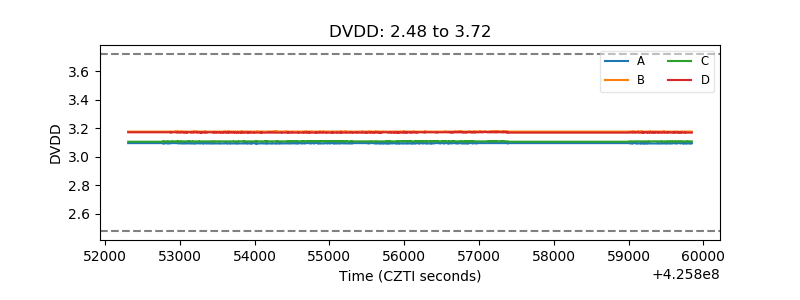 |
| Temperature 1 | 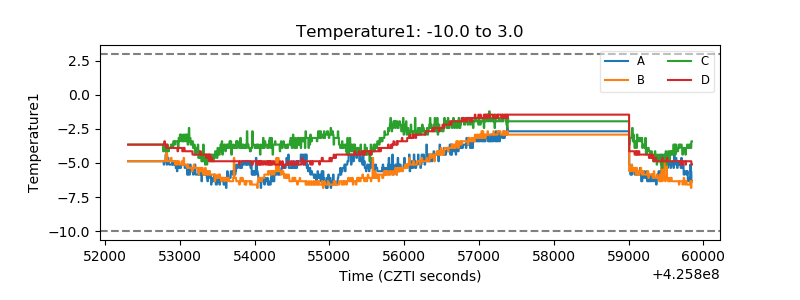 |
| Veto HV Monitor | 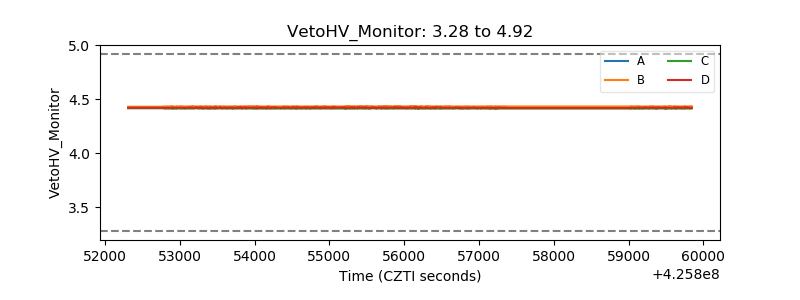 |
| Veto LLD | 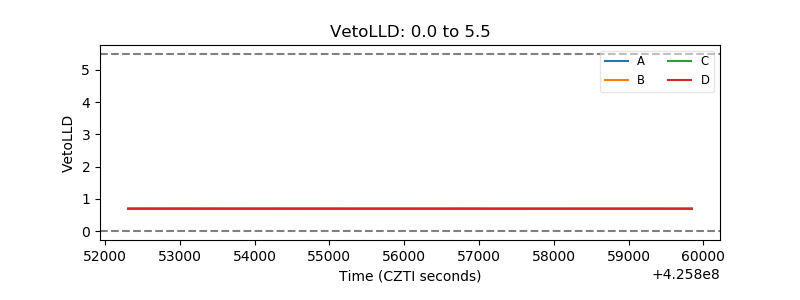 |
| Alpha Counter | 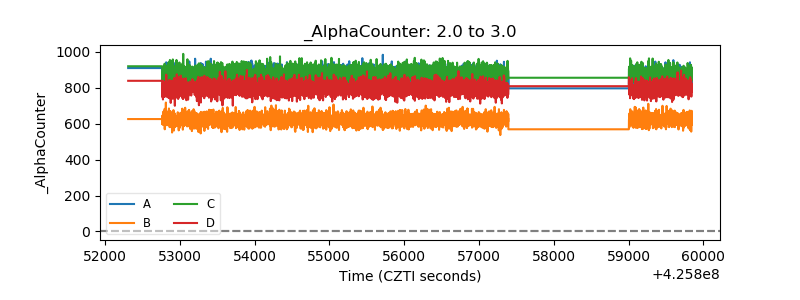 |
| _CPM_Rate | 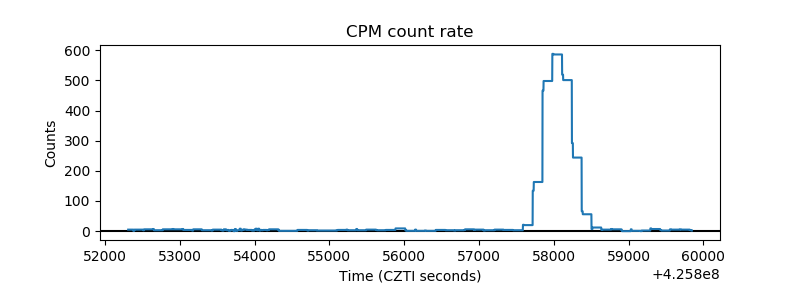 |
| CZT Counter | 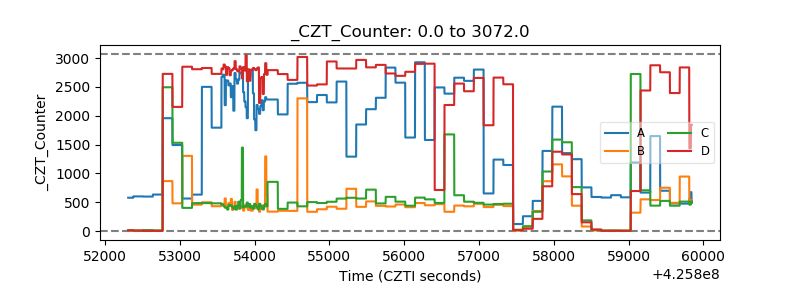 |
| +2.5 Volts monitor | 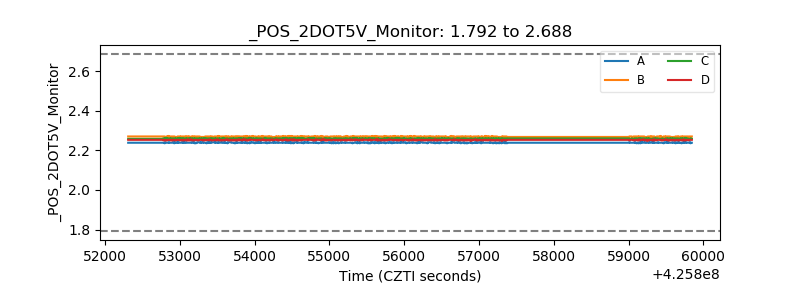 |
| +5 Volts monitor | 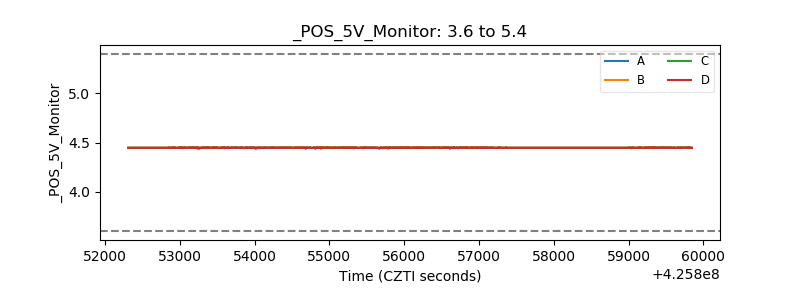 |
| _ROLL_ROT | 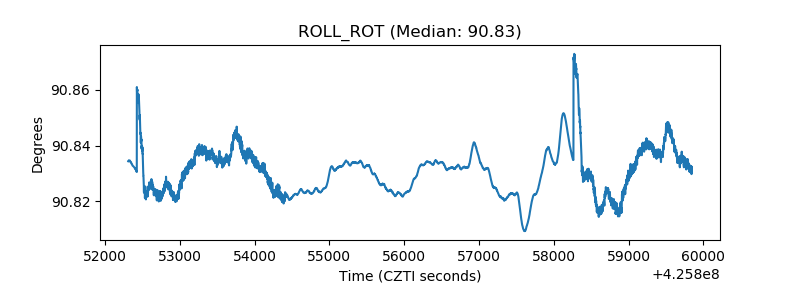 |
| _Roll_DEC | 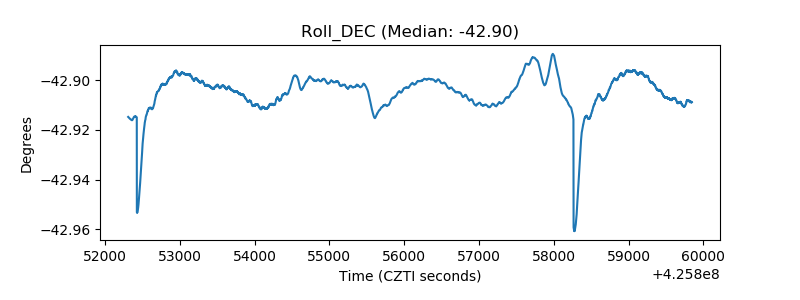 |
| _Roll_RA | 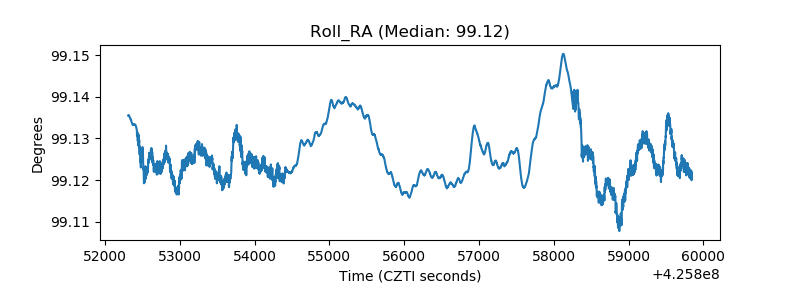 |
| Veto Counter | 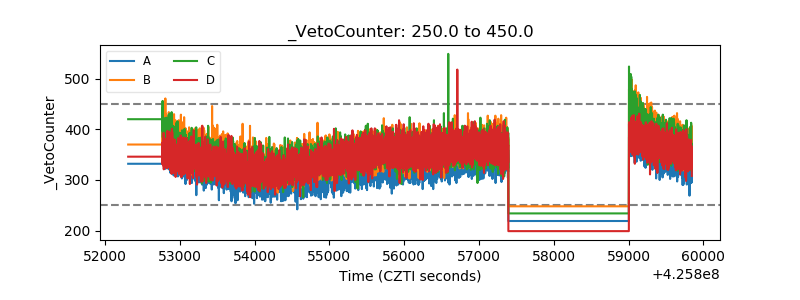 |