| Param | Original file | Final file |
|---|---|---|
| Filename | modeM0/AS1A12_099T03_9000005720_41935cztM0_level2.fits | modeM0/AS1A12_099T03_9000005720_41935cztM0_level2_quad_clean.evt |
| Size (bytes) | 592,894,080 | 77,230,080 |
| Size | 565.4 MB | 73.7 MB |
| Events in quadrant A | 3,335,374 | 602,540 |
| Events in quadrant B | 2,825,513 | 620,404 |
| Events in quadrant C | 3,338,112 | 554,747 |
| Events in quadrant D | 12,027,182 | 181,328 |
| Mode M0 | |||
|---|---|---|---|
| Quadrant | BADHDUFLAG | Total packets | Discarded packets |
| A | 0 | 13241 | 2 |
| B | 0 | 12023 | 2 |
| C | 0 | 13119 | 2 |
| D | 0 | 39367 | 7 |
| Mode SS | |||
|---|---|---|---|
| Quadrant | BADHDUFLAG | Total packets | Discarded packets |
| A | 0 | 112 | 0 |
| B | 0 | 112 | 0 |
| C | 0 | 112 | 0 |
| D | 0 | 112 | 0 |
| Mode M9 | |||
|---|---|---|---|
| Quadrant | BADHDUFLAG | Total packets | Discarded packets |
| A | 0 | 25 | 0 |
| B | 0 | 26 | 0 |
| C | 0 | 26 | 0 |
| D | 0 | 26 | 0 |
| Quadrant | Total seconds | Saturated seconds | Saturation percentage |
|---|---|---|---|
| A | 5412 | 73 | 1.348854% |
| B | 5412 | 53 | 0.979305% |
| C | 5412 | 273 | 5.044346% |
| D | 5411 | 3865 | 71.428571% |
Noise dominated data is calculated using 1-second bins in cleaned event files. If a bin has >2000 counts, and if more than 50% of those come from <1% of pixels, then it is considered to be noise-dominated and hence unusable.
| Quadrant | # 1 sec bins | Bins with >0 counts | Bins with >2000 counts | High rate bins dominated by noise | Noise dominated (total time) | Noise dominated (detector-on time) | Marked lightcurve |
|---|---|---|---|---|---|---|---|
| A | 7145 | 5413 | 38 | 38 | 0.53% | 0.70% | 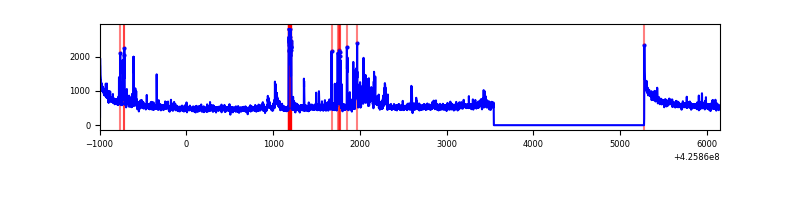 |
| B | 7145 | 5413 | 37 | 37 | 0.52% | 0.68% | 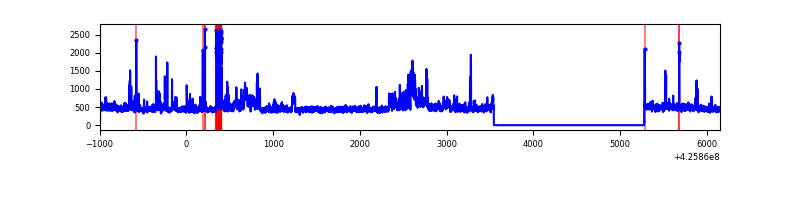 |
| C | 7145 | 5413 | 259 | 259 | 3.62% | 4.78% | 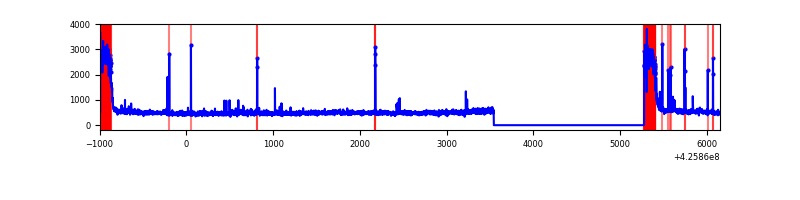 |
| D | 7144 | 5412 | 3873 | 3873 | 54.21% | 71.56% | 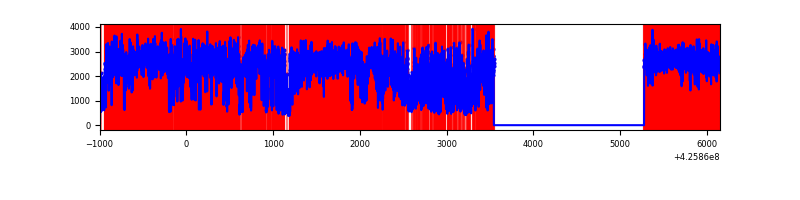 |
Top three noisy pixels from each quadrant. If the there are fewer than three noisy pixels in the level2.evt file, extra rows are filled as -1
| Pixel properties | Quadrant properties | ||||||
|---|---|---|---|---|---|---|---|
| Quadrant | DetID | PixID | Counts | Sigma | Mean | Median | Sigma |
| A | 10 | 83 | 523991 | 4333.57 | 592 | 581 | 120.8 |
| A | 14 | 24 | 503789 | 4166.31 | 592 | 581 | 120.8 |
| A | 13 | 6 | 12089 | 95.28 | 592 | 581 | 120.8 |
| B | 0 | 229 | 456169 | 3996.91 | 590 | 573 | 114.0 |
| B | 5 | 255 | 34221 | 295.19 | 590 | 573 | 114.0 |
| B | 12 | 111 | 14732 | 124.22 | 590 | 573 | 114.0 |
| C | 0 | 10 | 784779 | 6001.38 | 561 | 563 | 130.7 |
| C | 15 | 214 | 210486 | 1606.48 | 561 | 563 | 130.7 |
| C | 4 | 254 | 114407 | 871.22 | 561 | 563 | 130.7 |
| D | 12 | 79 | 10109636 | 107651.0 | 378 | 367 | 93.9 |
| D | 13 | 249 | 280524 | 2983.32 | 378 | 367 | 93.9 |
| D | 12 | 6 | 38844 | 409.73 | 378 | 367 | 93.9 |
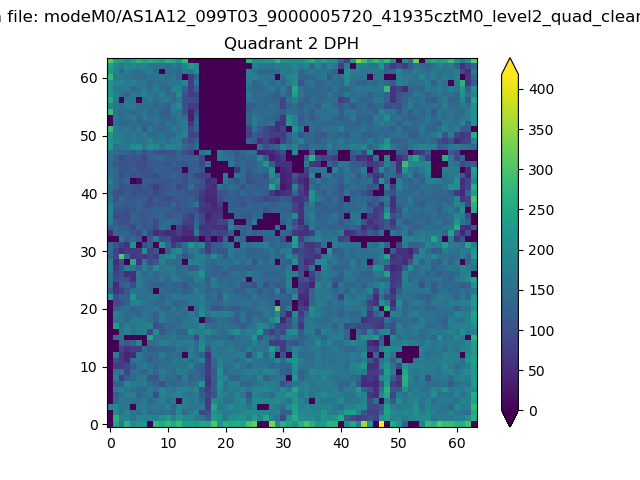
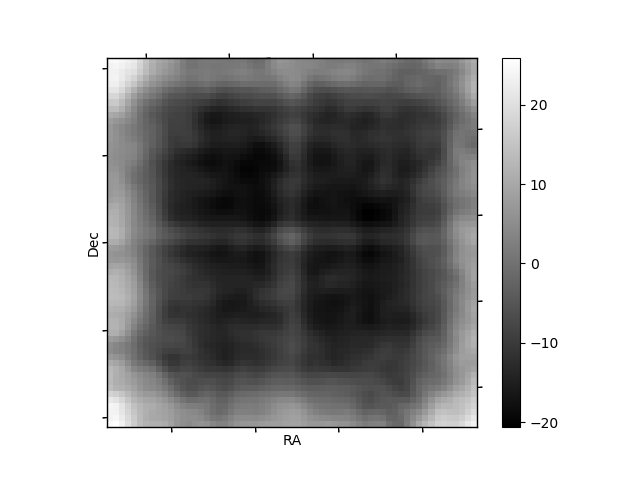
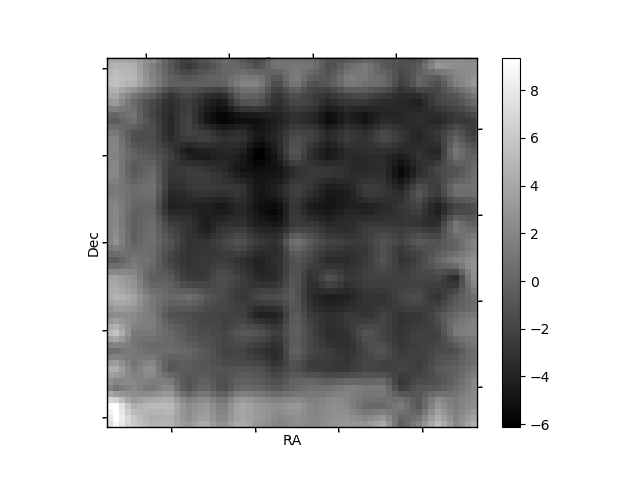
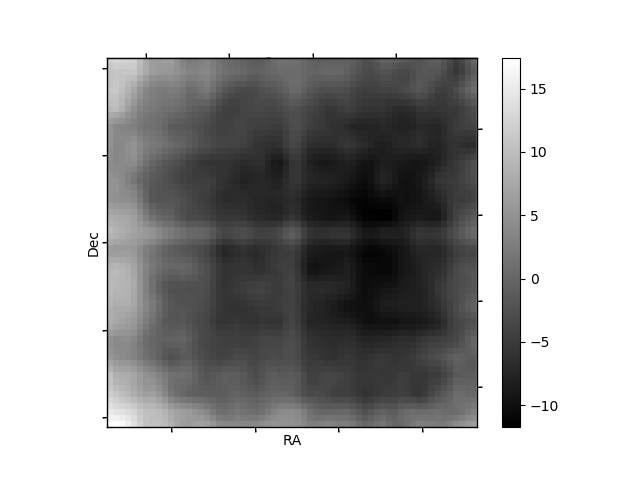
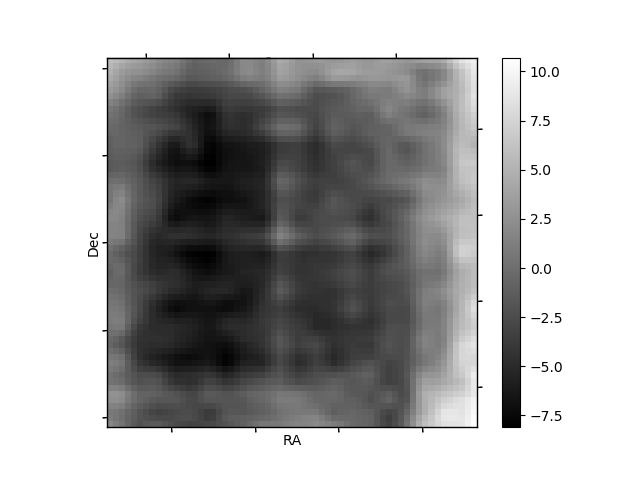
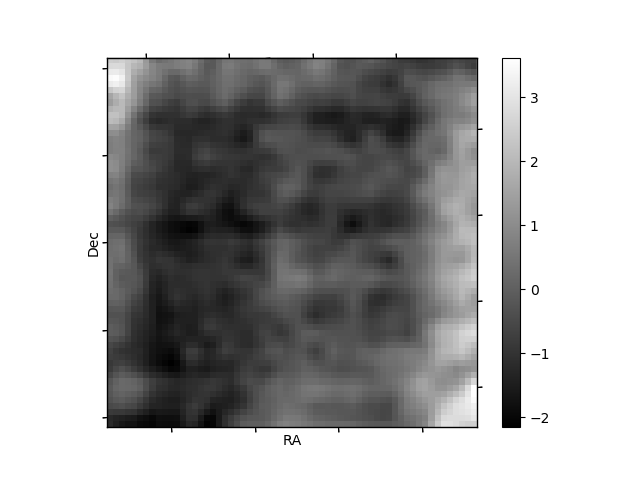
Histogram calculated using DETX and DETY for each event in the final _common_clean file
| Quadrant A | 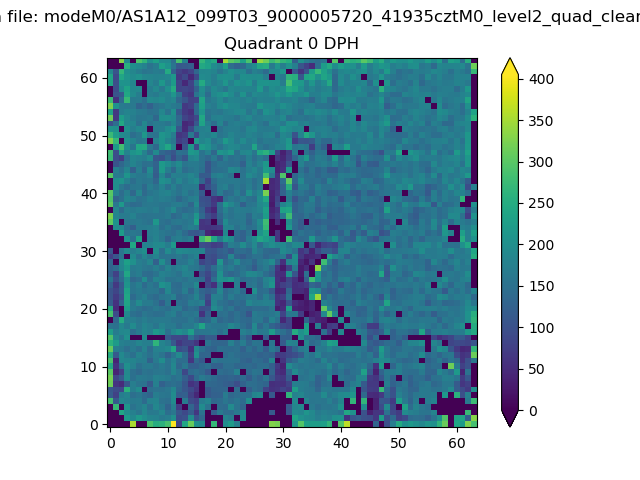 |
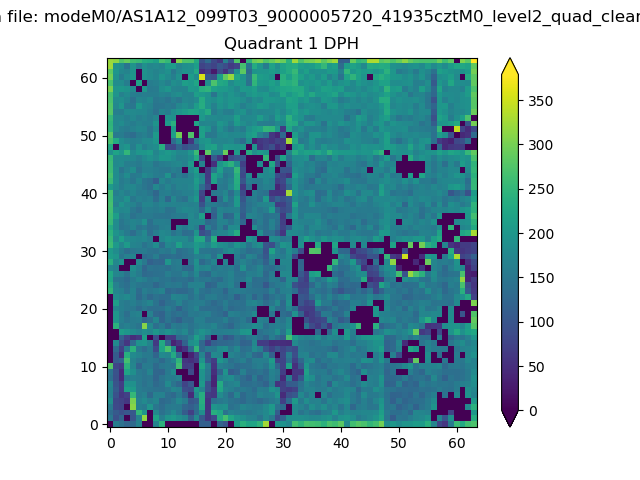 |
Quadrant B |
|---|---|---|---|
| Quadrant D | 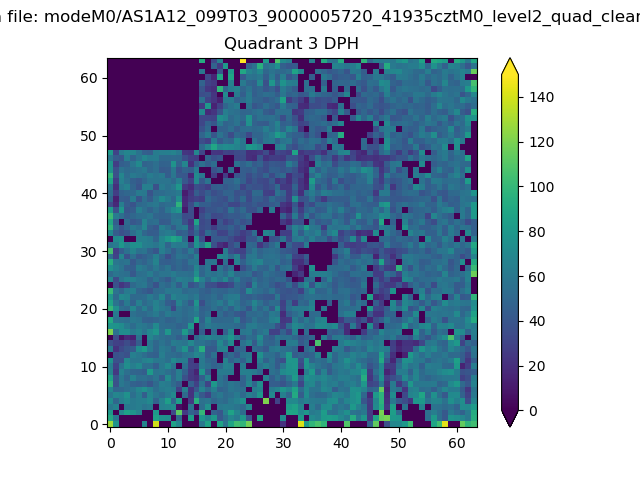 |
 |
Quadrant C |
| Plot type | Count rate plots | Images |
|---|---|---|
| Comparison with Poisson distribution Blue bars denote a histogram of data divided into 1 sec bins. Red curve is a Poisson curve with rate = median count rate of data. |
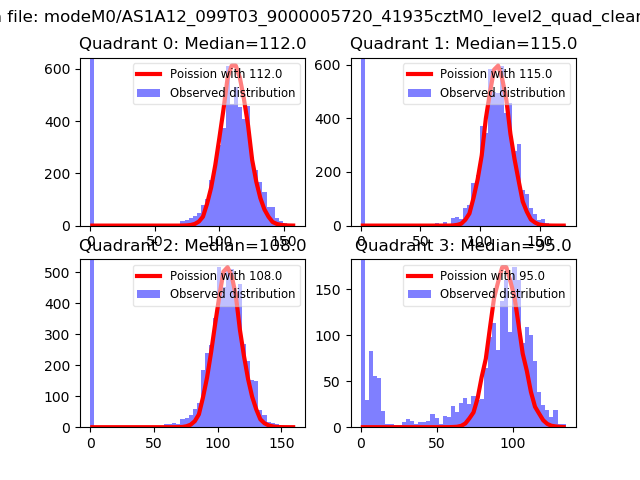 |
 |
| Quadrant-wise count rates Data is divided into 100 sec bins |
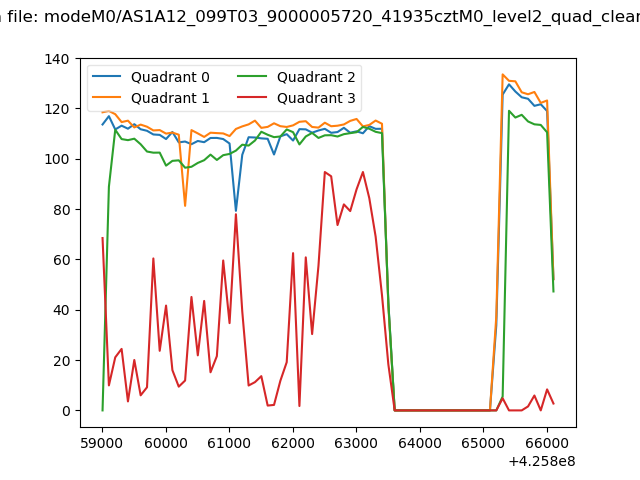 |
|
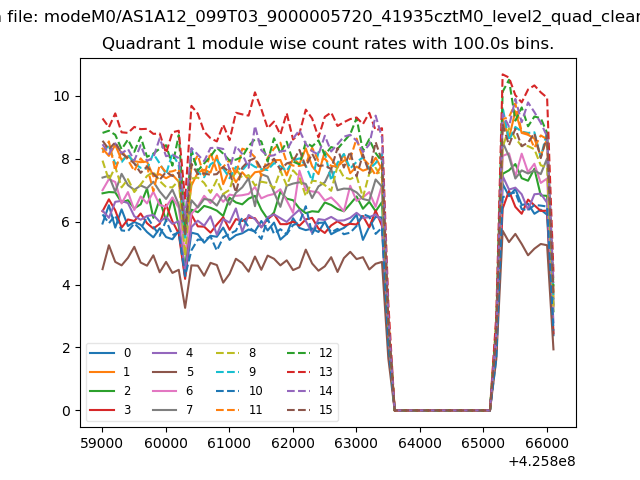
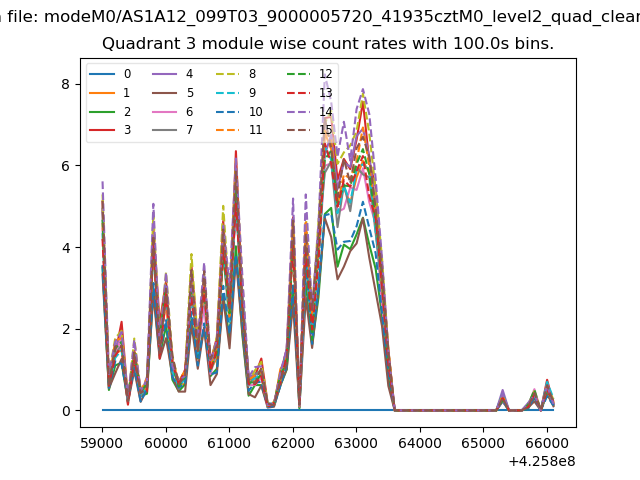
| Module-wise count rates for Quadrant A Data is divided into 100 sec bins |
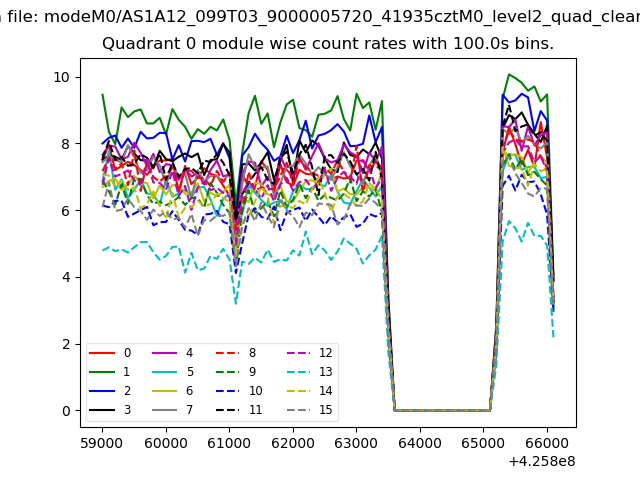 |
 |
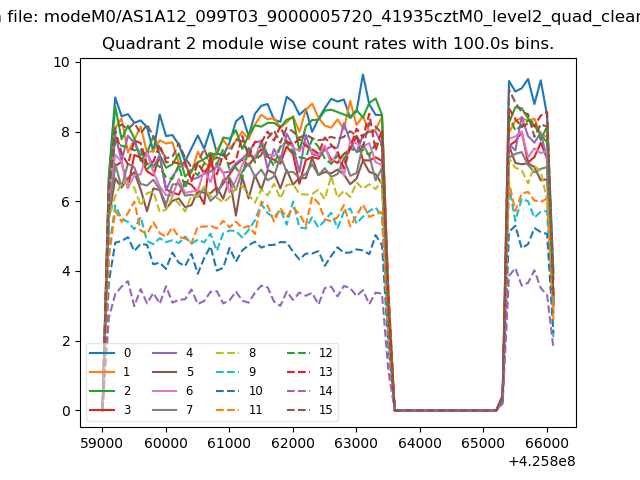
| Module-wise count rates for Quadrant B Data is divided into 100 sec bins |
 |
 |
| Module-wise count rates for Quadrant C Data is divided into 100 sec bins |
 |
 |
| Module-wise count rates for Quadrant D Data is divided into 100 sec bins |
 |
 |
| Parameter | Plot |
|---|---|
| CZT HV Monitor | 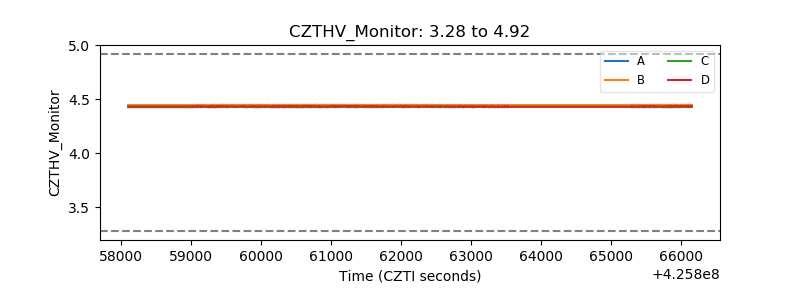 |
| D_VDD | 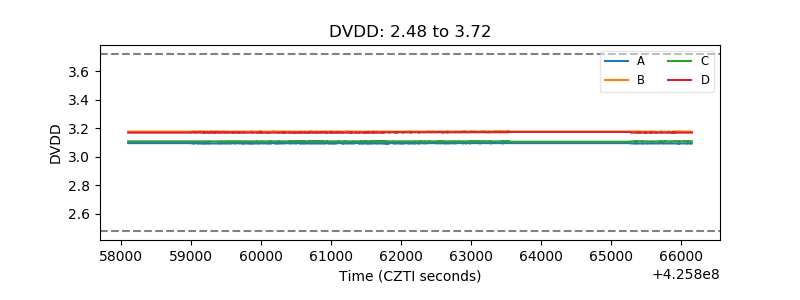 |
| Temperature 1 | 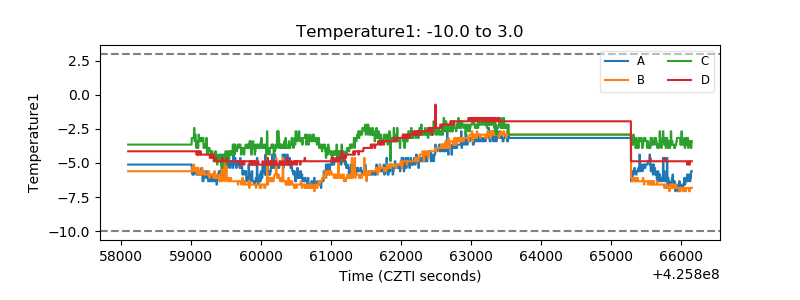 |
| Veto HV Monitor | 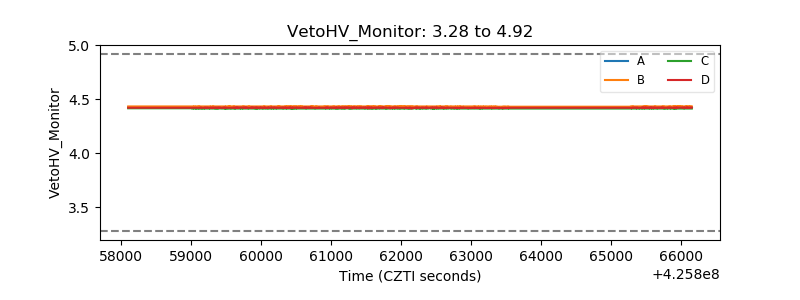 |
| Veto LLD | 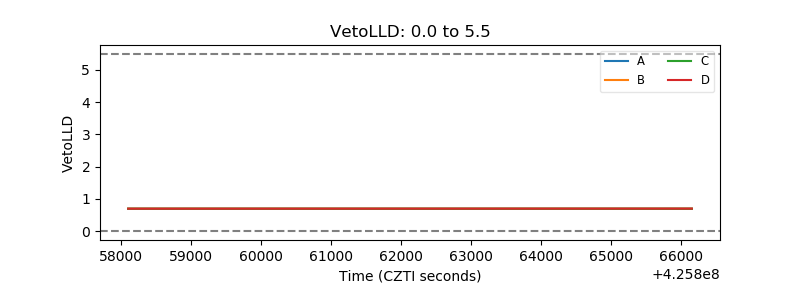 |
| Alpha Counter | 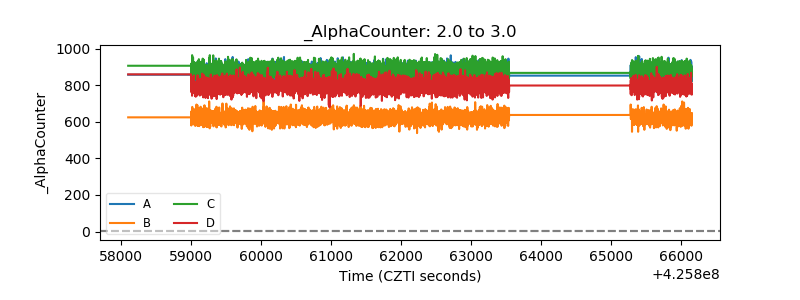 |
| _CPM_Rate | 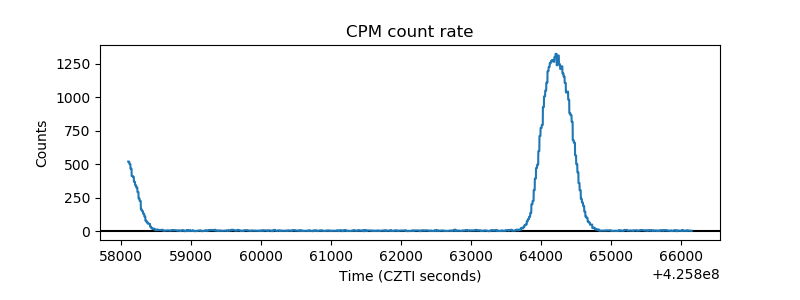 |
| CZT Counter | 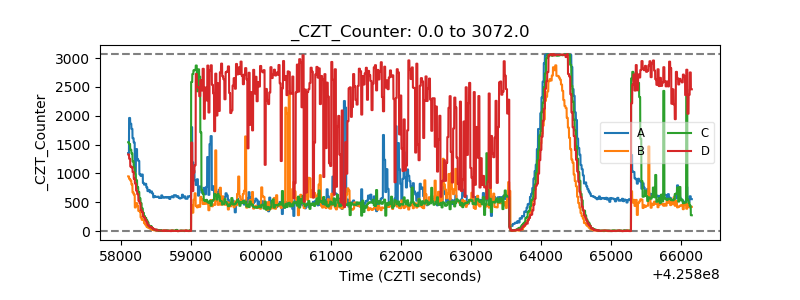 |
| +2.5 Volts monitor | 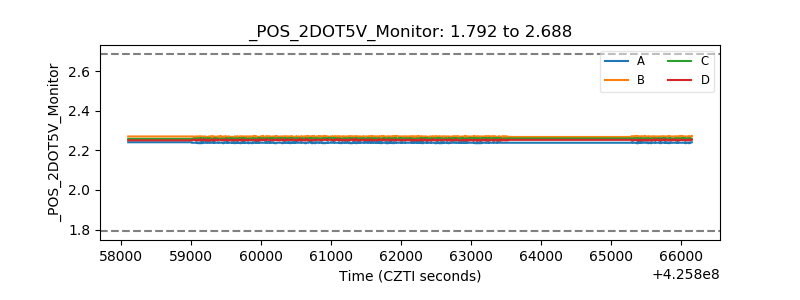 |
| +5 Volts monitor | 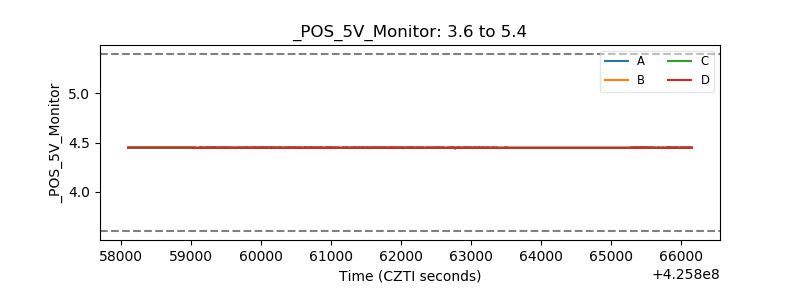 |
| _ROLL_ROT | 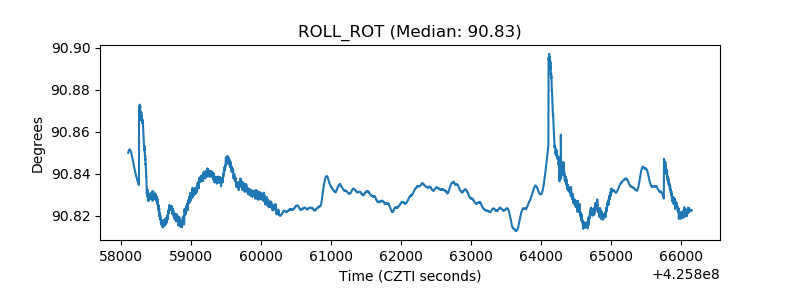 |
| _Roll_DEC | 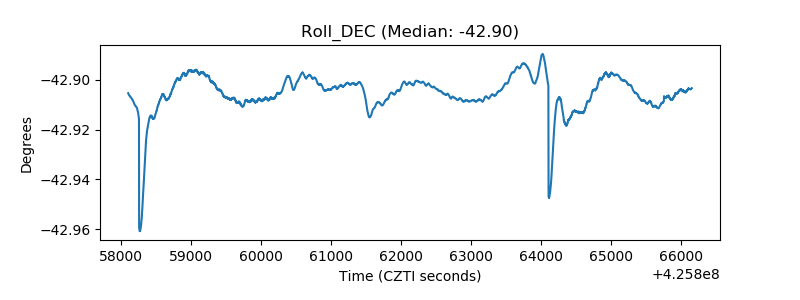 |
| _Roll_RA | 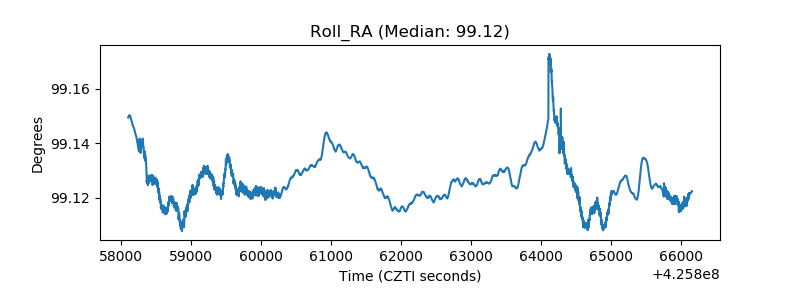 |
| Veto Counter | 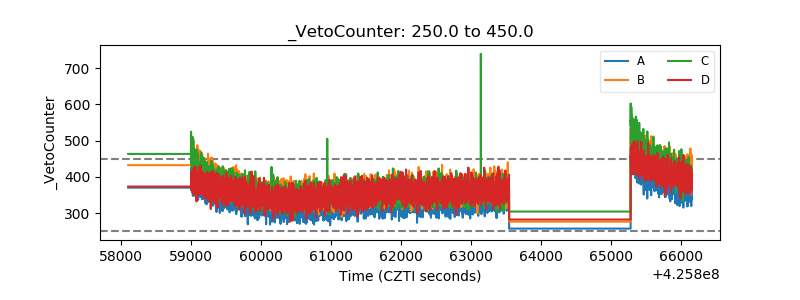 |