| Param | Original file | Final file |
|---|---|---|
| Filename | modeM0/AS1A12_099T03_9000005720_41936cztM0_level2.fits | modeM0/AS1A12_099T03_9000005720_41936cztM0_level2_quad_clean.evt |
| Size (bytes) | 576,403,200 | 78,592,320 |
| Size | 549.7 MB | 75.0 MB |
| Events in quadrant A | 4,078,566 | 588,410 |
| Events in quadrant B | 2,880,138 | 625,481 |
| Events in quadrant C | 3,311,579 | 561,376 |
| Events in quadrant D | 10,663,914 | 241,434 |
| Mode M0 | |||
|---|---|---|---|
| Quadrant | BADHDUFLAG | Total packets | Discarded packets |
| A | 0 | 15423 | 3 |
| B | 0 | 11903 | 2 |
| C | 0 | 12824 | 2 |
| D | 0 | 35229 | 2 |
| Mode SS | |||
|---|---|---|---|
| Quadrant | BADHDUFLAG | Total packets | Discarded packets |
| A | 0 | 106 | 0 |
| B | 0 | 106 | 0 |
| C | 0 | 106 | 0 |
| D | 0 | 106 | 0 |
| Mode M9 | |||
|---|---|---|---|
| Quadrant | BADHDUFLAG | Total packets | Discarded packets |
| A | 0 | 20 | 0 |
| B | 0 | 20 | 0 |
| C | 0 | 20 | 0 |
| D | 0 | 21 | 0 |
| Quadrant | Total seconds | Saturated seconds | Saturation percentage |
|---|---|---|---|
| A | 5180 | 281 | 5.424710% |
| B | 5180 | 115 | 2.220077% |
| C | 5180 | 276 | 5.328185% |
| D | 5180 | 3172 | 61.235521% |
Noise dominated data is calculated using 1-second bins in cleaned event files. If a bin has >2000 counts, and if more than 50% of those come from <1% of pixels, then it is considered to be noise-dominated and hence unusable.
| Quadrant | # 1 sec bins | Bins with >0 counts | Bins with >2000 counts | High rate bins dominated by noise | Noise dominated (total time) | Noise dominated (detector-on time) | Marked lightcurve |
|---|---|---|---|---|---|---|---|
| A | 7063 | 5181 | 198 | 198 | 2.80% | 3.82% | 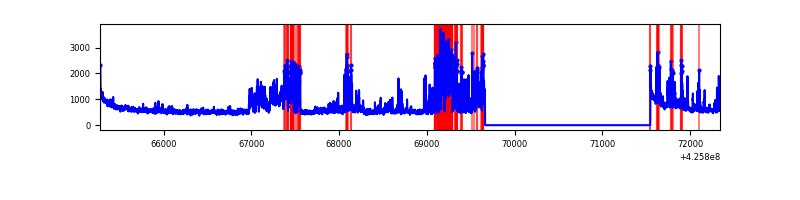 |
| B | 7063 | 5181 | 70 | 70 | 0.99% | 1.35% | 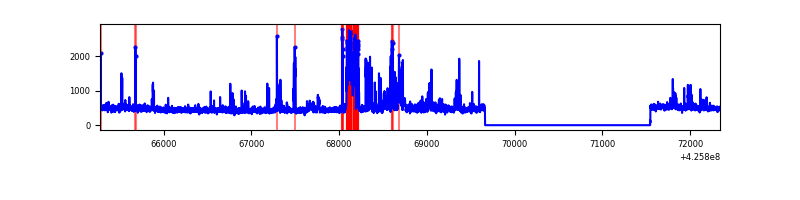 |
| C | 7063 | 5181 | 265 | 265 | 3.75% | 5.11% | 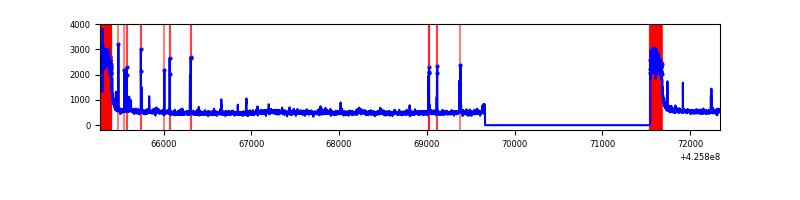 |
| D | 7063 | 5181 | 3260 | 3260 | 46.16% | 62.92% | 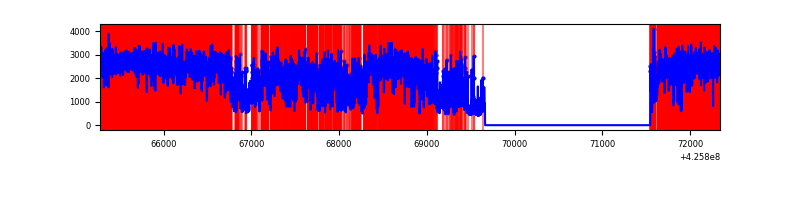 |
Top three noisy pixels from each quadrant. If the there are fewer than three noisy pixels in the level2.evt file, extra rows are filled as -1
| Pixel properties | Quadrant properties | ||||||
|---|---|---|---|---|---|---|---|
| Quadrant | DetID | PixID | Counts | Sigma | Mean | Median | Sigma |
| A | 14 | 24 | 1297440 | 11209.25 | 576 | 564 | 115.7 |
| A | 10 | 83 | 504508 | 4355.72 | 576 | 564 | 115.7 |
| A | 15 | 223 | 33629 | 285.79 | 576 | 564 | 115.7 |
| B | 0 | 229 | 546856 | 4865.91 | 582 | 566 | 112.3 |
| B | 5 | 255 | 28729 | 250.85 | 582 | 566 | 112.3 |
| B | 0 | 190 | 15400 | 132.13 | 582 | 566 | 112.3 |
| C | 0 | 10 | 806266 | 6262.25 | 556 | 560 | 128.7 |
| C | 15 | 214 | 206061 | 1597.23 | 556 | 560 | 128.7 |
| C | 4 | 254 | 122525 | 947.96 | 556 | 560 | 128.7 |
| D | 12 | 79 | 8034023 | 77573.94 | 424 | 412 | 103.6 |
| D | 13 | 249 | 661304 | 6381.69 | 424 | 412 | 103.6 |
| D | 2 | 249 | 130492 | 1256.07 | 424 | 412 | 103.6 |
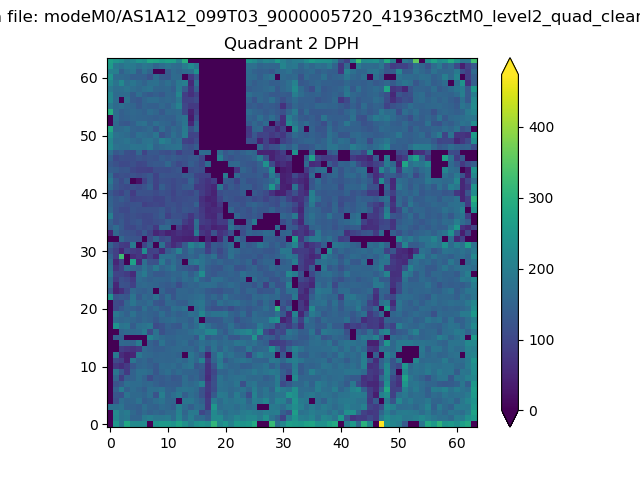
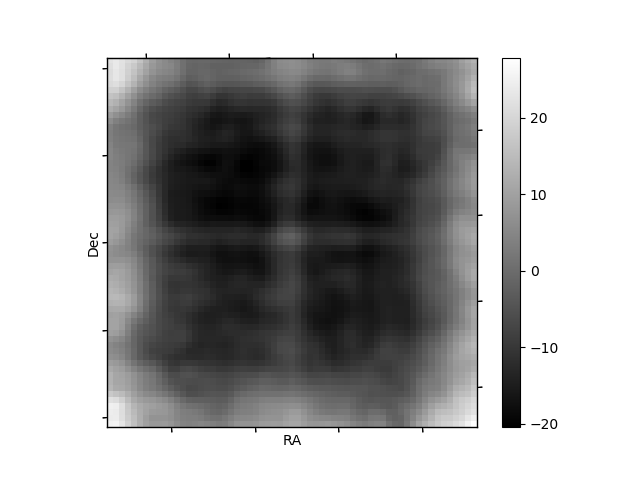
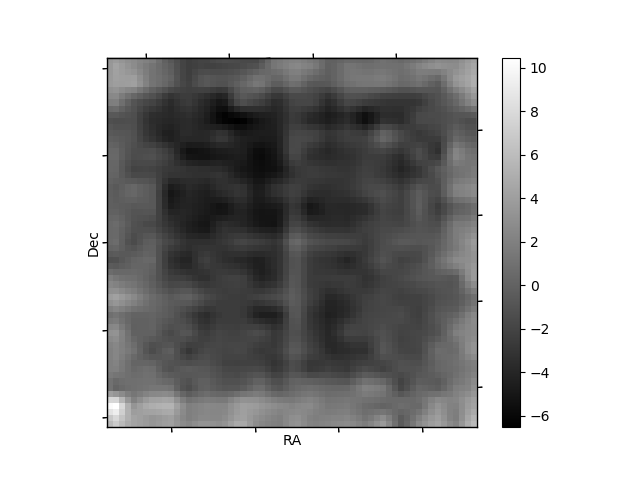
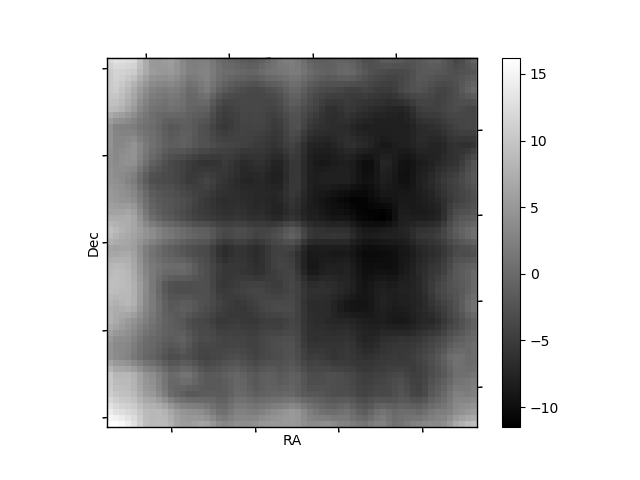
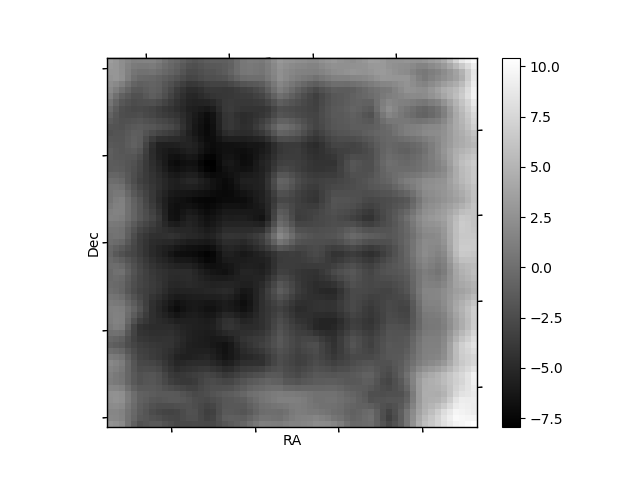
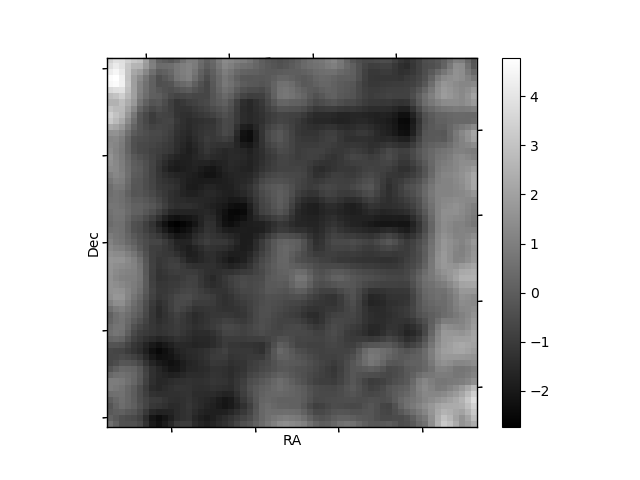
Histogram calculated using DETX and DETY for each event in the final _common_clean file
| Quadrant A | 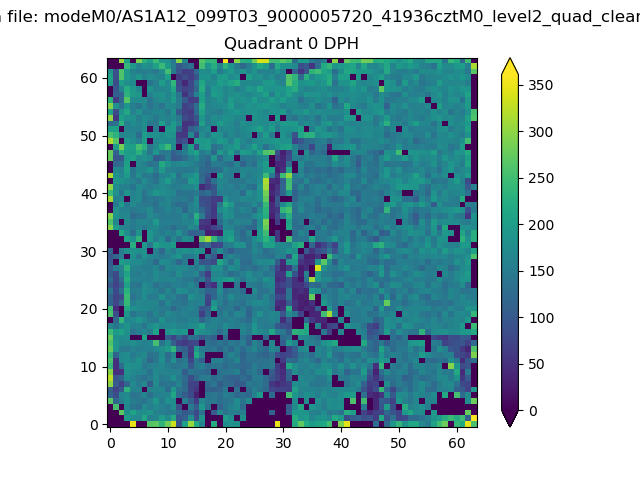 |
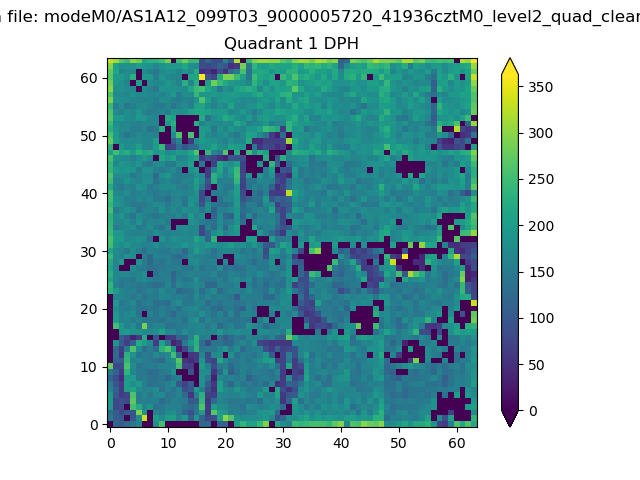 |
Quadrant B |
|---|---|---|---|
| Quadrant D | 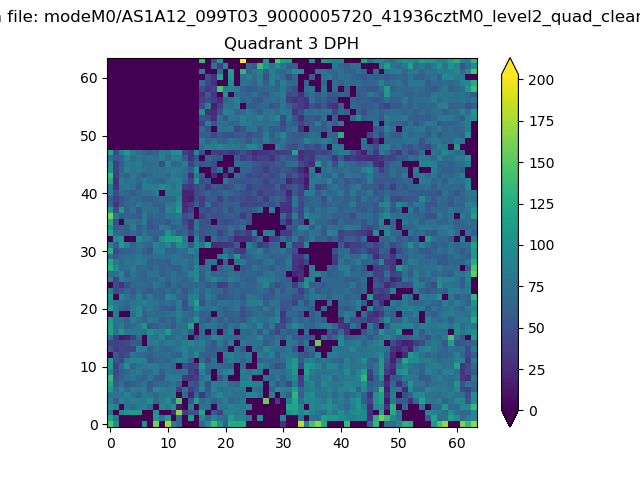 |
 |
Quadrant C |
| Plot type | Count rate plots | Images |
|---|---|---|
| Comparison with Poisson distribution Blue bars denote a histogram of data divided into 1 sec bins. Red curve is a Poisson curve with rate = median count rate of data. |
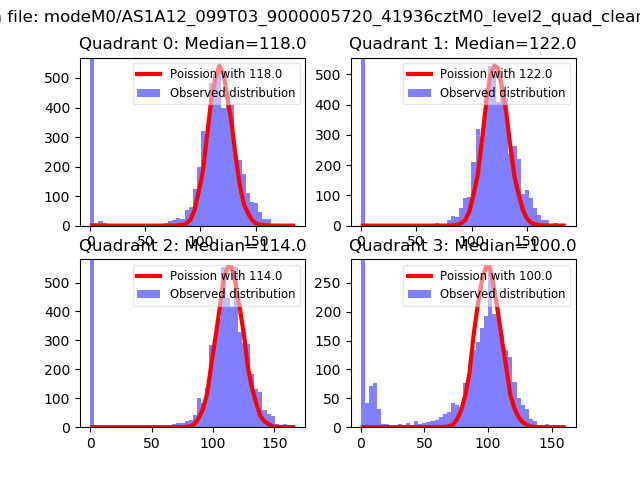 |
 |
| Quadrant-wise count rates Data is divided into 100 sec bins |
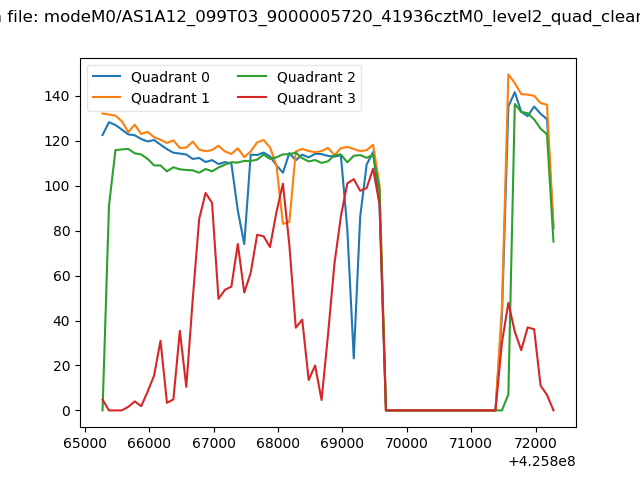 |
|
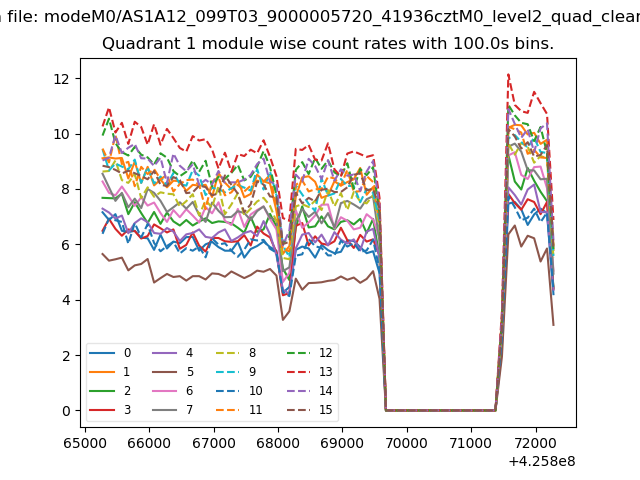
| Module-wise count rates for Quadrant A Data is divided into 100 sec bins |
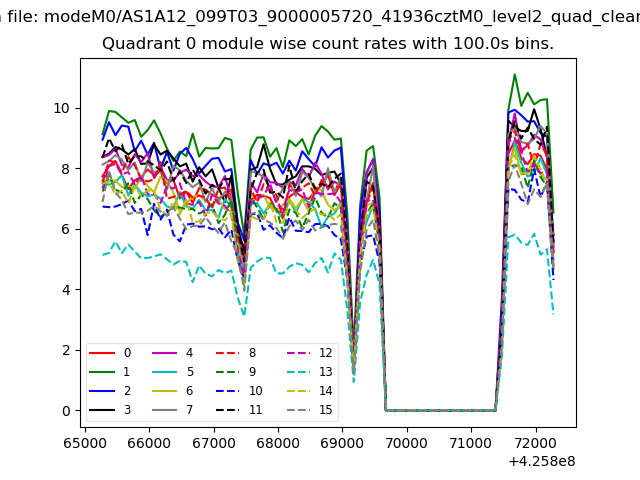 |
 |
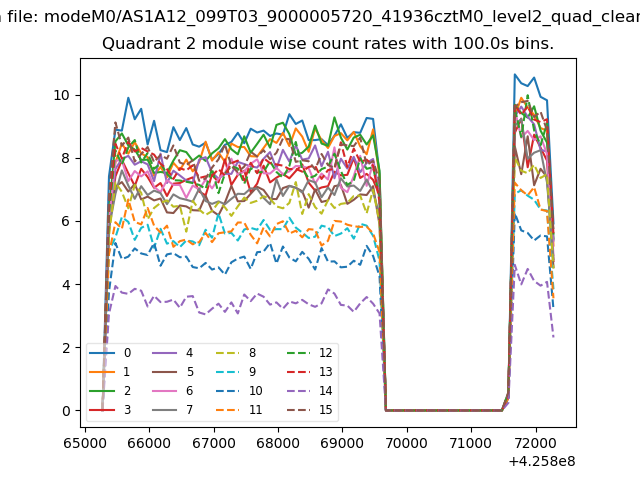
| Module-wise count rates for Quadrant B Data is divided into 100 sec bins |
 |
 |
| Module-wise count rates for Quadrant C Data is divided into 100 sec bins |
 |
 |
| Module-wise count rates for Quadrant D Data is divided into 100 sec bins |
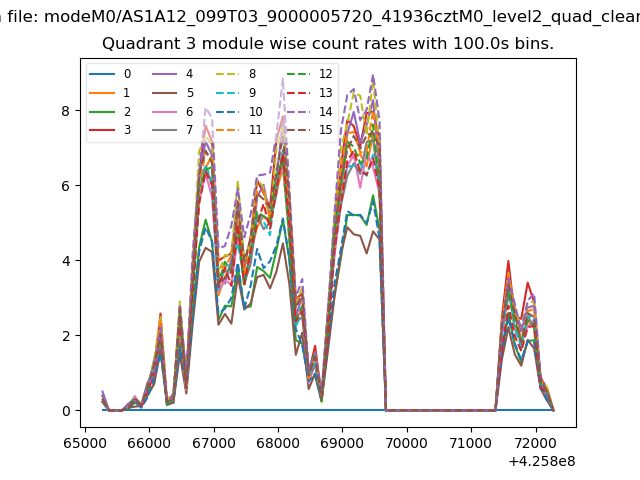 |
 |
| Parameter | Plot |
|---|---|
| CZT HV Monitor | 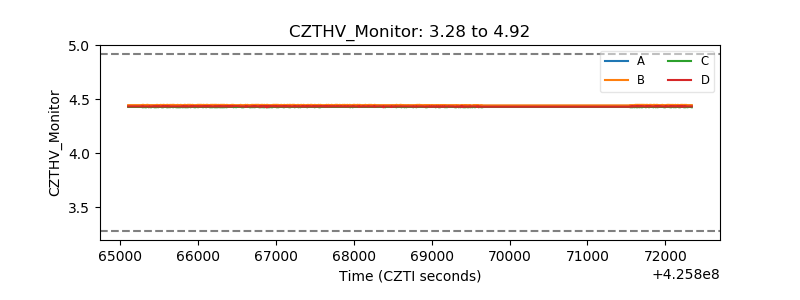 |
| D_VDD | 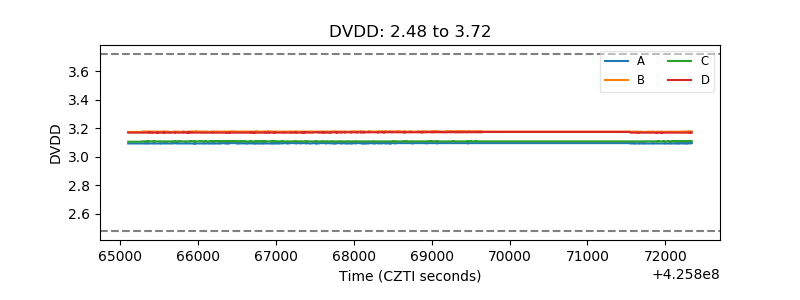 |
| Temperature 1 | 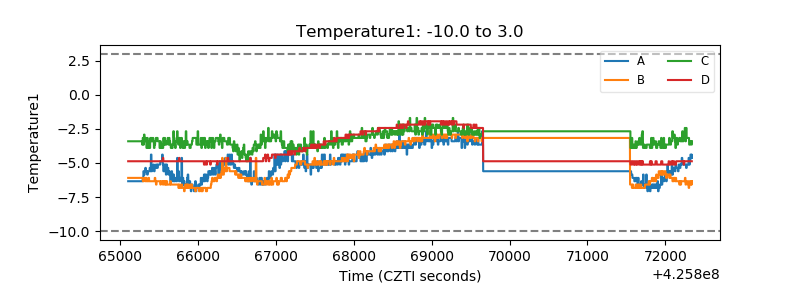 |
| Veto HV Monitor |  |
| Veto LLD | 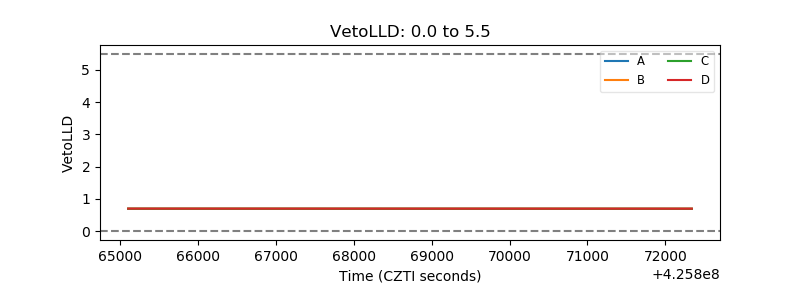 |
| Alpha Counter | 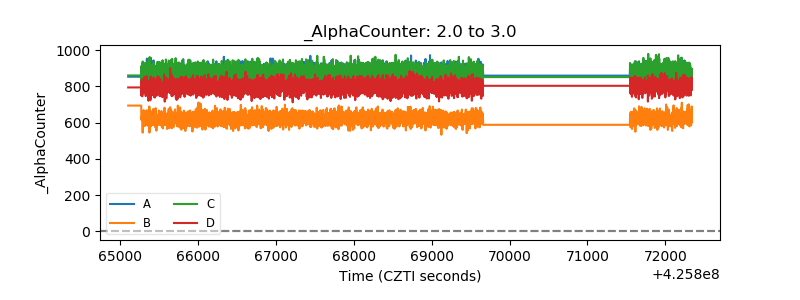 |
| _CPM_Rate | 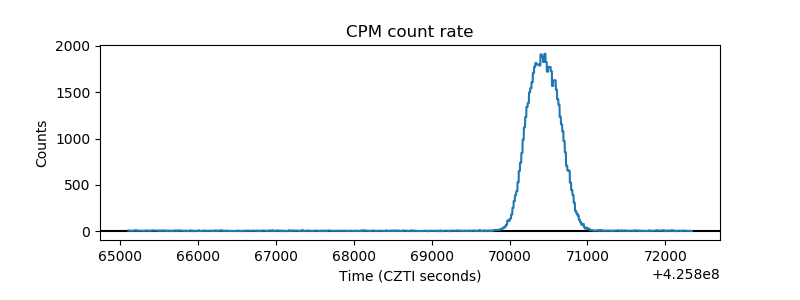 |
| CZT Counter | 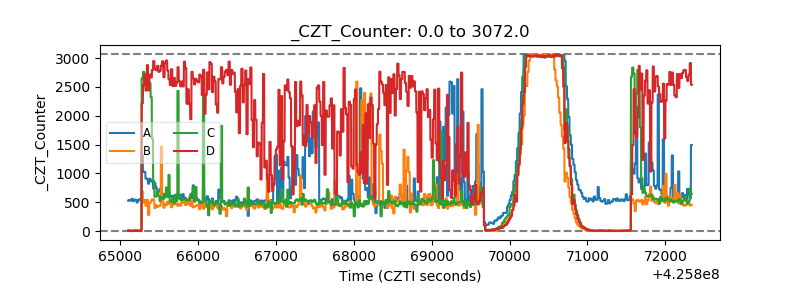 |
| +2.5 Volts monitor | 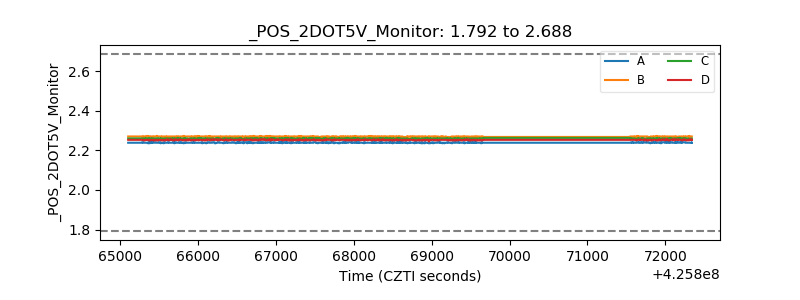 |
| +5 Volts monitor | 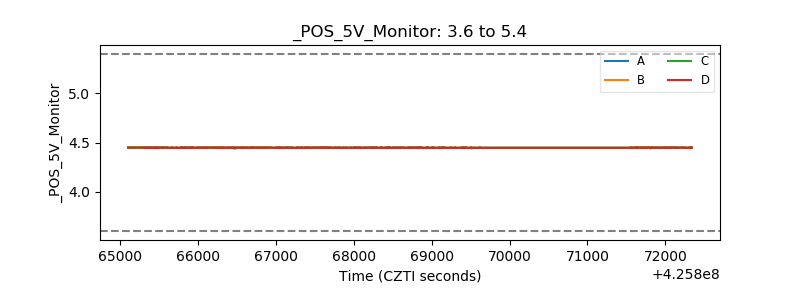 |
| _ROLL_ROT | 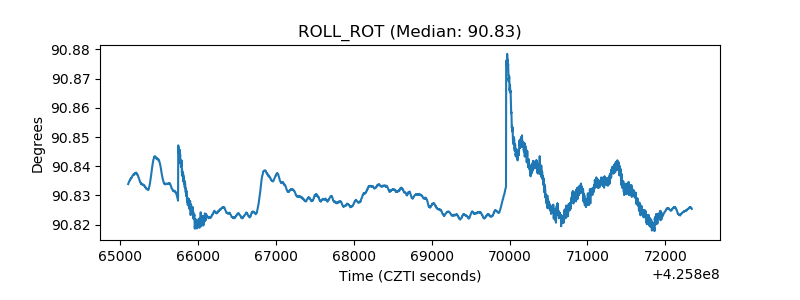 |
| _Roll_DEC | 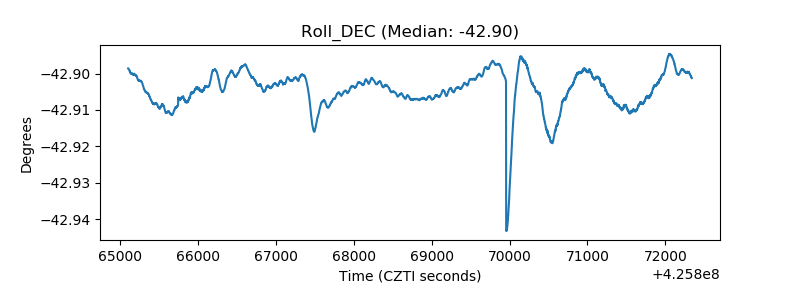 |
| _Roll_RA | 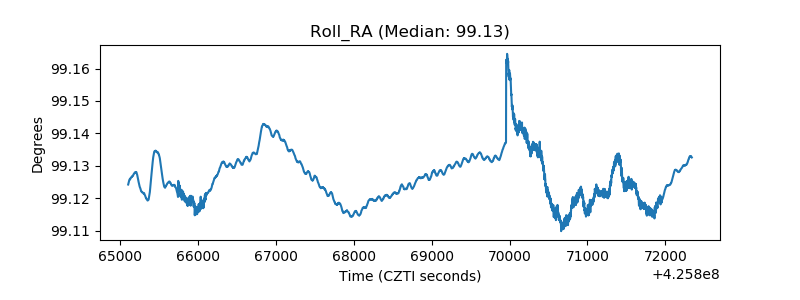 |
| Veto Counter | 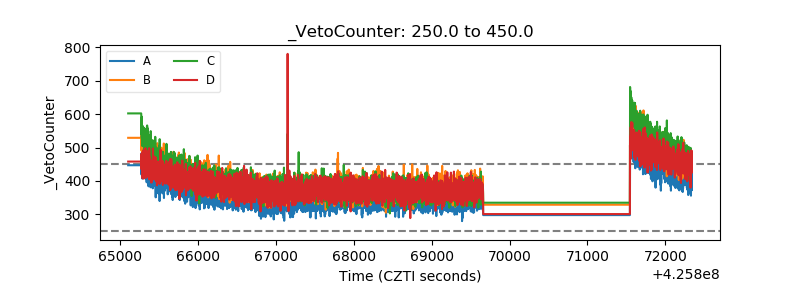 |