| Param | Original file | Final file |
|---|---|---|
| Filename | modeM0/AS1A12_099T03_9000005720_41937cztM0_level2.fits | modeM0/AS1A12_099T03_9000005720_41937cztM0_level2_quad_clean.evt |
| Size (bytes) | 610,254,720 | 78,341,760 |
| Size | 582.0 MB | 74.7 MB |
| Events in quadrant A | 4,863,820 | 581,986 |
| Events in quadrant B | 2,782,358 | 650,535 |
| Events in quadrant C | 3,206,452 | 587,316 |
| Events in quadrant D | 11,344,163 | 198,071 |
| Mode M0 | |||
|---|---|---|---|
| Quadrant | BADHDUFLAG | Total packets | Discarded packets |
| A | 0 | 17830 | 3 |
| B | 0 | 11415 | 2 |
| C | 0 | 12471 | 2 |
| D | 0 | 37093 | 2 |
| Mode SS | |||
|---|---|---|---|
| Quadrant | BADHDUFLAG | Total packets | Discarded packets |
| A | 0 | 102 | 0 |
| B | 0 | 102 | 0 |
| C | 0 | 102 | 0 |
| D | 0 | 102 | 0 |
| Mode M9 | |||
|---|---|---|---|
| Quadrant | BADHDUFLAG | Total packets | Discarded packets |
| A | 0 | 29 | 0 |
| B | 0 | 29 | 0 |
| C | 0 | 29 | 0 |
| D | 0 | 30 | 0 |
| Quadrant | Total seconds | Saturated seconds | Saturation percentage |
|---|---|---|---|
| A | 5058 | 554 | 10.952946% |
| B | 5058 | 41 | 0.810597% |
| C | 5058 | 267 | 5.278766% |
| D | 5058 | 3613 | 71.431396% |
Noise dominated data is calculated using 1-second bins in cleaned event files. If a bin has >2000 counts, and if more than 50% of those come from <1% of pixels, then it is considered to be noise-dominated and hence unusable.
| Quadrant | # 1 sec bins | Bins with >0 counts | Bins with >2000 counts | High rate bins dominated by noise | Noise dominated (total time) | Noise dominated (detector-on time) | Marked lightcurve |
|---|---|---|---|---|---|---|---|
| A | 7061 | 5059 | 491 | 491 | 6.95% | 9.71% | 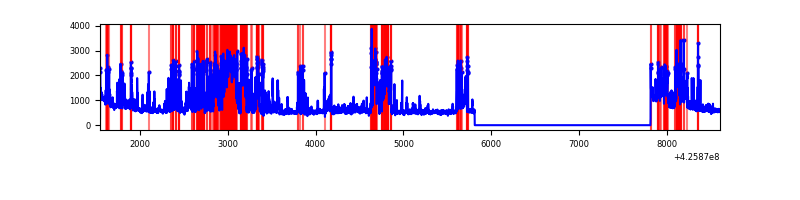 |
| B | 7061 | 5059 | 33 | 33 | 0.47% | 0.65% | 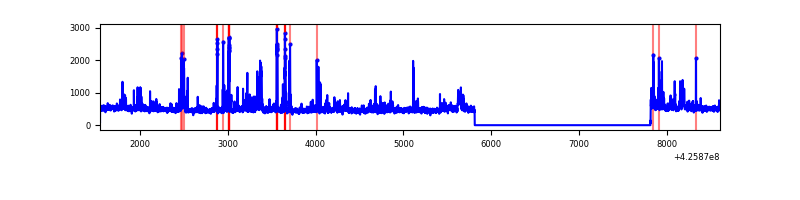 |
| C | 7061 | 5059 | 251 | 251 | 3.55% | 4.96% | 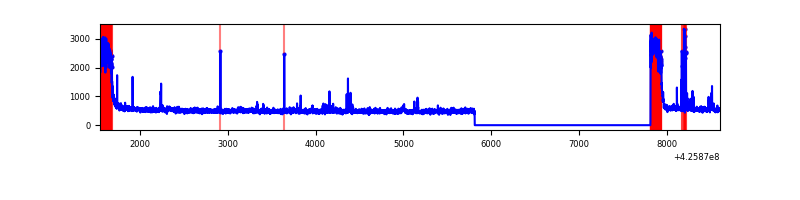 |
| D | 7061 | 5059 | 3609 | 3609 | 51.11% | 71.34% | 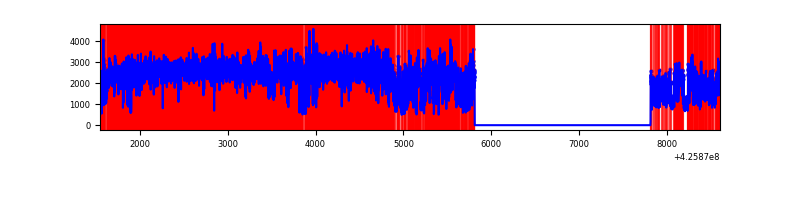 |
Top three noisy pixels from each quadrant. If the there are fewer than three noisy pixels in the level2.evt file, extra rows are filled as -1
| Pixel properties | Quadrant properties | ||||||
|---|---|---|---|---|---|---|---|
| Quadrant | DetID | PixID | Counts | Sigma | Mean | Median | Sigma |
| A | 14 | 24 | 2064907 | 17724.03 | 574 | 564 | 116.5 |
| A | 10 | 83 | 497172 | 4263.77 | 574 | 564 | 116.5 |
| A | 15 | 223 | 70210 | 597.97 | 574 | 564 | 116.5 |
| B | 0 | 229 | 219633 | 1946.14 | 590 | 573 | 112.6 |
| B | 5 | 255 | 159164 | 1408.93 | 590 | 573 | 112.6 |
| B | 0 | 245 | 73709 | 649.74 | 590 | 573 | 112.6 |
| C | 0 | 10 | 696796 | 5372.68 | 566 | 571 | 129.6 |
| C | 15 | 214 | 202044 | 1554.74 | 566 | 571 | 129.6 |
| C | 14 | 254 | 59136 | 451.94 | 566 | 571 | 129.6 |
| D | 12 | 79 | 9313447 | 97246.95 | 391 | 380 | 95.8 |
| D | 13 | 249 | 328393 | 3425.11 | 391 | 380 | 95.8 |
| D | 1 | 52 | 53198 | 551.52 | 391 | 380 | 95.8 |
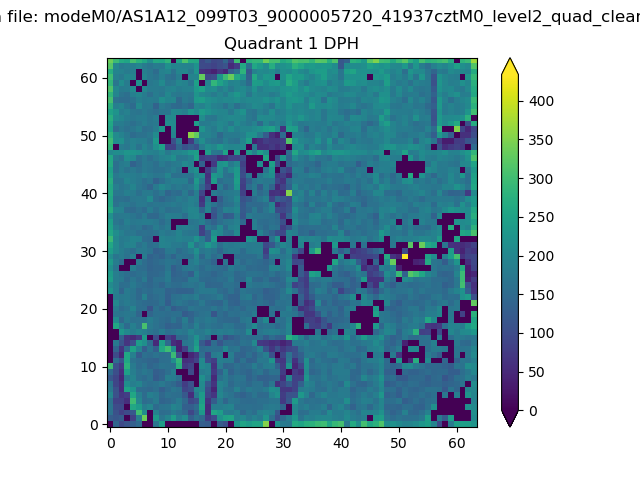
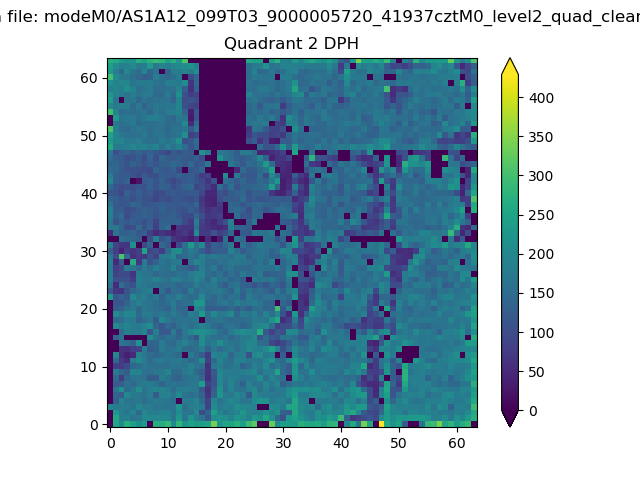
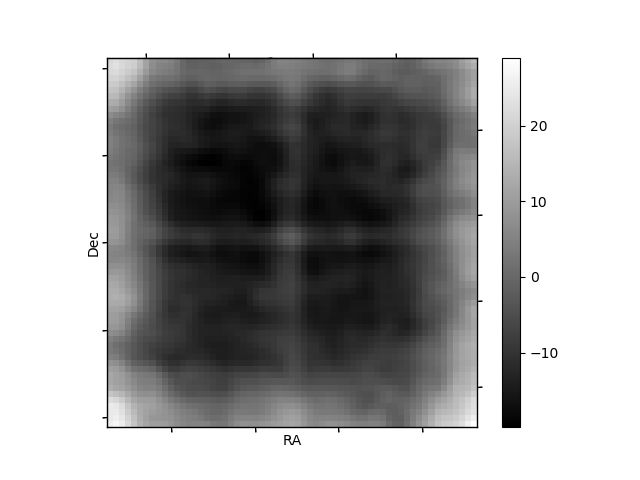
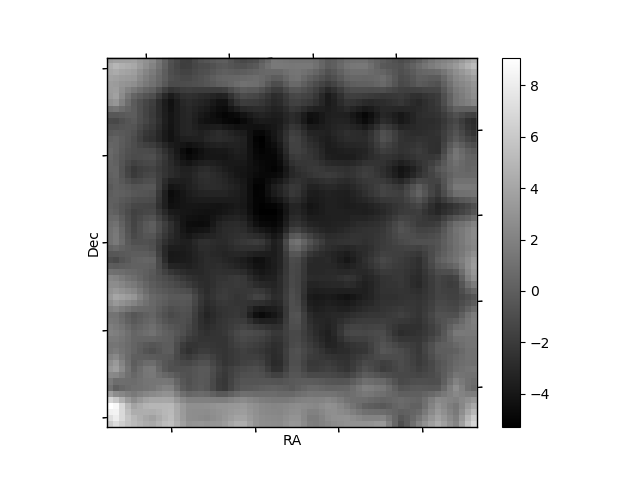
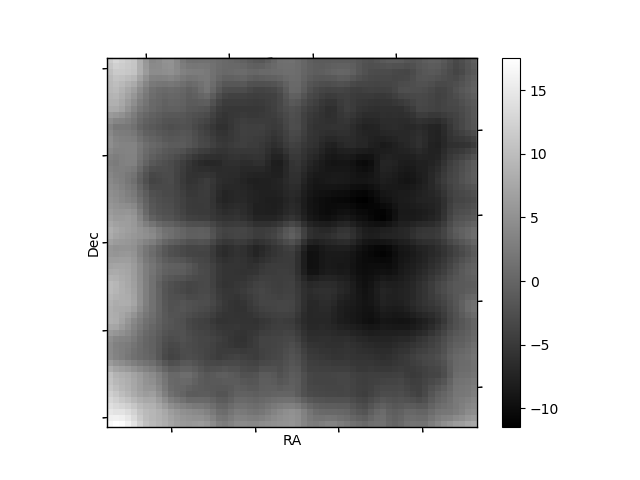
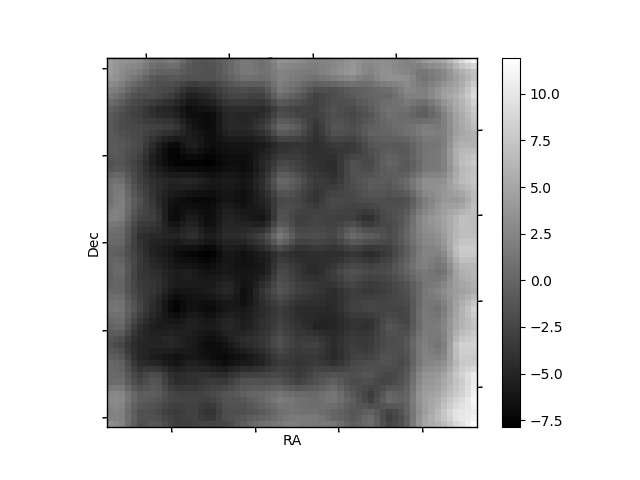
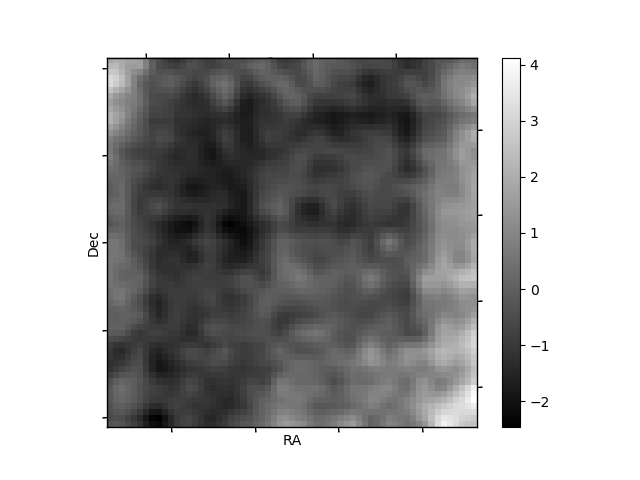
Histogram calculated using DETX and DETY for each event in the final _common_clean file
| Quadrant A | 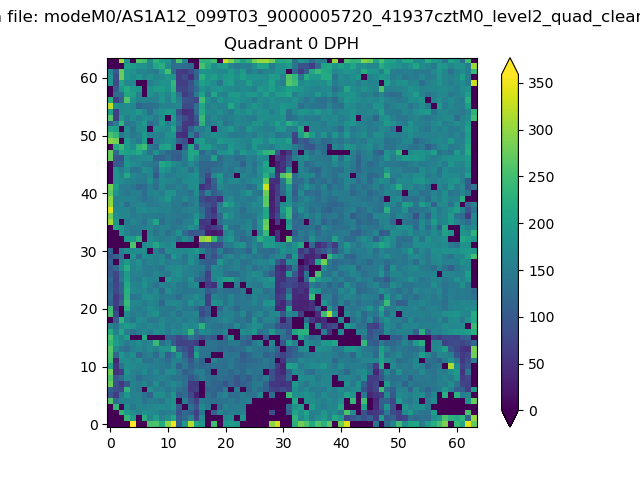 |
 |
Quadrant B |
|---|---|---|---|
| Quadrant D | 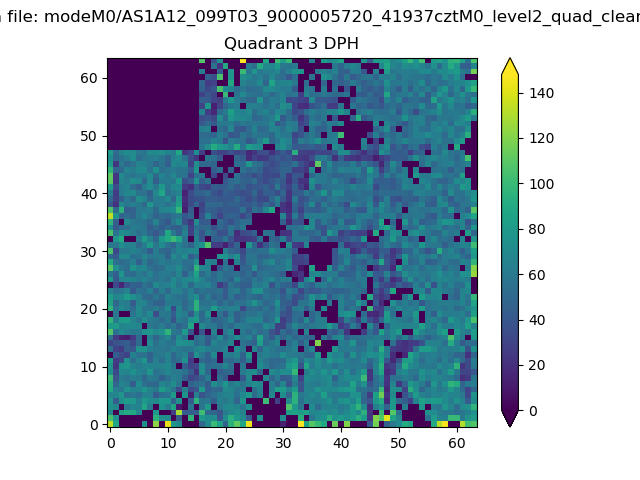 |
 |
Quadrant C |
| Plot type | Count rate plots | Images |
|---|---|---|
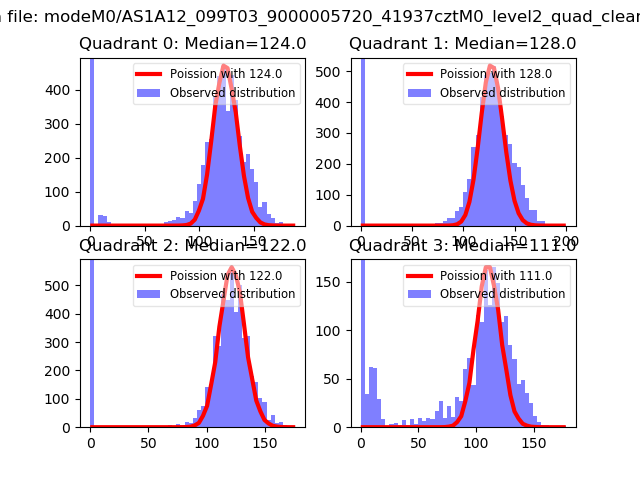
| Comparison with Poisson distribution Blue bars denote a histogram of data divided into 1 sec bins. Red curve is a Poisson curve with rate = median count rate of data. |
 |
 |
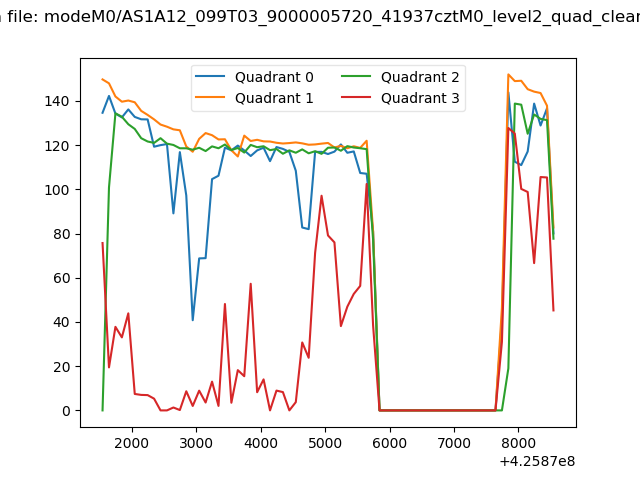
| Quadrant-wise count rates Data is divided into 100 sec bins |
 |
|
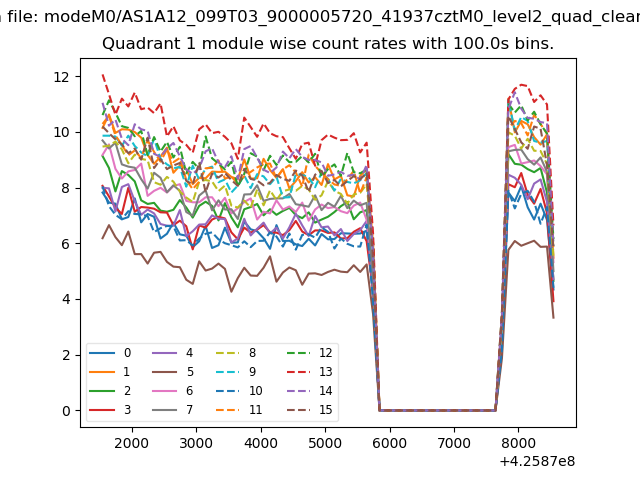
| Module-wise count rates for Quadrant A Data is divided into 100 sec bins |
 |
 |
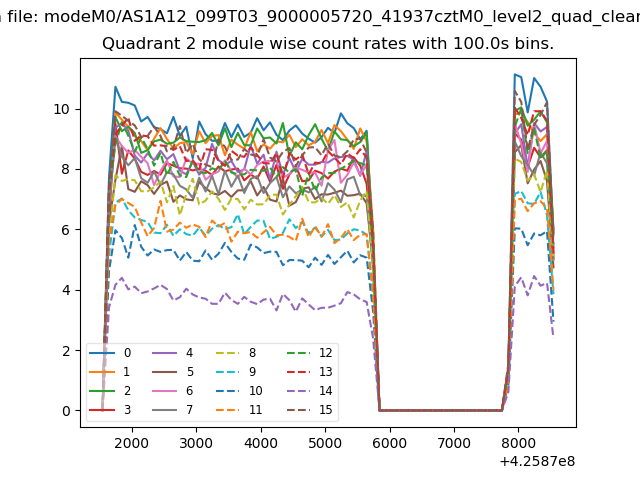
| Module-wise count rates for Quadrant B Data is divided into 100 sec bins |
 |
 |
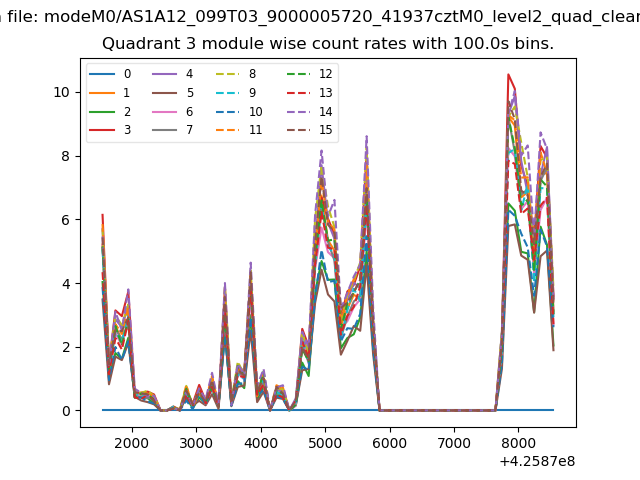
| Module-wise count rates for Quadrant C Data is divided into 100 sec bins |
 |
 |
| Module-wise count rates for Quadrant D Data is divided into 100 sec bins |
 |
 |
| Parameter | Plot |
|---|---|
| CZT HV Monitor |  |
| D_VDD |  |
| Temperature 1 | 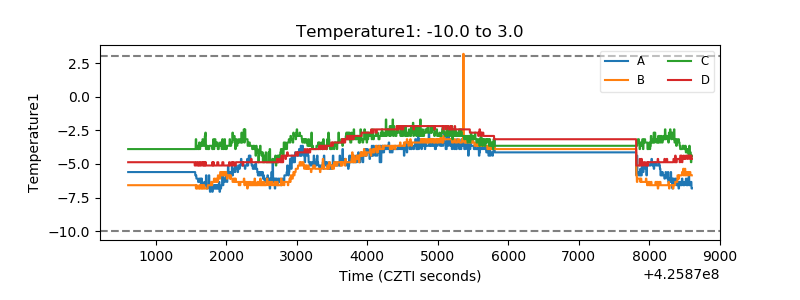 |
| Veto HV Monitor | 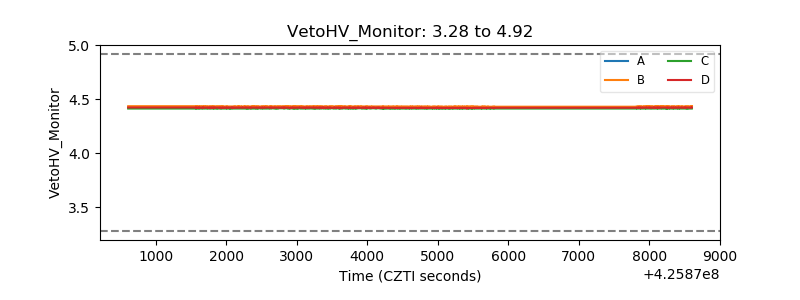 |
| Veto LLD | 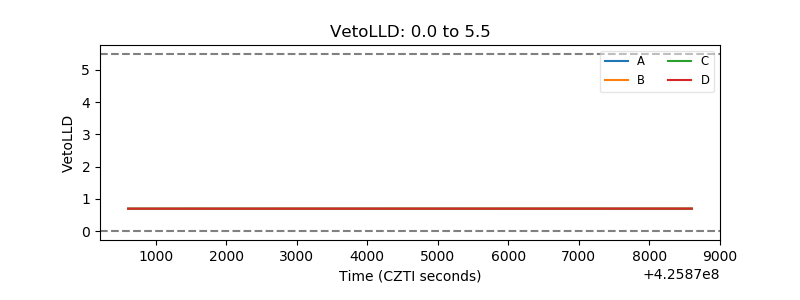 |
| Alpha Counter | 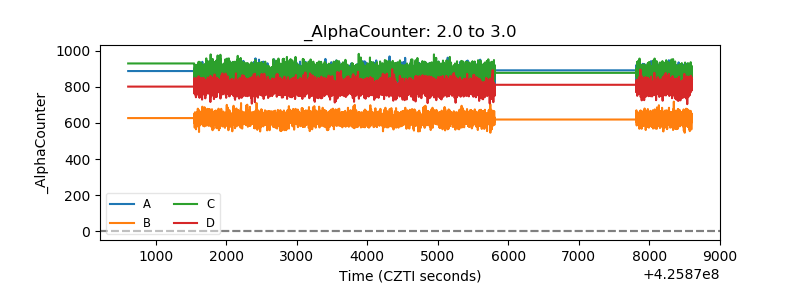 |
| _CPM_Rate | 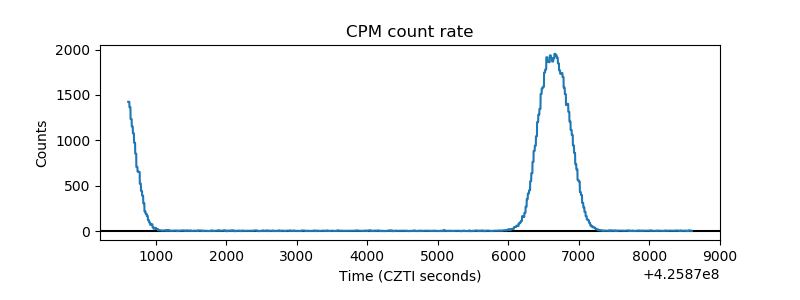 |
| CZT Counter | 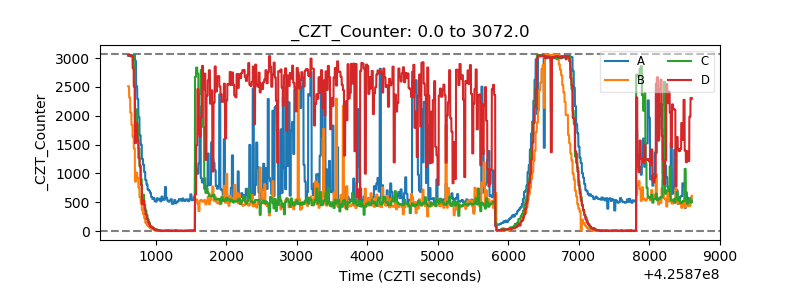 |
| +2.5 Volts monitor | 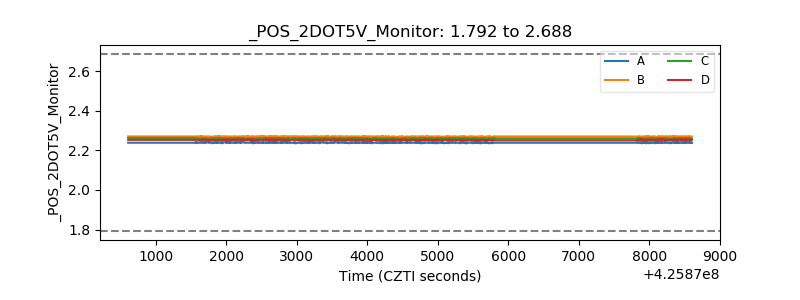 |
| +5 Volts monitor | 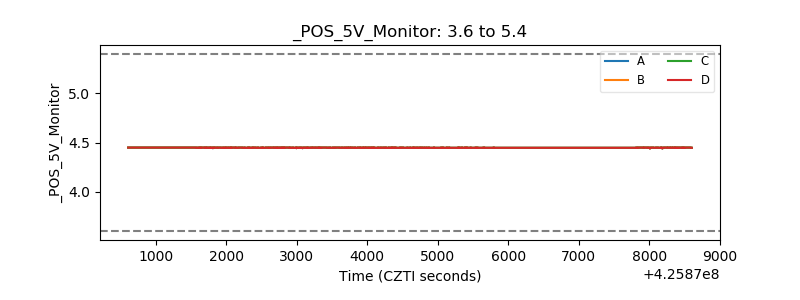 |
| _ROLL_ROT | 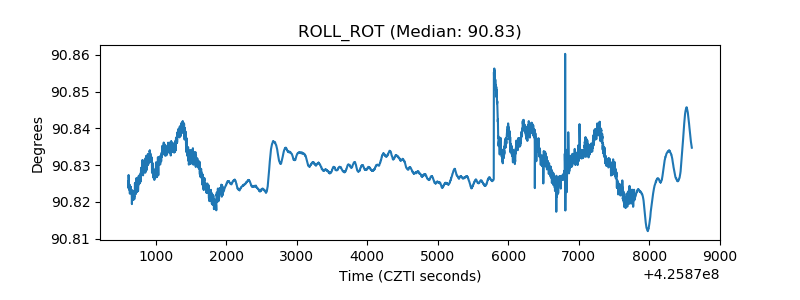 |
| _Roll_DEC | 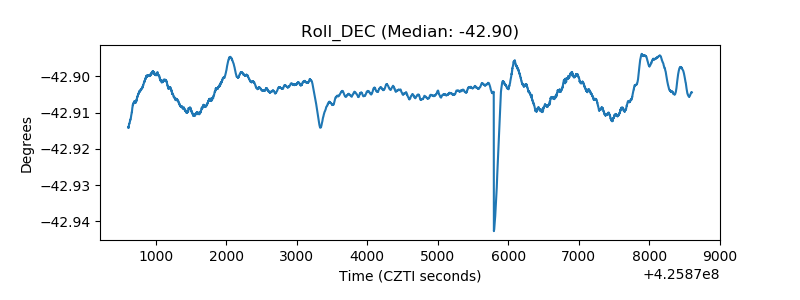 |
| _Roll_RA | 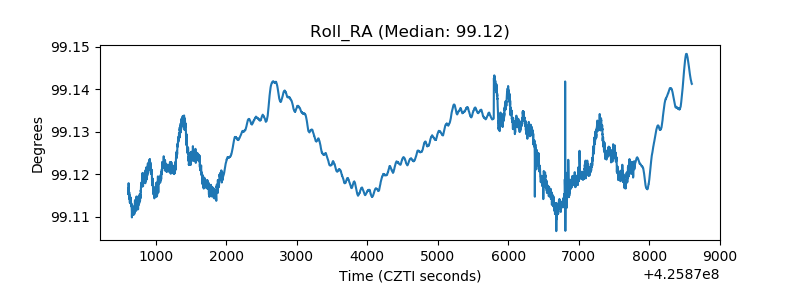 |
| Veto Counter | 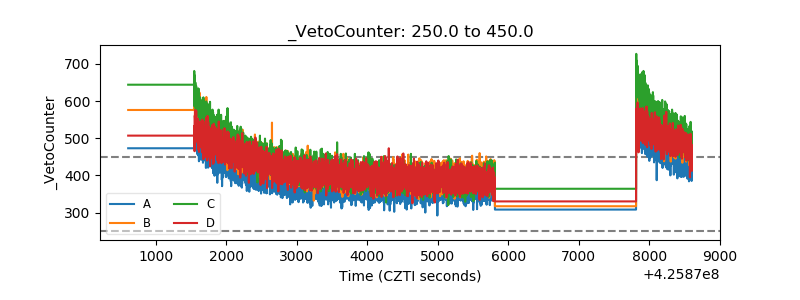 |