| Param | Original file | Final file |
|---|---|---|
| Filename | modeM0/AS1A12_099T03_9000005720_41939cztM0_level2.fits | modeM0/AS1A12_099T03_9000005720_41939cztM0_level2_quad_clean.evt |
| Size (bytes) | 394,706,880 | 83,237,760 |
| Size | 376.4 MB | 79.4 MB |
| Events in quadrant A | 3,385,241 | 590,633 |
| Events in quadrant B | 2,897,389 | 599,426 |
| Events in quadrant C | 3,364,515 | 556,902 |
| Events in quadrant D | 4,586,831 | 434,357 |
| Mode M0 | |||
|---|---|---|---|
| Quadrant | BADHDUFLAG | Total packets | Discarded packets |
| A | 0 | 13199 | 2 |
| B | 0 | 11713 | 2 |
| C | 0 | 13027 | 2 |
| D | 0 | 16924 | 3 |
| Mode SS | |||
|---|---|---|---|
| Quadrant | BADHDUFLAG | Total packets | Discarded packets |
| A | 0 | 98 | 0 |
| B | 0 | 98 | 0 |
| C | 0 | 98 | 0 |
| D | 0 | 98 | 0 |
| Mode M9 | |||
|---|---|---|---|
| Quadrant | BADHDUFLAG | Total packets | Discarded packets |
| A | 0 | 25 | 0 |
| B | 0 | 26 | 0 |
| C | 0 | 26 | 0 |
| D | 0 | 26 | 0 |
| Quadrant | Total seconds | Saturated seconds | Saturation percentage |
|---|---|---|---|
| A | 4874 | 117 | 2.400492% |
| B | 4874 | 154 | 3.159622% |
| C | 4798 | 262 | 5.460609% |
| D | 4812 | 972 | 20.199501% |
Noise dominated data is calculated using 1-second bins in cleaned event files. If a bin has >2000 counts, and if more than 50% of those come from <1% of pixels, then it is considered to be noise-dominated and hence unusable.
| Quadrant | # 1 sec bins | Bins with >0 counts | Bins with >2000 counts | High rate bins dominated by noise | Noise dominated (total time) | Noise dominated (detector-on time) | Marked lightcurve |
|---|---|---|---|---|---|---|---|
| A | 6997 | 4875 | 91 | 91 | 1.30% | 1.87% | 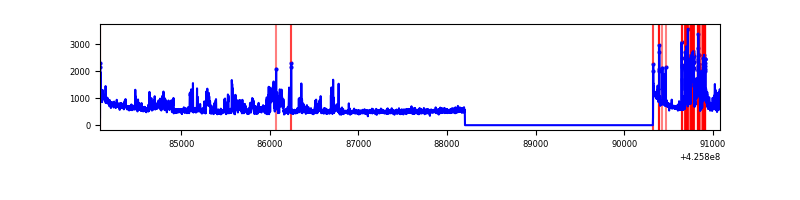 |
| B | 6997 | 4875 | 132 | 132 | 1.89% | 2.71% | 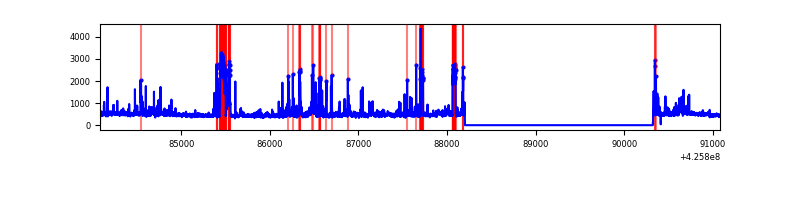 |
| C | 6997 | 4799 | 261 | 261 | 3.73% | 5.44% | 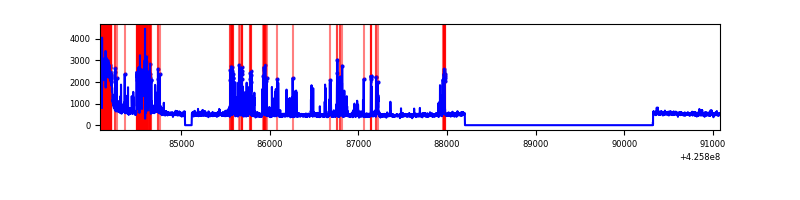 |
| D | 6997 | 4814 | 951 | 951 | 13.59% | 19.75% | 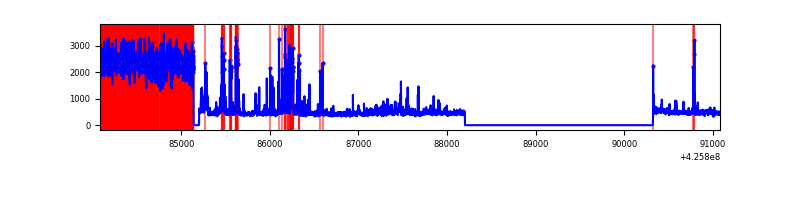 |
Top three noisy pixels from each quadrant. If the there are fewer than three noisy pixels in the level2.evt file, extra rows are filled as -1
| Pixel properties | Quadrant properties | ||||||
|---|---|---|---|---|---|---|---|
| Quadrant | DetID | PixID | Counts | Sigma | Mean | Median | Sigma |
| A | 14 | 24 | 706842 | 6146.6 | 562 | 551 | 114.9 |
| A | 10 | 83 | 486116 | 4225.7 | 562 | 551 | 114.9 |
| A | 13 | 6 | 10944 | 90.45 | 562 | 551 | 114.9 |
| B | 0 | 229 | 507230 | 4838.48 | 547 | 533 | 104.7 |
| B | 5 | 255 | 185254 | 1763.91 | 547 | 533 | 104.7 |
| B | 0 | 190 | 26436 | 247.35 | 547 | 533 | 104.7 |
| C | 14 | 254 | 751505 | 6115.35 | 530 | 535 | 122.8 |
| C | 0 | 10 | 340593 | 2769.18 | 530 | 535 | 122.8 |
| C | 15 | 214 | 195773 | 1589.88 | 530 | 535 | 122.8 |
| D | 12 | 79 | 1852103 | 14936.27 | 512 | 498 | 124.0 |
| D | 13 | 249 | 531859 | 4286.31 | 512 | 498 | 124.0 |
| D | 1 | 52 | 79781 | 639.55 | 512 | 498 | 124.0 |
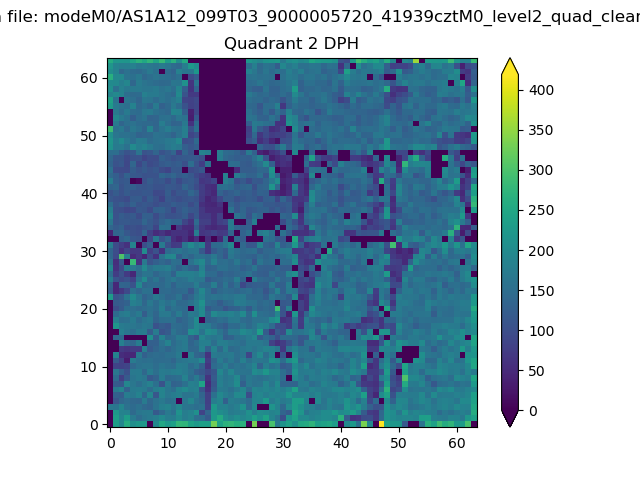
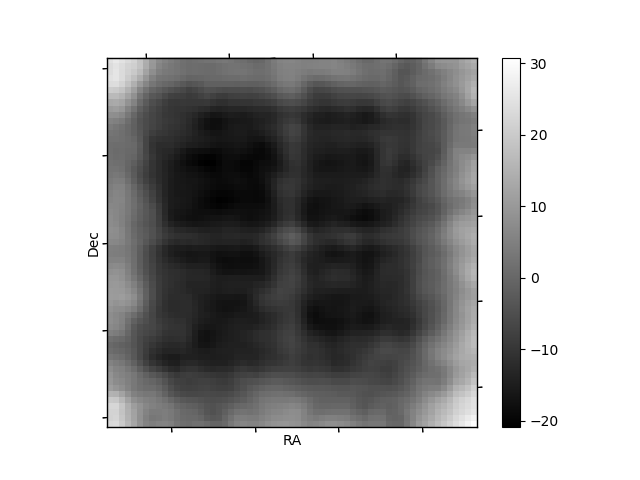
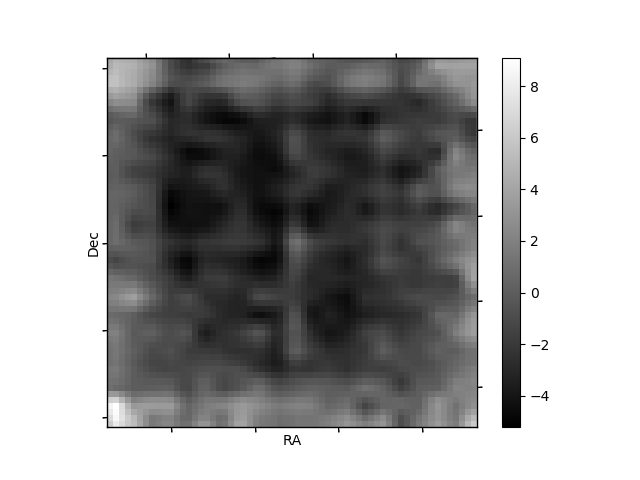
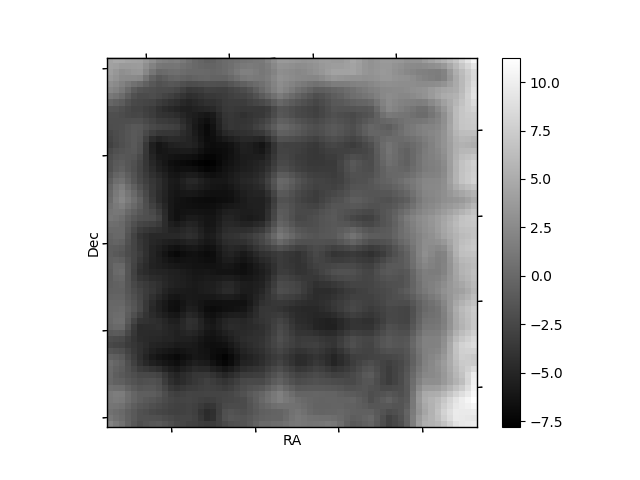
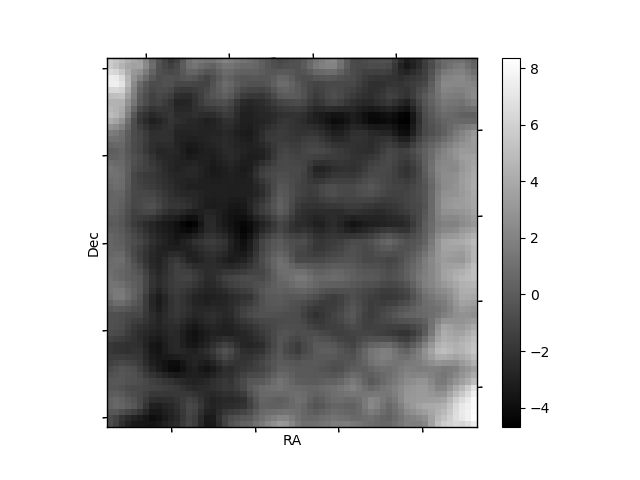
Histogram calculated using DETX and DETY for each event in the final _common_clean file
| Quadrant A | 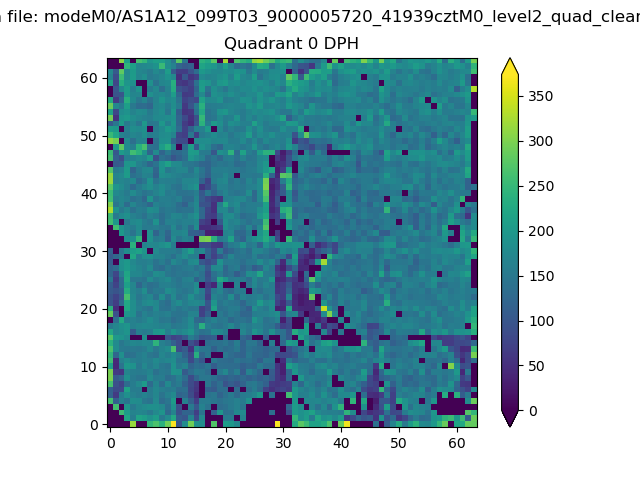 |
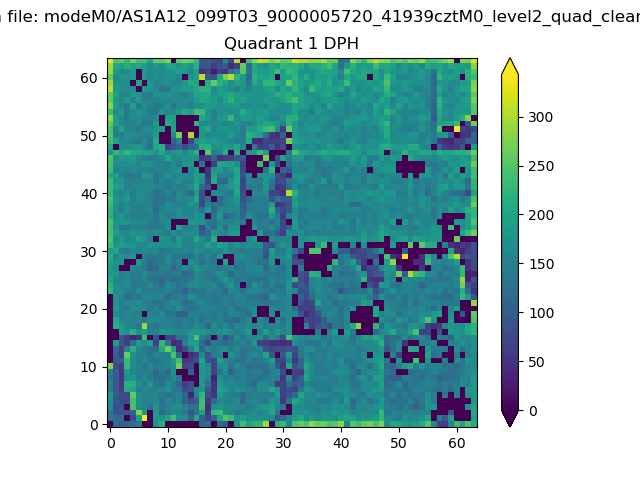 |
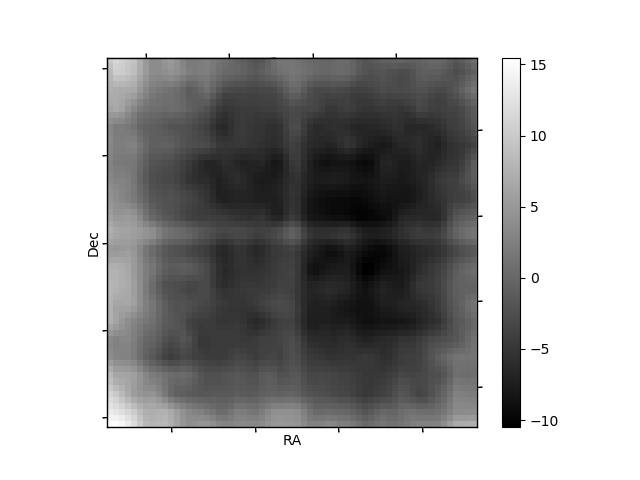
Quadrant B |
|---|---|---|---|
| Quadrant D | 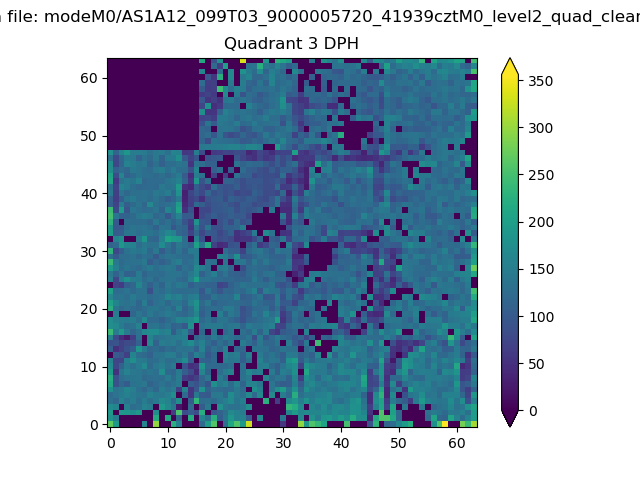 |
 |
Quadrant C |
| Plot type | Count rate plots | Images |
|---|---|---|
| Comparison with Poisson distribution Blue bars denote a histogram of data divided into 1 sec bins. Red curve is a Poisson curve with rate = median count rate of data. |
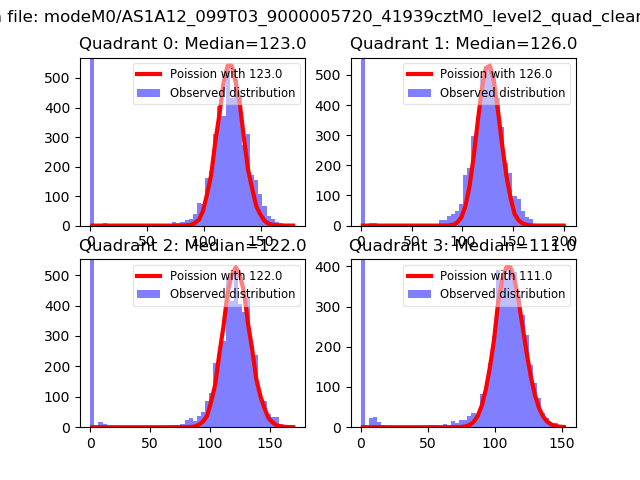 |
 |
| Quadrant-wise count rates Data is divided into 100 sec bins |
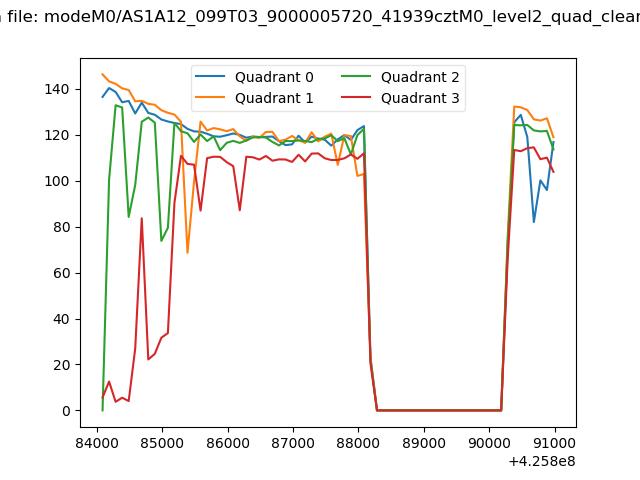 |
|
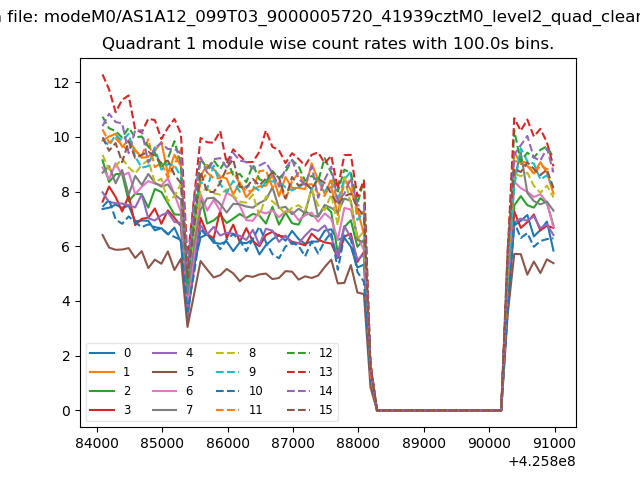
| Module-wise count rates for Quadrant A Data is divided into 100 sec bins |
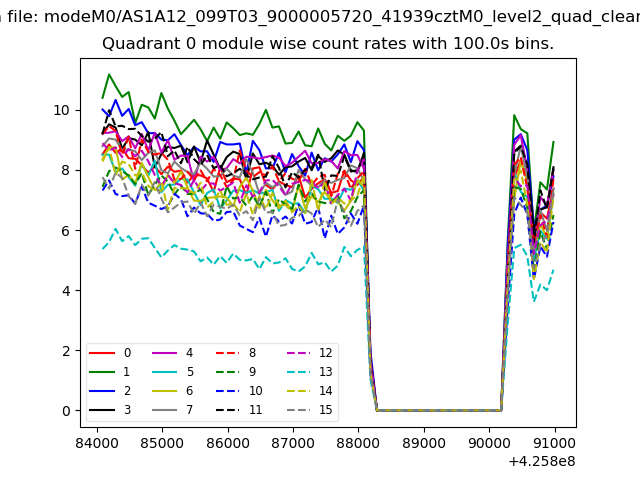 |
 |
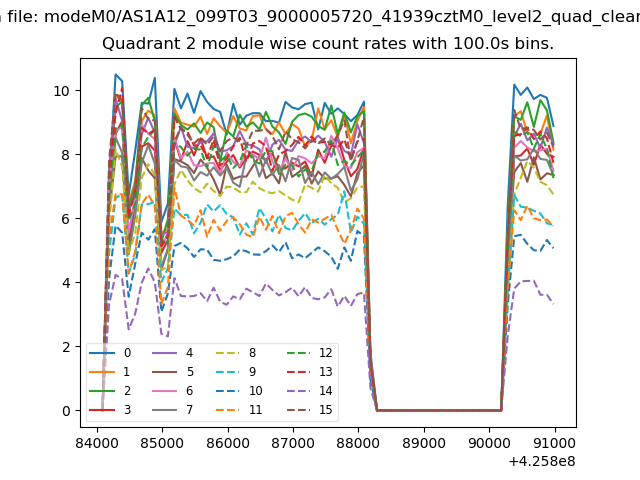
| Module-wise count rates for Quadrant B Data is divided into 100 sec bins |
 |
 |
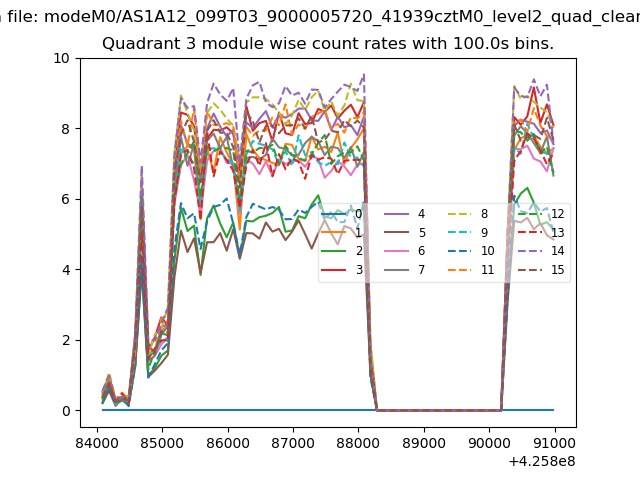
| Module-wise count rates for Quadrant C Data is divided into 100 sec bins |
 |
 |
| Module-wise count rates for Quadrant D Data is divided into 100 sec bins |
 |
 |
| Parameter | Plot |
|---|---|
| CZT HV Monitor | 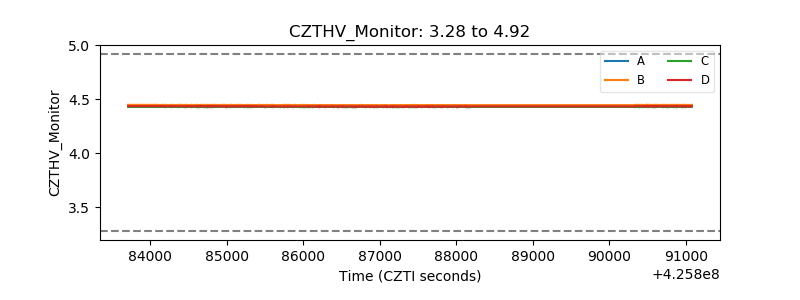 |
| D_VDD | 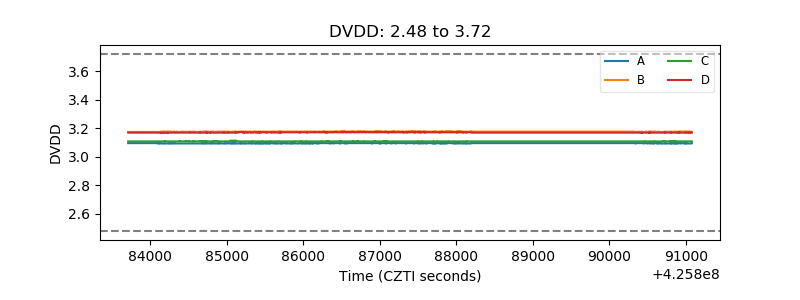 |
| Temperature 1 | 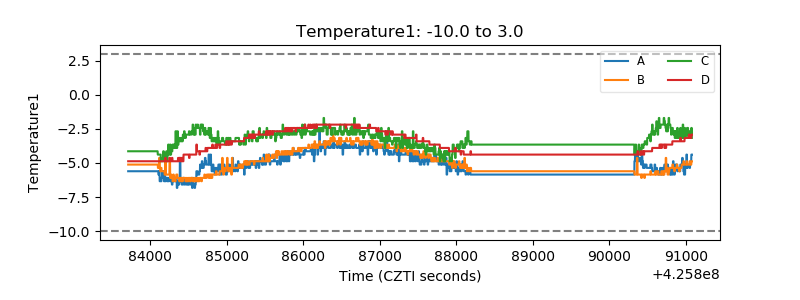 |
| Veto HV Monitor | 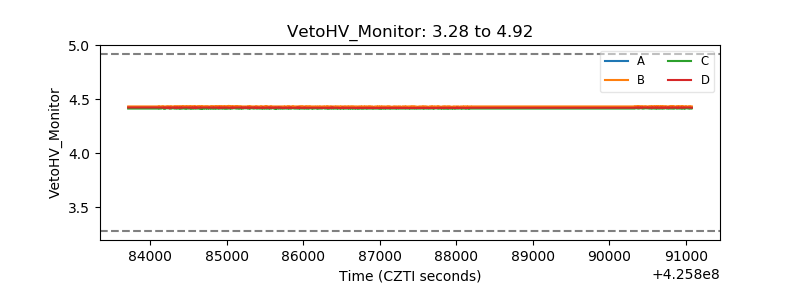 |
| Veto LLD | 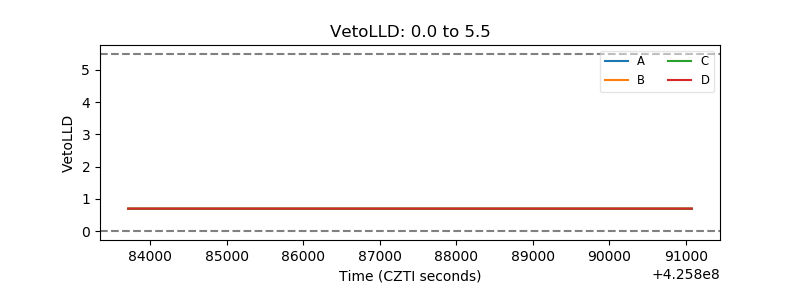 |
| Alpha Counter | 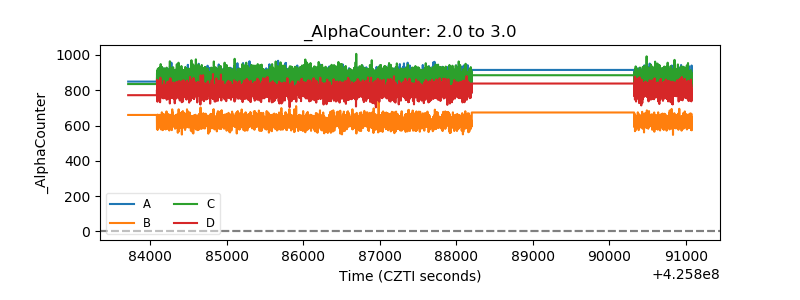 |
| _CPM_Rate | 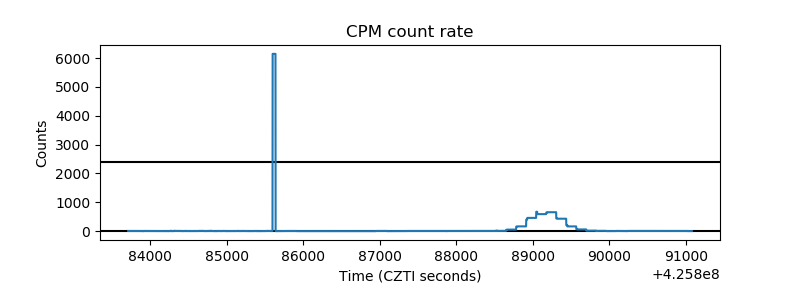 |
| CZT Counter | 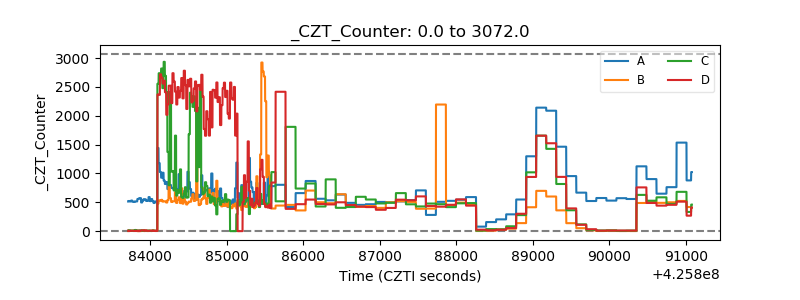 |
| +2.5 Volts monitor | 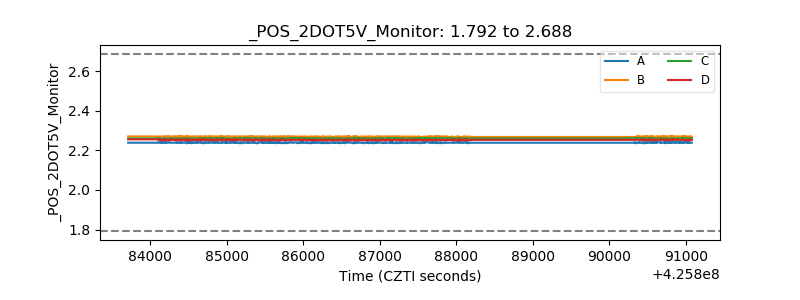 |
| +5 Volts monitor | 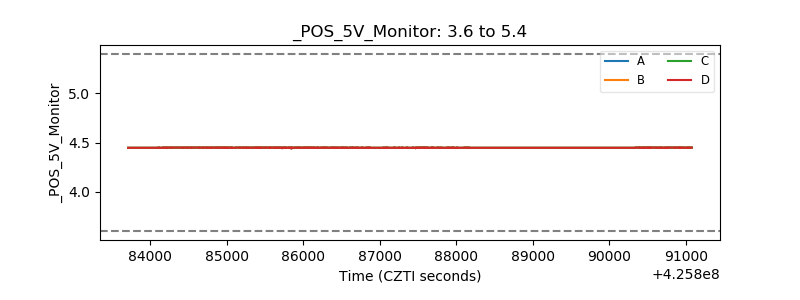 |
| _ROLL_ROT | 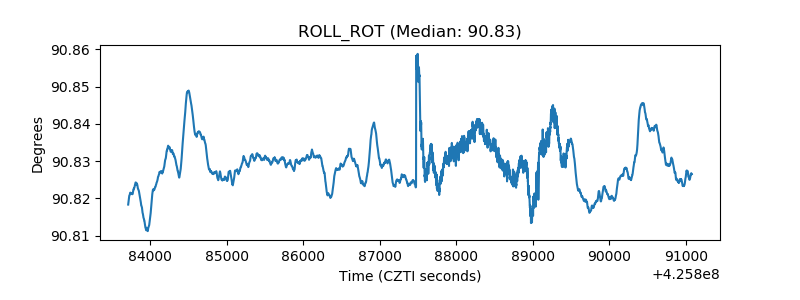 |
| _Roll_DEC |  |
| _Roll_RA | 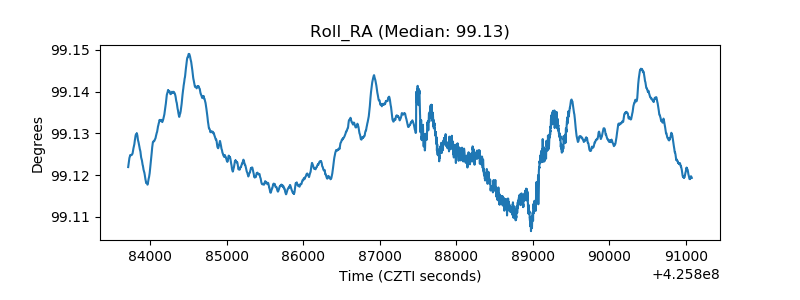 |
| Veto Counter | 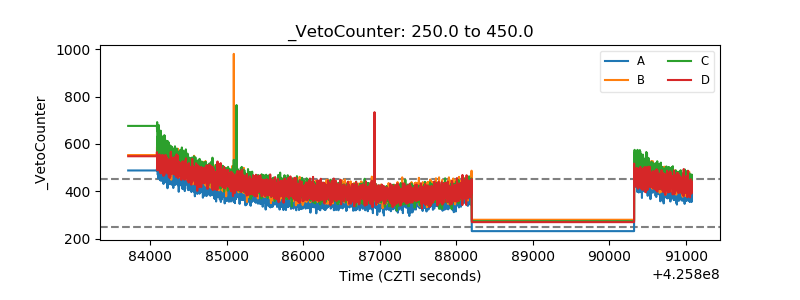 |