| Param | Original file | Final file |
|---|---|---|
| Filename | modeM0/AS1A12_099T03_9000005720_41940cztM0_level2.fits | modeM0/AS1A12_099T03_9000005720_41940cztM0_level2_quad_clean.evt |
| Size (bytes) | 338,791,680 | 89,199,360 |
| Size | 323.1 MB | 85.1 MB |
| Events in quadrant A | 3,841,333 | 571,684 |
| Events in quadrant B | 2,749,359 | 612,982 |
| Events in quadrant C | 2,838,285 | 600,116 |
| Events in quadrant D | 2,706,413 | 551,694 |
| Mode M0 | |||
|---|---|---|---|
| Quadrant | BADHDUFLAG | Total packets | Discarded packets |
| A | 0 | 14707 | 2 |
| B | 0 | 11717 | 2 |
| C | 0 | 11688 | 2 |
| D | 0 | 11590 | 2 |
| Mode SS | |||
|---|---|---|---|
| Quadrant | BADHDUFLAG | Total packets | Discarded packets |
| A | 0 | 106 | 0 |
| B | 0 | 106 | 0 |
| C | 0 | 106 | 0 |
| D | 0 | 106 | 0 |
| Mode M9 | |||
|---|---|---|---|
| Quadrant | BADHDUFLAG | Total packets | Discarded packets |
| A | 0 | 28 | 0 |
| B | 0 | 28 | 0 |
| C | 0 | 29 | 0 |
| D | 0 | 29 | 0 |
| Quadrant | Total seconds | Saturated seconds | Saturation percentage |
|---|---|---|---|
| A | 5207 | 344 | 6.606491% |
| B | 5207 | 80 | 1.536393% |
| C | 5206 | 17 | 0.326546% |
| D | 5206 | 41 | 0.787553% |
Noise dominated data is calculated using 1-second bins in cleaned event files. If a bin has >2000 counts, and if more than 50% of those come from <1% of pixels, then it is considered to be noise-dominated and hence unusable.
| Quadrant | # 1 sec bins | Bins with >0 counts | Bins with >2000 counts | High rate bins dominated by noise | Noise dominated (total time) | Noise dominated (detector-on time) | Marked lightcurve |
|---|---|---|---|---|---|---|---|
| A | 7300 | 5208 | 254 | 254 | 3.48% | 4.88% | 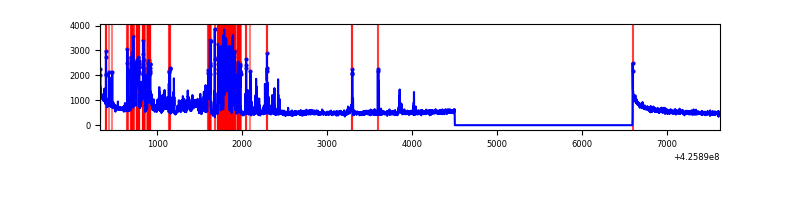 |
| B | 7300 | 5208 | 54 | 54 | 0.74% | 1.04% | 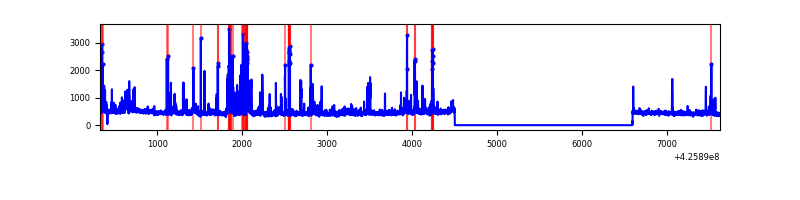 |
| C | 7299 | 5207 | 16 | 16 | 0.22% | 0.31% | 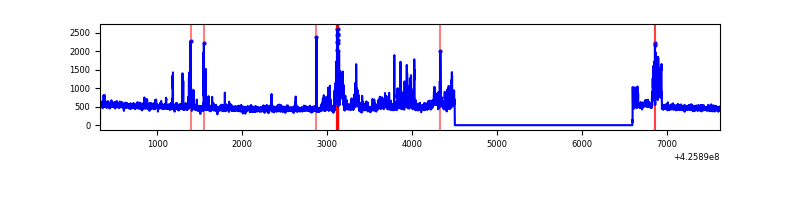 |
| D | 7299 | 5207 | 37 | 37 | 0.51% | 0.71% | 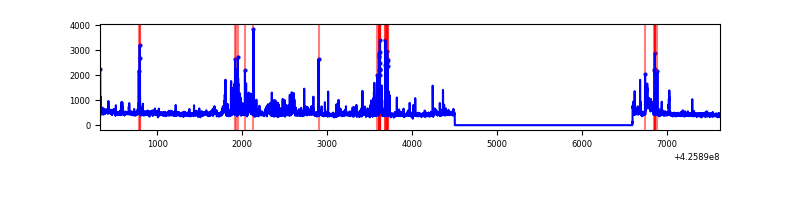 |
Top three noisy pixels from each quadrant. If the there are fewer than three noisy pixels in the level2.evt file, extra rows are filled as -1
| Pixel properties | Quadrant properties | ||||||
|---|---|---|---|---|---|---|---|
| Quadrant | DetID | PixID | Counts | Sigma | Mean | Median | Sigma |
| A | 14 | 24 | 1112108 | 9685.2 | 560 | 550 | 114.8 |
| A | 10 | 83 | 505215 | 4397.23 | 560 | 550 | 114.8 |
| A | 7 | 3 | 27741 | 236.92 | 560 | 550 | 114.8 |
| B | 5 | 255 | 224052 | 2059.61 | 565 | 549 | 108.5 |
| B | 3 | 112 | 184633 | 1696.36 | 565 | 549 | 108.5 |
| B | 0 | 229 | 110372 | 1012.04 | 565 | 549 | 108.5 |
| C | 14 | 254 | 396817 | 3040.89 | 566 | 571 | 130.3 |
| C | 15 | 214 | 217198 | 1662.45 | 566 | 571 | 130.3 |
| C | 3 | 233 | 13121 | 96.31 | 566 | 571 | 130.3 |
| D | 13 | 249 | 156501 | 1129.87 | 569 | 554 | 138.0 |
| D | 1 | 52 | 154767 | 1117.31 | 569 | 554 | 138.0 |
| D | 10 | 199 | 67123 | 482.31 | 569 | 554 | 138.0 |
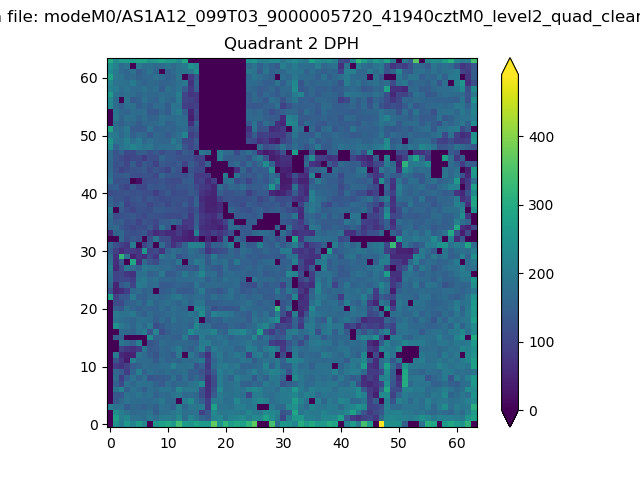
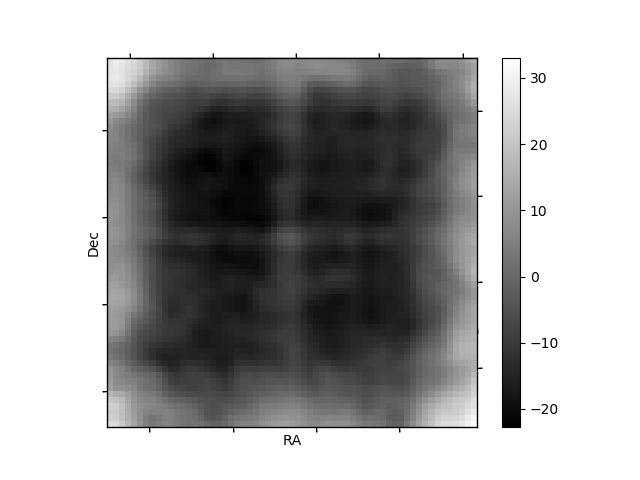
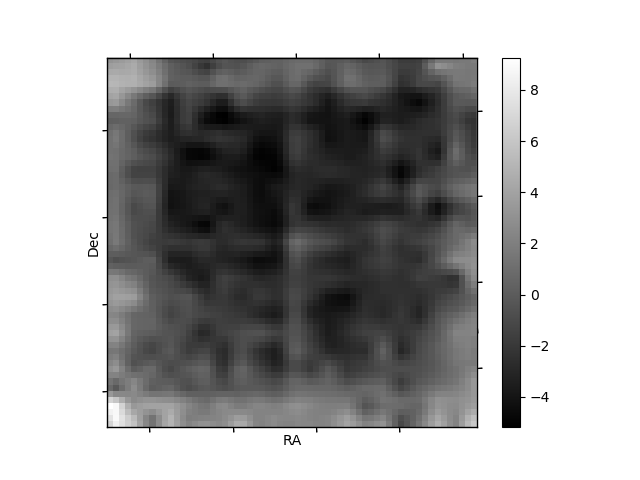
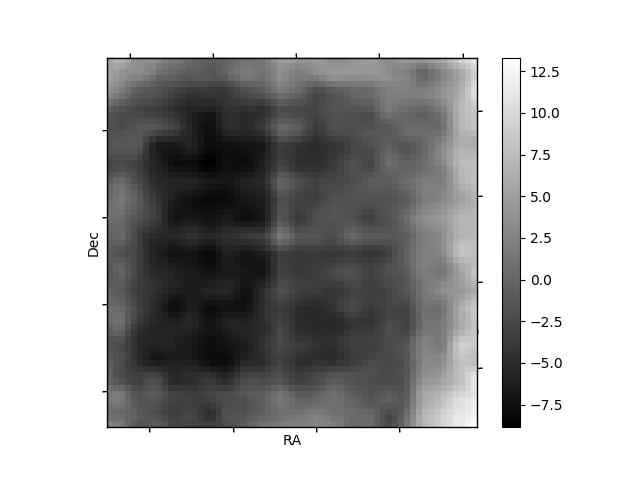
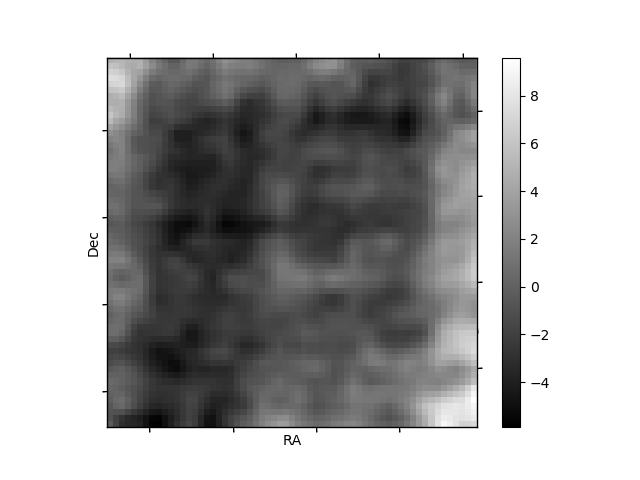
Histogram calculated using DETX and DETY for each event in the final _common_clean file
| Quadrant A | 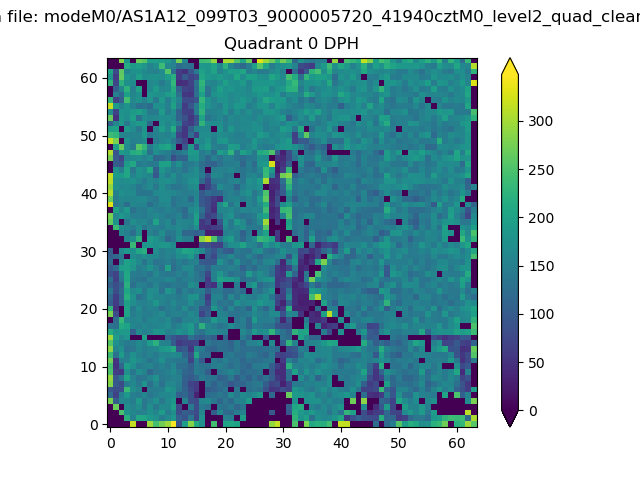 |
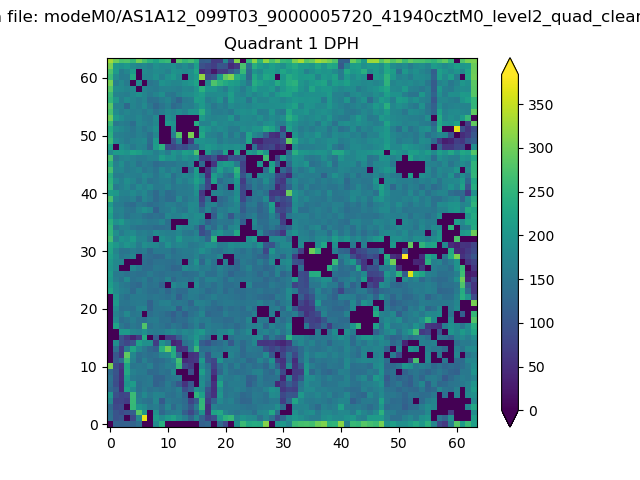 |
Quadrant B |
|---|---|---|---|
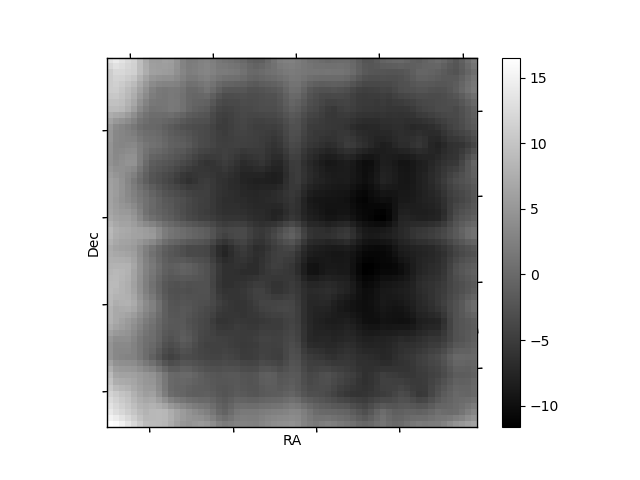
| Quadrant D | 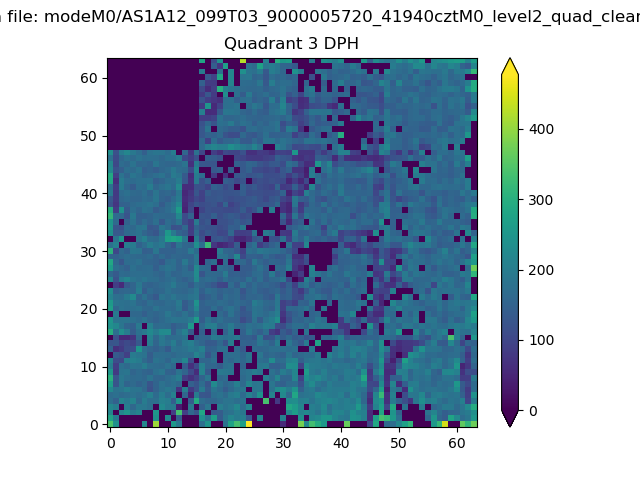 |
 |
Quadrant C |
| Plot type | Count rate plots | Images |
|---|---|---|
| Comparison with Poisson distribution Blue bars denote a histogram of data divided into 1 sec bins. Red curve is a Poisson curve with rate = median count rate of data. |
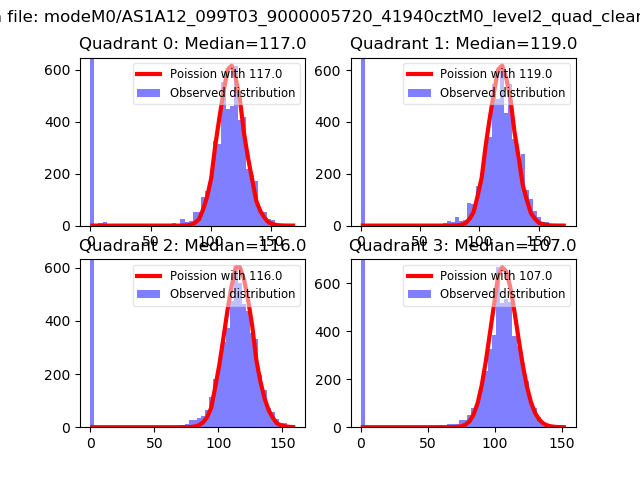 |
 |
| Quadrant-wise count rates Data is divided into 100 sec bins |
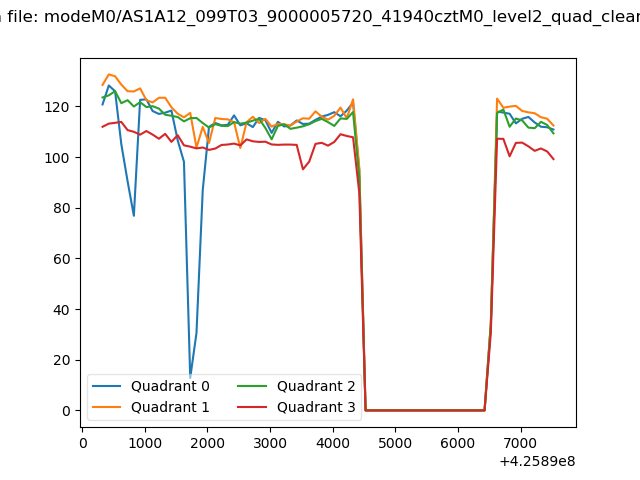 |
|
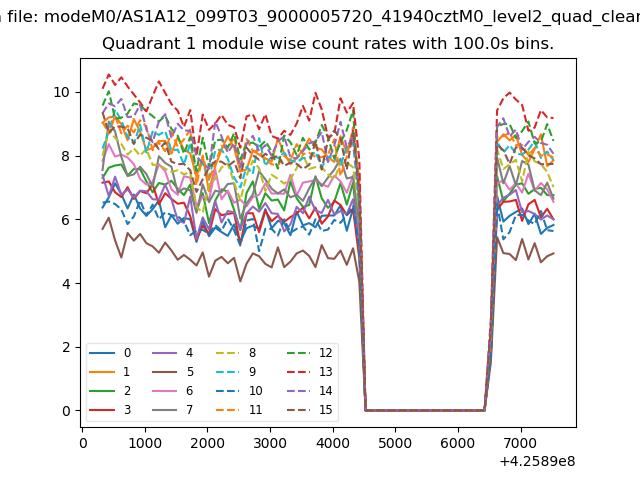
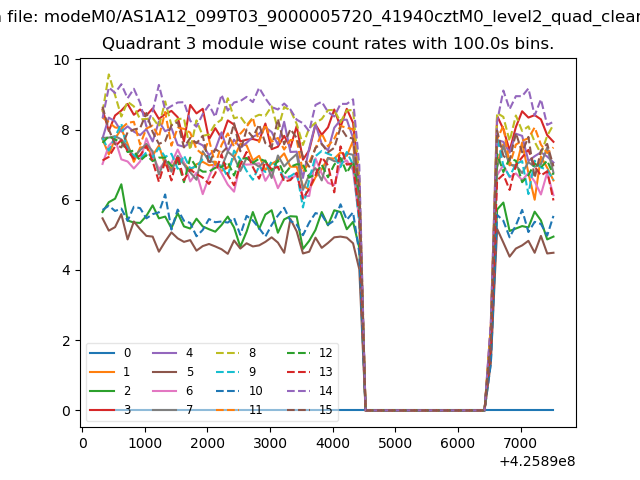
| Module-wise count rates for Quadrant A Data is divided into 100 sec bins |
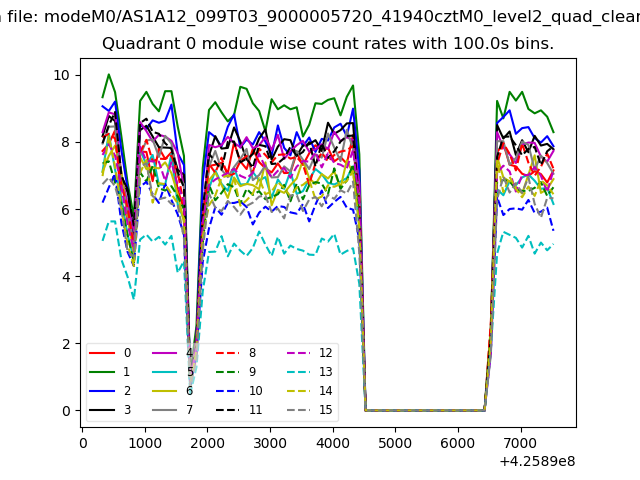 |
 |
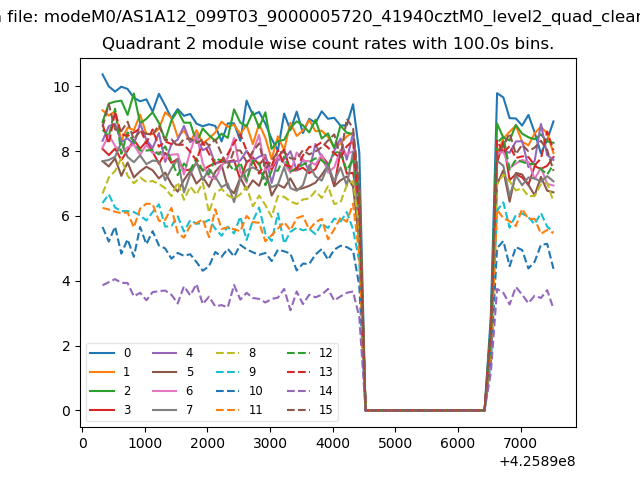
| Module-wise count rates for Quadrant B Data is divided into 100 sec bins |
 |
 |
| Module-wise count rates for Quadrant C Data is divided into 100 sec bins |
 |
 |
| Module-wise count rates for Quadrant D Data is divided into 100 sec bins |
 |
 |
| Parameter | Plot |
|---|---|
| CZT HV Monitor | 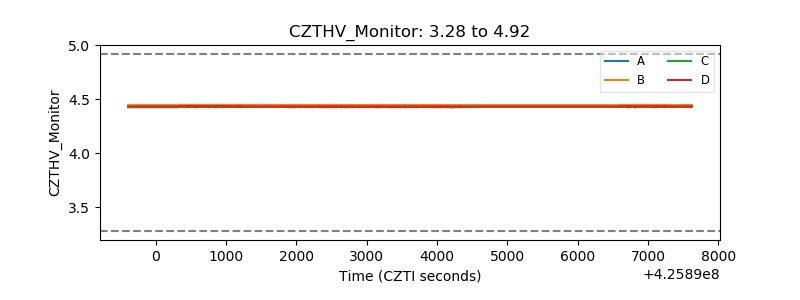 |
| D_VDD | 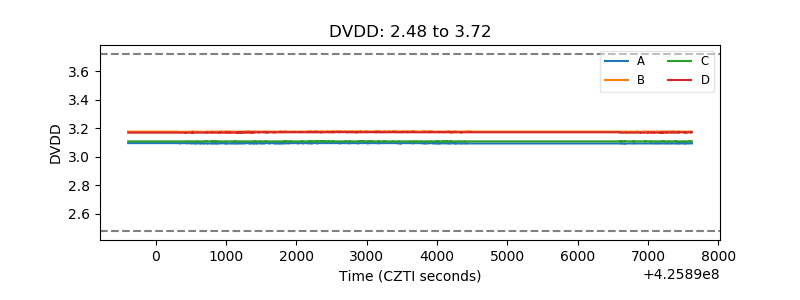 |
| Temperature 1 | 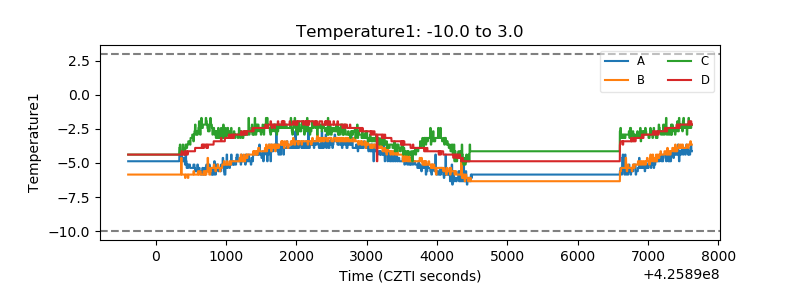 |
| Veto HV Monitor | 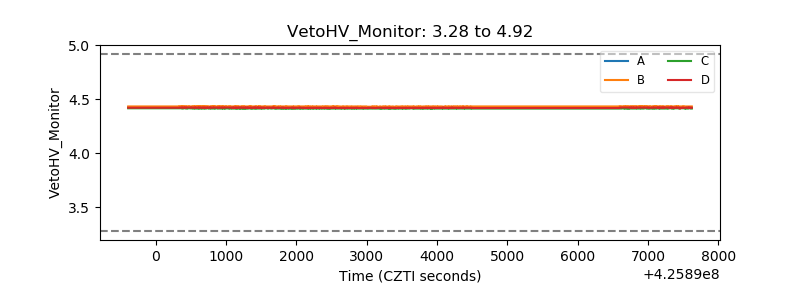 |
| Veto LLD | 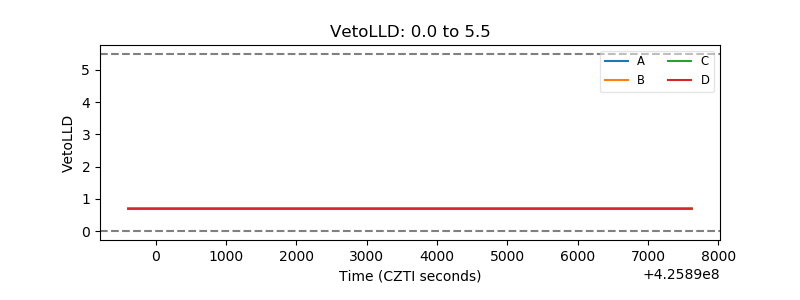 |
| Alpha Counter | 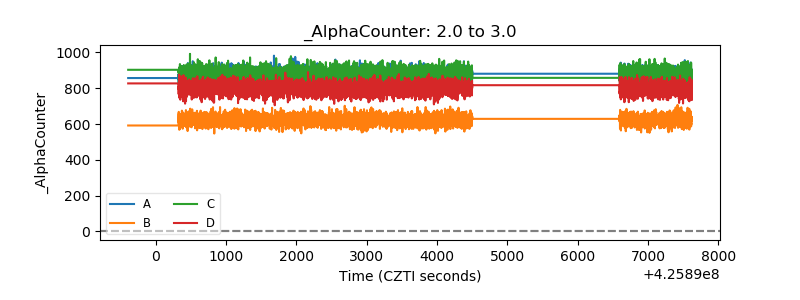 |
| _CPM_Rate | 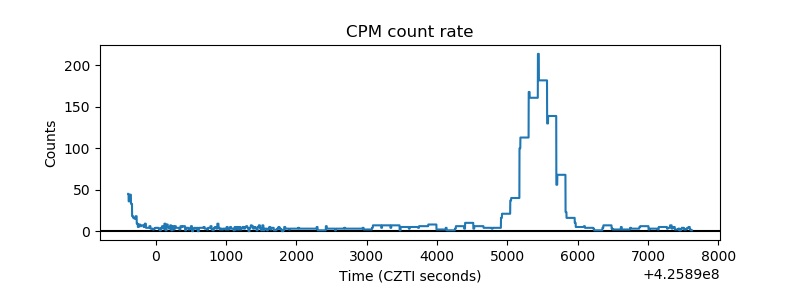 |
| CZT Counter | 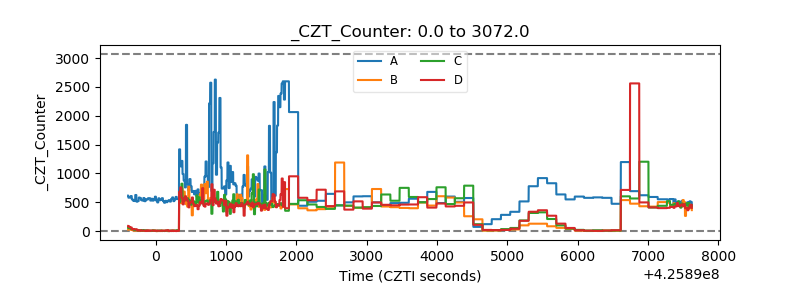 |
| +2.5 Volts monitor | 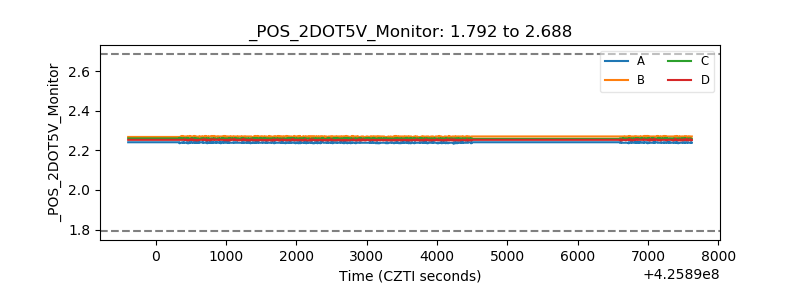 |
| +5 Volts monitor |  |
| _ROLL_ROT | 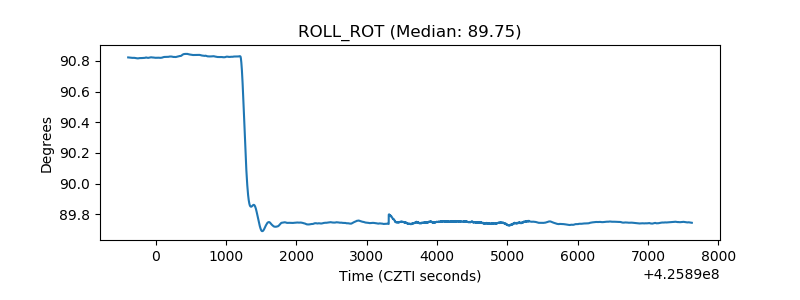 |
| _Roll_DEC | 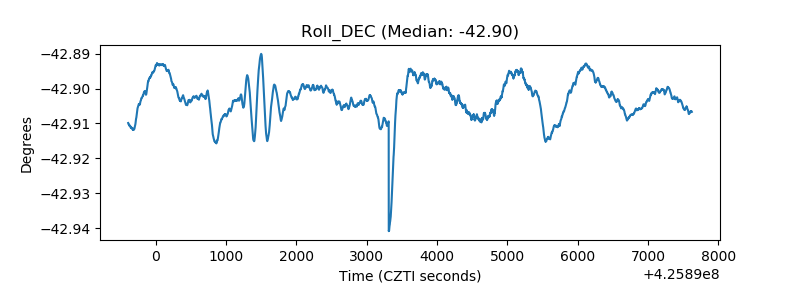 |
| _Roll_RA | 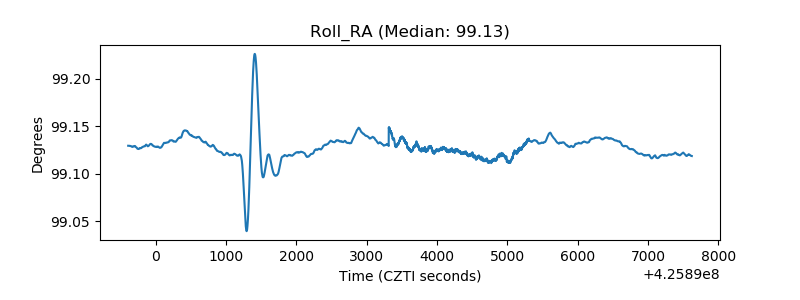 |
| Veto Counter | 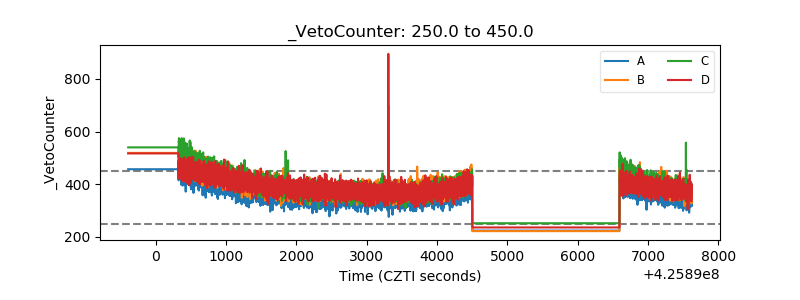 |