| Param | Original file | Final file |
|---|---|---|
| Filename | modeM0/AS1A12_099T03_9000005720_41941cztM0_level2.fits | modeM0/AS1A12_099T03_9000005720_41941cztM0_level2_quad_clean.evt |
| Size (bytes) | 305,190,720 | 88,191,360 |
| Size | 291.1 MB | 84.1 MB |
| Events in quadrant A | 2,802,744 | 591,553 |
| Events in quadrant B | 2,657,915 | 593,528 |
| Events in quadrant C | 2,506,522 | 582,944 |
| Events in quadrant D | 2,916,955 | 531,509 |
| Mode M0 | |||
|---|---|---|---|
| Quadrant | BADHDUFLAG | Total packets | Discarded packets |
| A | 0 | 11509 | 3 |
| B | 0 | 11727 | 2 |
| C | 0 | 10966 | 2 |
| D | 0 | 12431 | 2 |
| Mode SS | |||
|---|---|---|---|
| Quadrant | BADHDUFLAG | Total packets | Discarded packets |
| A | 0 | 108 | 0 |
| B | 0 | 108 | 0 |
| C | 0 | 108 | 0 |
| D | 0 | 108 | 0 |
| Mode M9 | |||
|---|---|---|---|
| Quadrant | BADHDUFLAG | Total packets | Discarded packets |
| A | 0 | 23 | 0 |
| B | 0 | 23 | 0 |
| C | 0 | 23 | 0 |
| D | 0 | 24 | 0 |
| Quadrant | Total seconds | Saturated seconds | Saturation percentage |
|---|---|---|---|
| A | 5298 | 12 | 0.226501% |
| B | 5298 | 93 | 1.755379% |
| C | 5298 | 7 | 0.132125% |
| D | 5298 | 121 | 2.283881% |
Noise dominated data is calculated using 1-second bins in cleaned event files. If a bin has >2000 counts, and if more than 50% of those come from <1% of pixels, then it is considered to be noise-dominated and hence unusable.
| Quadrant | # 1 sec bins | Bins with >0 counts | Bins with >2000 counts | High rate bins dominated by noise | Noise dominated (total time) | Noise dominated (detector-on time) | Marked lightcurve |
|---|---|---|---|---|---|---|---|
| A | 7180 | 5299 | 7 | 7 | 0.10% | 0.13% | 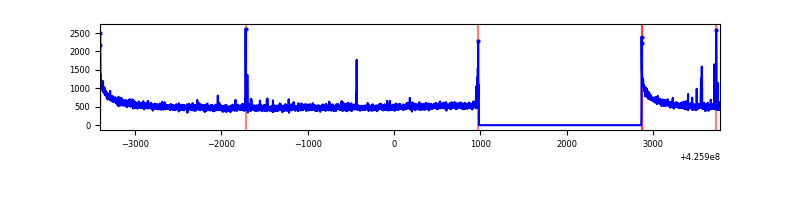 |
| B | 7180 | 5299 | 74 | 74 | 1.03% | 1.40% | 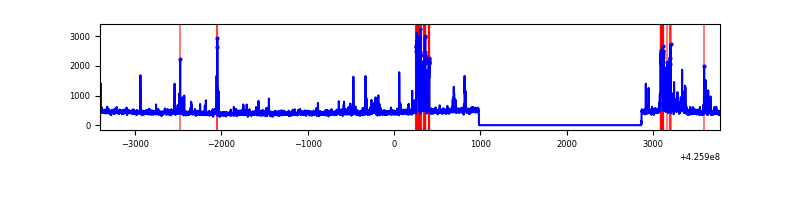 |
| C | 7180 | 5299 | 2 | 2 | 0.03% | 0.04% | 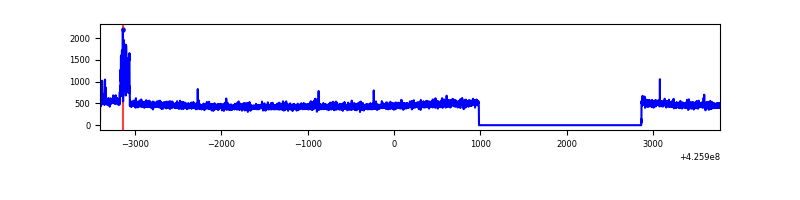 |
| D | 7180 | 5299 | 125 | 125 | 1.74% | 2.36% | 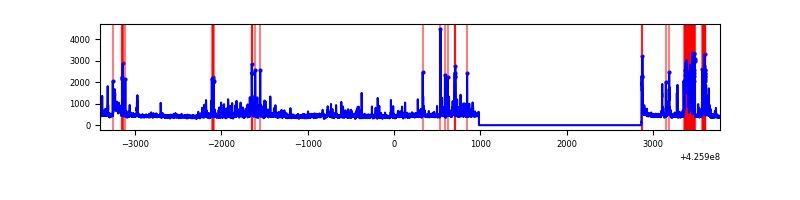 |
Top three noisy pixels from each quadrant. If the there are fewer than three noisy pixels in the level2.evt file, extra rows are filled as -1
| Pixel properties | Quadrant properties | ||||||
|---|---|---|---|---|---|---|---|
| Quadrant | DetID | PixID | Counts | Sigma | Mean | Median | Sigma |
| A | 10 | 83 | 520763 | 4378.33 | 577 | 566 | 118.8 |
| A | 2 | 79 | 37367 | 309.74 | 577 | 566 | 118.8 |
| A | 7 | 3 | 10011 | 79.5 | 577 | 566 | 118.8 |
| B | 0 | 229 | 309263 | 2823.04 | 561 | 546 | 109.4 |
| B | 5 | 255 | 101662 | 924.65 | 561 | 546 | 109.4 |
| B | 0 | 190 | 29561 | 265.33 | 561 | 546 | 109.4 |
| C | 15 | 214 | 219357 | 1686.29 | 559 | 562 | 129.7 |
| C | 14 | 254 | 98271 | 753.06 | 559 | 562 | 129.7 |
| C | 3 | 233 | 8733 | 62.98 | 559 | 562 | 129.7 |
| D | 2 | 249 | 318375 | 2332.84 | 559 | 544 | 136.2 |
| D | 13 | 249 | 154744 | 1131.81 | 559 | 544 | 136.2 |
| D | 12 | 218 | 75118 | 547.36 | 559 | 544 | 136.2 |
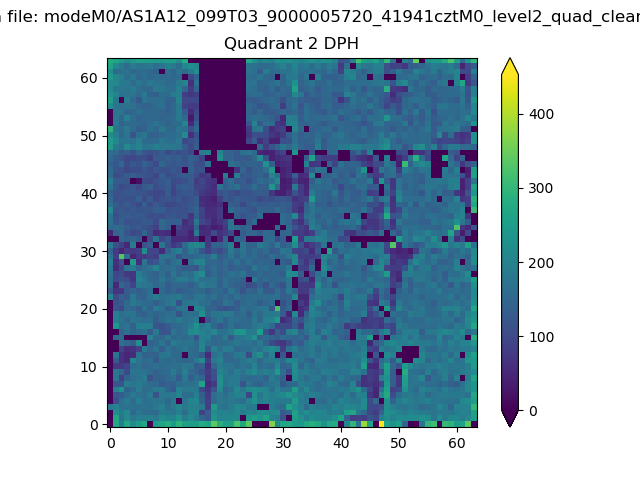
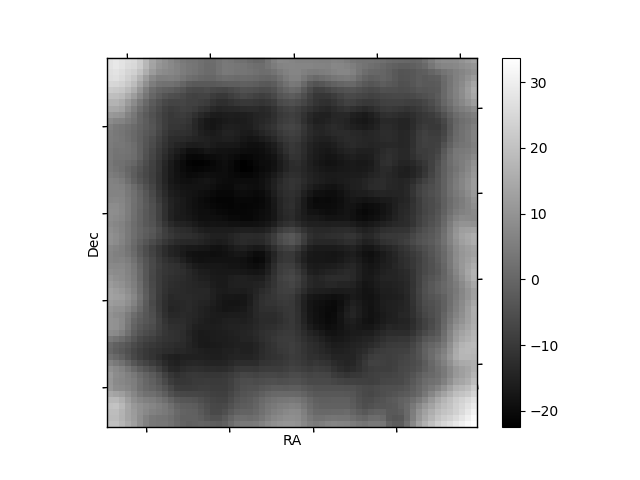
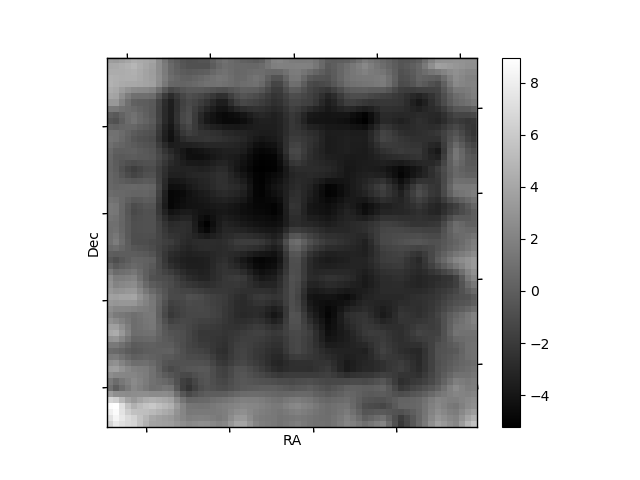
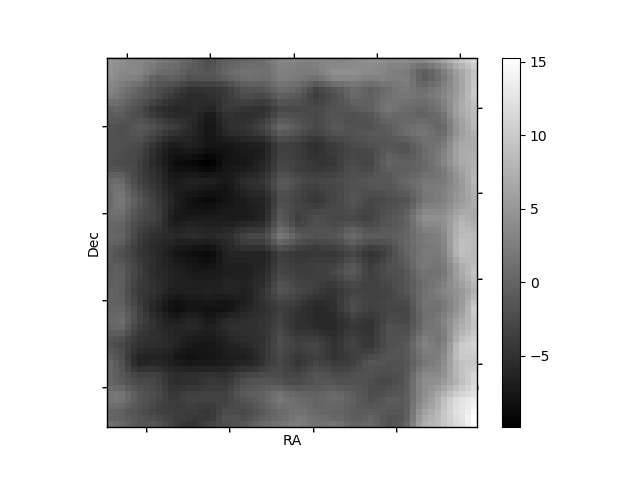
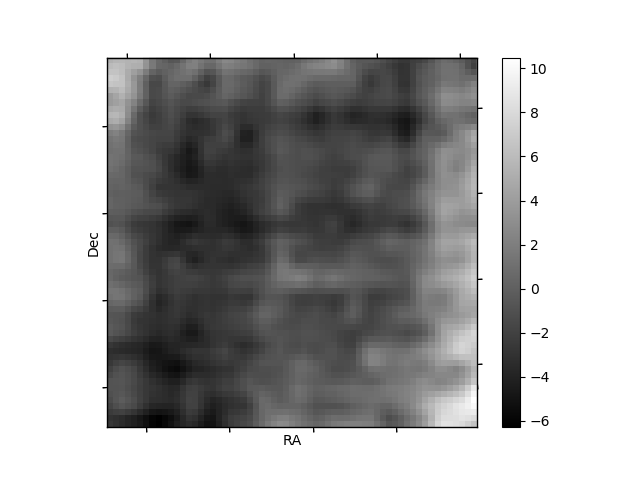
Histogram calculated using DETX and DETY for each event in the final _common_clean file
| Quadrant A | 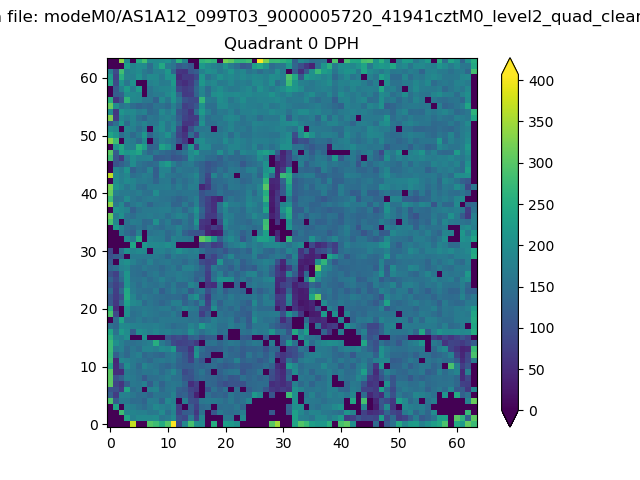 |
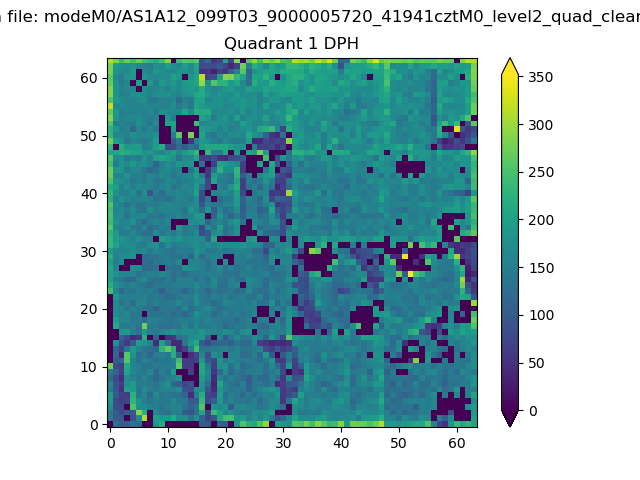 |
Quadrant B |
|---|---|---|---|
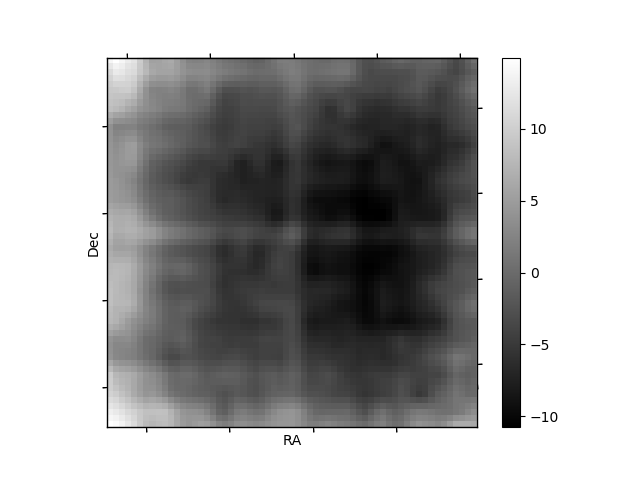
| Quadrant D | 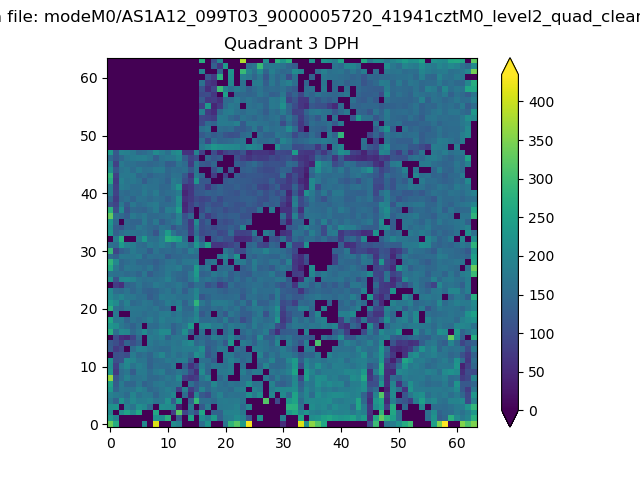 |
 |
Quadrant C |
| Plot type | Count rate plots | Images |
|---|---|---|
| Comparison with Poisson distribution Blue bars denote a histogram of data divided into 1 sec bins. Red curve is a Poisson curve with rate = median count rate of data. |
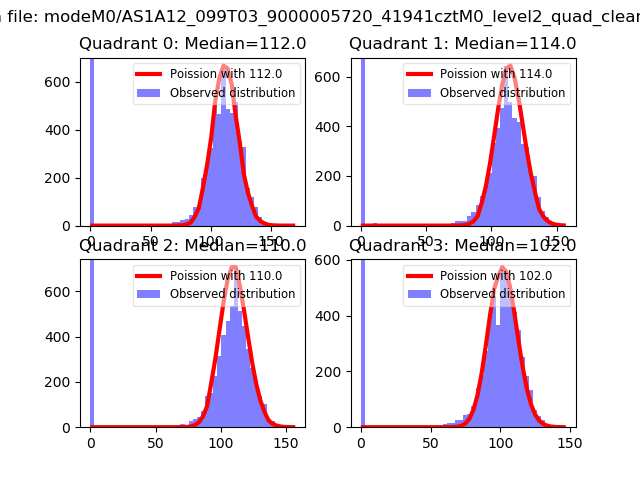 |
 |
| Quadrant-wise count rates Data is divided into 100 sec bins |
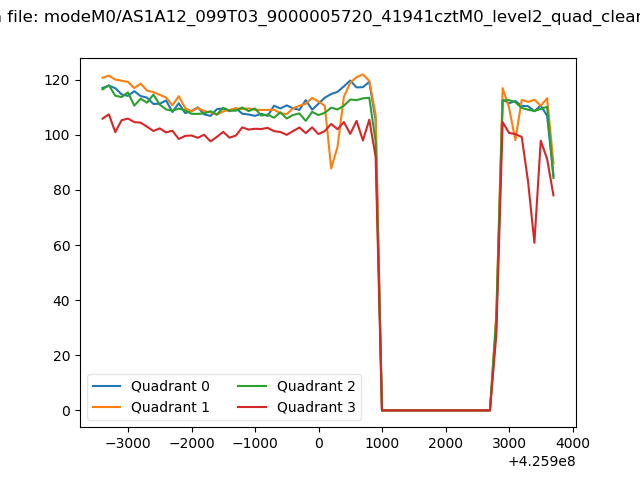 |
|
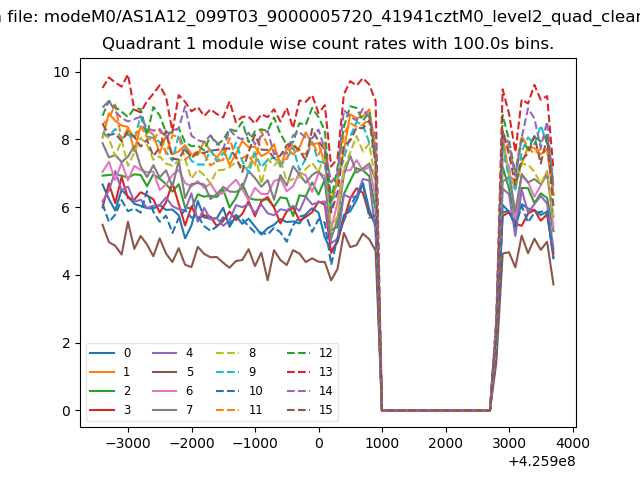
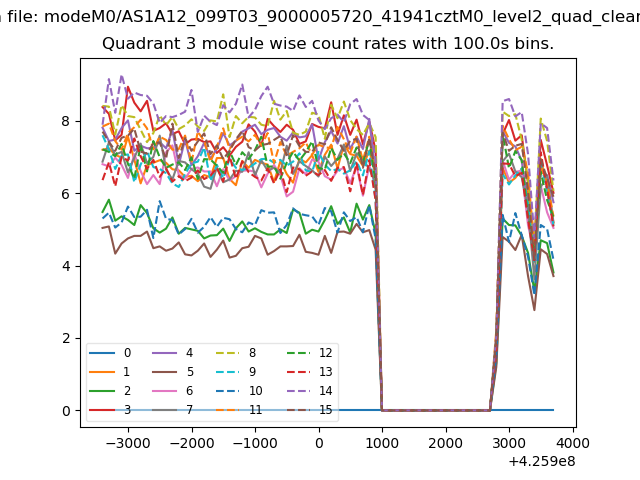
| Module-wise count rates for Quadrant A Data is divided into 100 sec bins |
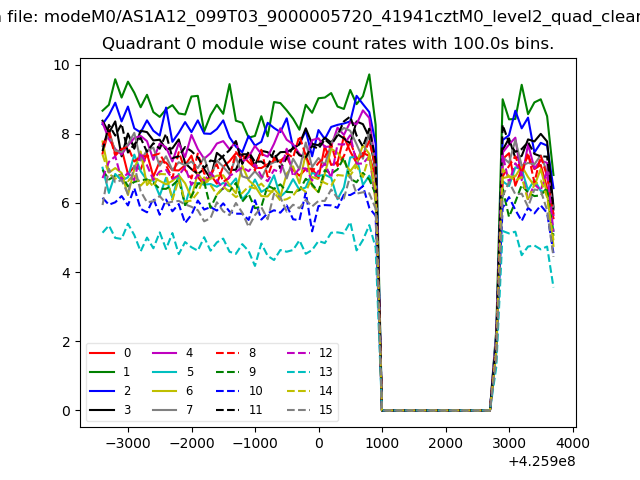 |
 |
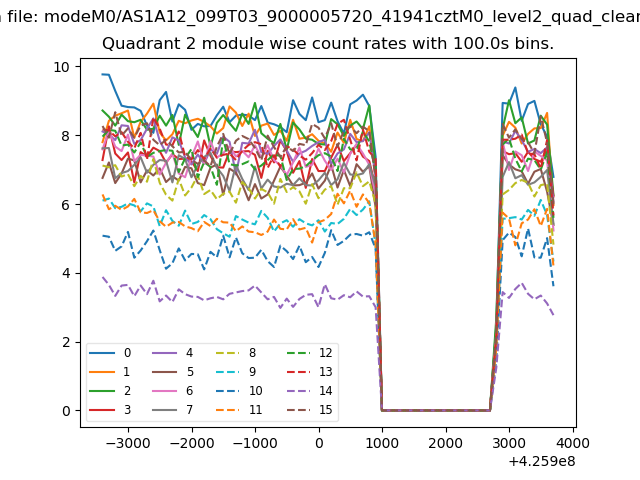
| Module-wise count rates for Quadrant B Data is divided into 100 sec bins |
 |
 |
| Module-wise count rates for Quadrant C Data is divided into 100 sec bins |
 |
 |
| Module-wise count rates for Quadrant D Data is divided into 100 sec bins |
 |
 |
| Parameter | Plot |
|---|---|
| CZT HV Monitor |  |
| D_VDD |  |
| Temperature 1 | 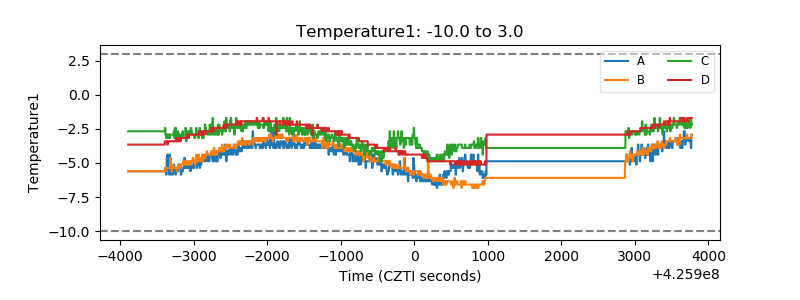 |
| Veto HV Monitor | 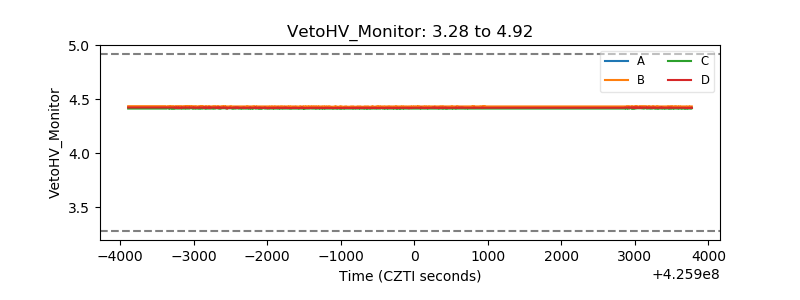 |
| Veto LLD | 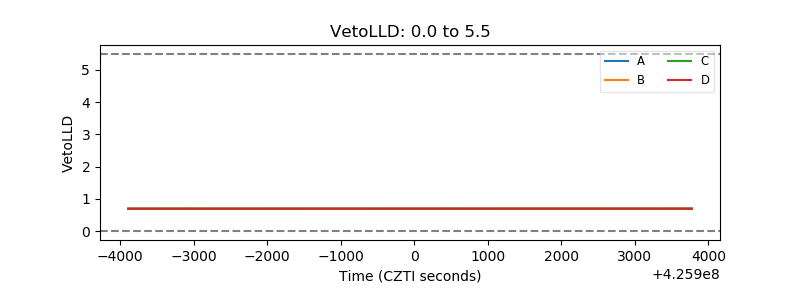 |
| Alpha Counter | 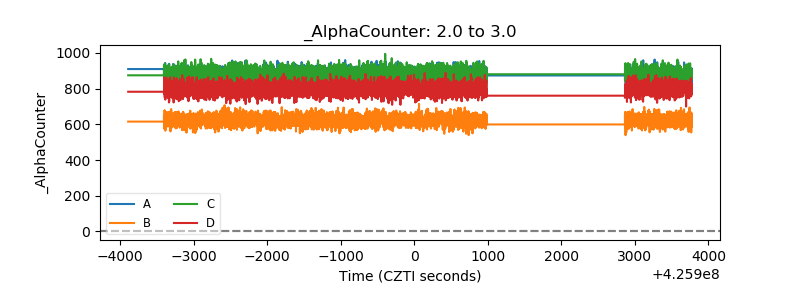 |
| _CPM_Rate | 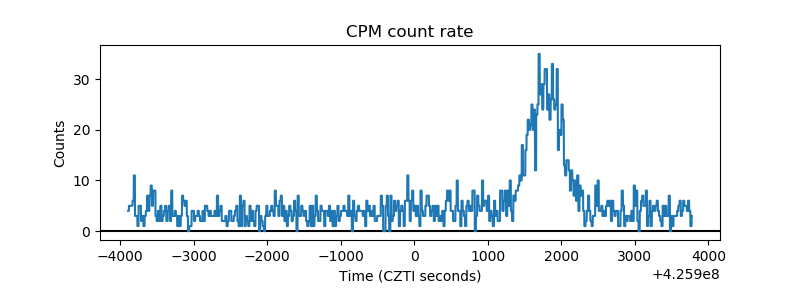 |
| CZT Counter | 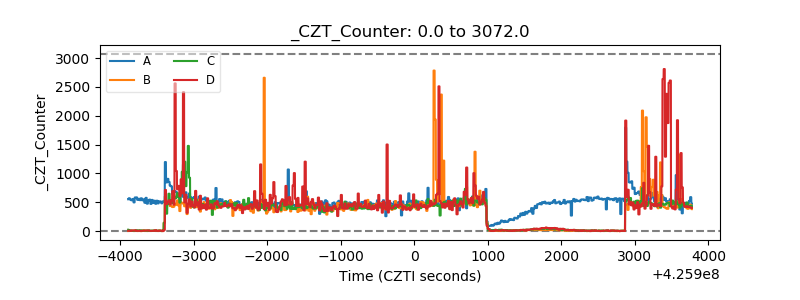 |
| +2.5 Volts monitor | 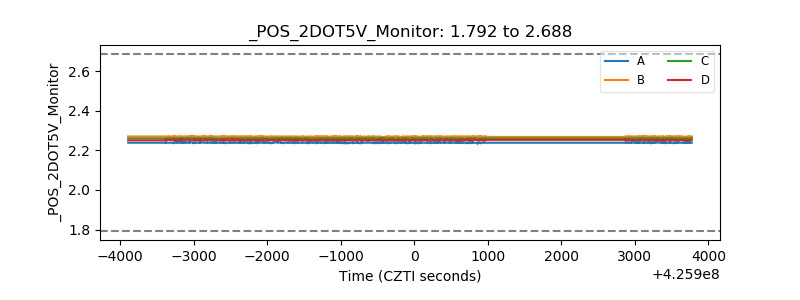 |
| +5 Volts monitor | 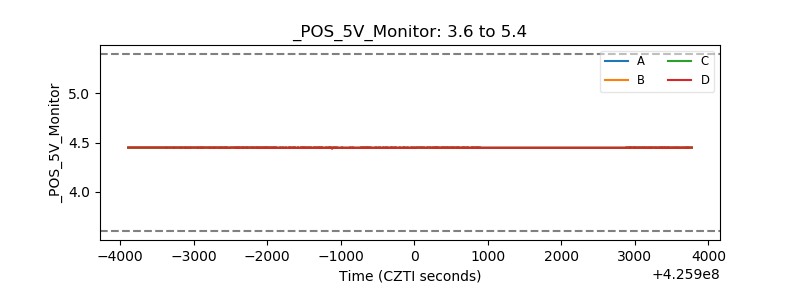 |
| _ROLL_ROT | 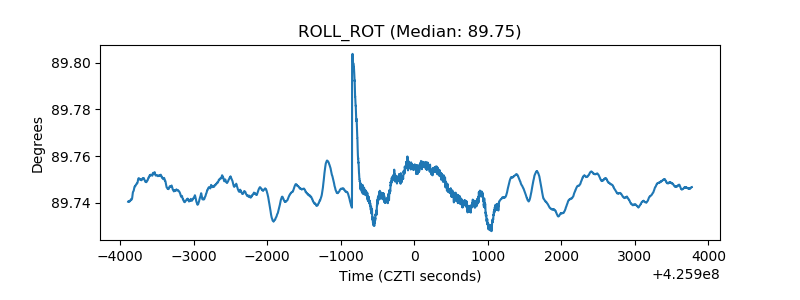 |
| _Roll_DEC | 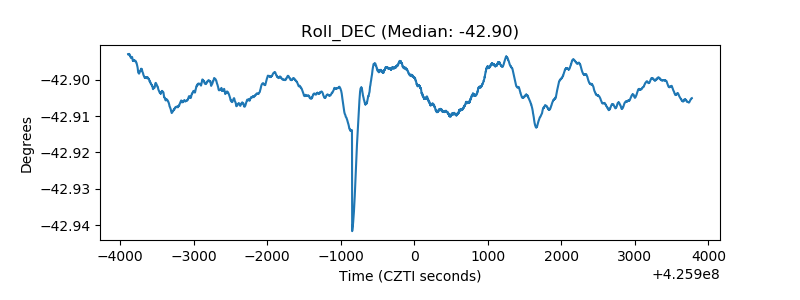 |
| _Roll_RA | 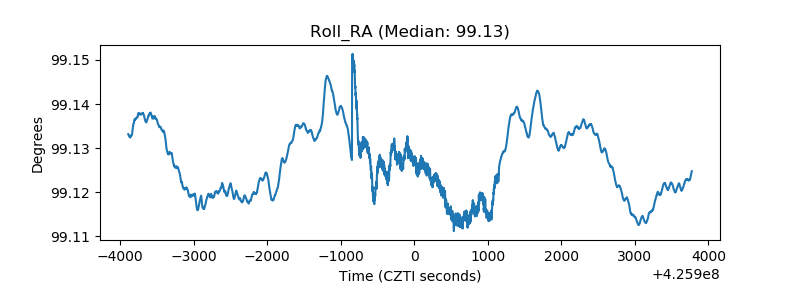 |
| Veto Counter | 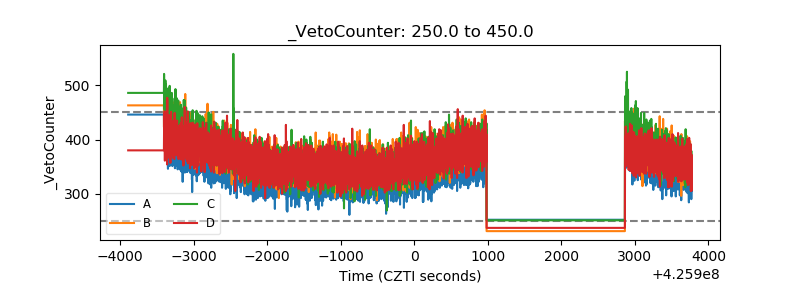 |