| Param | Original file | Final file |
|---|---|---|
| Filename | modeM0/AS1A12_099T03_9000005720_41942cztM0_level2.fits | modeM0/AS1A12_099T03_9000005720_41942cztM0_level2_quad_clean.evt |
| Size (bytes) | 350,928,000 | 90,388,800 |
| Size | 334.7 MB | 86.2 MB |
| Events in quadrant A | 2,939,522 | 613,196 |
| Events in quadrant B | 2,923,040 | 609,261 |
| Events in quadrant C | 2,534,806 | 600,825 |
| Events in quadrant D | 4,156,575 | 521,884 |
| Mode M0 | |||
|---|---|---|---|
| Quadrant | BADHDUFLAG | Total packets | Discarded packets |
| A | 0 | 12054 | 2 |
| B | 0 | 12698 | 2 |
| C | 0 | 11248 | 2 |
| D | 0 | 16209 | 2 |
| Mode SS | |||
|---|---|---|---|
| Quadrant | BADHDUFLAG | Total packets | Discarded packets |
| A | 0 | 114 | 0 |
| B | 0 | 114 | 0 |
| C | 0 | 114 | 0 |
| D | 0 | 114 | 0 |
| Mode M9 | |||
|---|---|---|---|
| Quadrant | BADHDUFLAG | Total packets | Discarded packets |
| A | 0 | 17 | 0 |
| B | 0 | 18 | 0 |
| C | 0 | 18 | 0 |
| D | 0 | 18 | 0 |
| Quadrant | Total seconds | Saturated seconds | Saturation percentage |
|---|---|---|---|
| A | 5599 | 18 | 0.321486% |
| B | 5599 | 149 | 2.661189% |
| C | 5599 | 3 | 0.053581% |
| D | 5598 | 440 | 7.859950% |
Noise dominated data is calculated using 1-second bins in cleaned event files. If a bin has >2000 counts, and if more than 50% of those come from <1% of pixels, then it is considered to be noise-dominated and hence unusable.
| Quadrant | # 1 sec bins | Bins with >0 counts | Bins with >2000 counts | High rate bins dominated by noise | Noise dominated (total time) | Noise dominated (detector-on time) | Marked lightcurve |
|---|---|---|---|---|---|---|---|
| A | 7152 | 5600 | 4 | 4 | 0.06% | 0.07% | 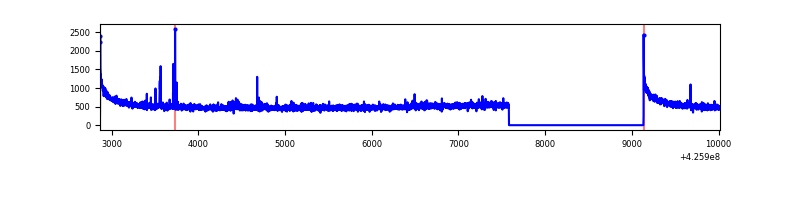 |
| B | 7152 | 5600 | 121 | 121 | 1.69% | 2.16% | 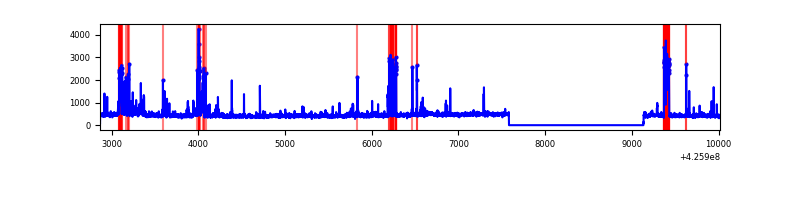 |
| C | 7152 | 5600 | 0 | 0 | 0.00% | 0.00% | 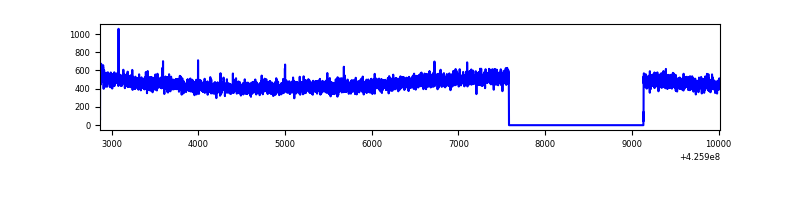 |
| D | 7151 | 5599 | 454 | 454 | 6.35% | 8.11% | 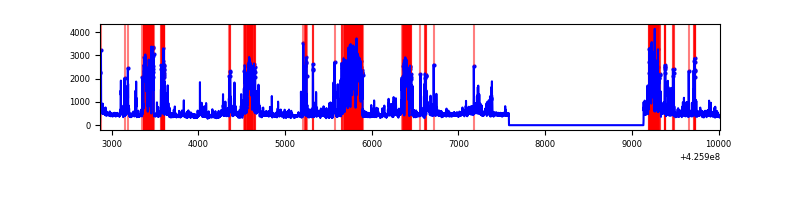 |
Top three noisy pixels from each quadrant. If the there are fewer than three noisy pixels in the level2.evt file, extra rows are filled as -1
| Pixel properties | Quadrant properties | ||||||
|---|---|---|---|---|---|---|---|
| Quadrant | DetID | PixID | Counts | Sigma | Mean | Median | Sigma |
| A | 10 | 83 | 551791 | 4374.24 | 607 | 595 | 126.0 |
| A | 2 | 79 | 17285 | 132.45 | 607 | 595 | 126.0 |
| A | 6 | 10 | 9782 | 72.91 | 607 | 595 | 126.0 |
| B | 7 | 202 | 240607 | 2094.37 | 587 | 570 | 114.6 |
| B | 0 | 229 | 233153 | 2029.34 | 587 | 570 | 114.6 |
| B | 5 | 255 | 109599 | 951.3 | 587 | 570 | 114.6 |
| C | 15 | 214 | 231058 | 1679.75 | 587 | 590 | 137.2 |
| C | 3 | 233 | 8960 | 61.0 | 587 | 590 | 137.2 |
| C | 13 | 61 | 3937 | 24.39 | 587 | 590 | 137.2 |
| D | 1 | 47 | 506507 | 3582.67 | 573 | 556 | 141.2 |
| D | 13 | 249 | 404304 | 2858.96 | 573 | 556 | 141.2 |
| D | 2 | 120 | 378370 | 2675.32 | 573 | 556 | 141.2 |
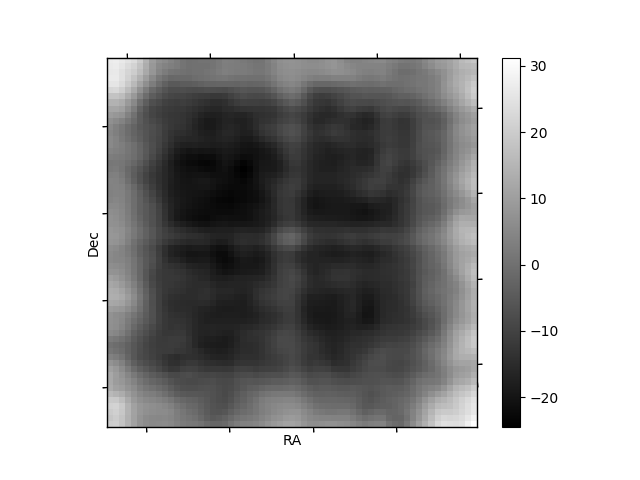
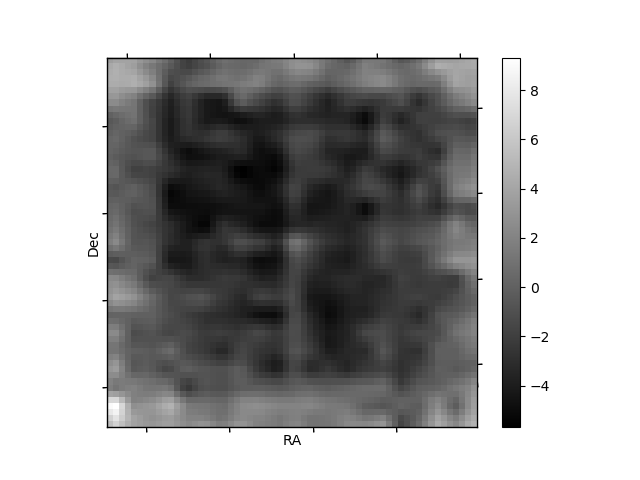
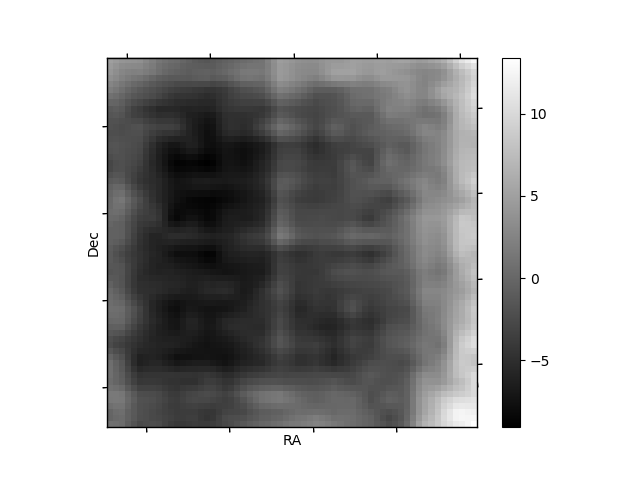
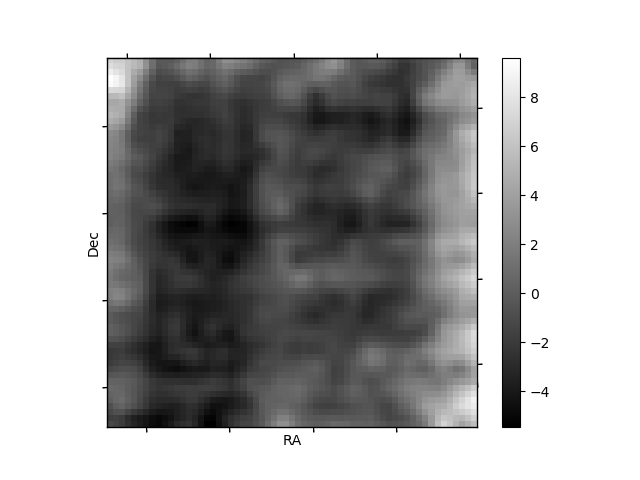
Histogram calculated using DETX and DETY for each event in the final _common_clean file
| Quadrant A | 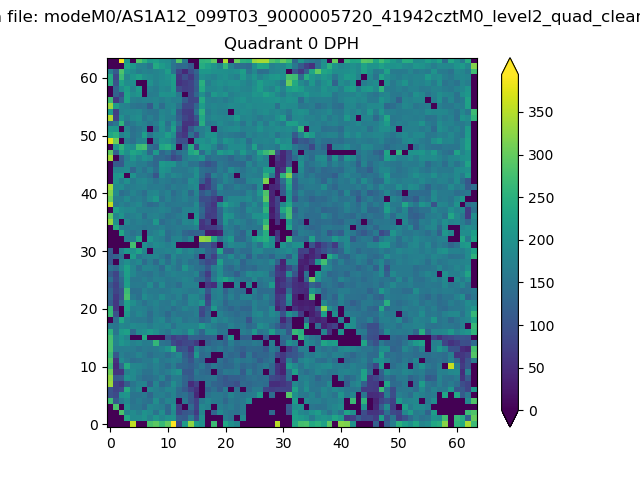 |
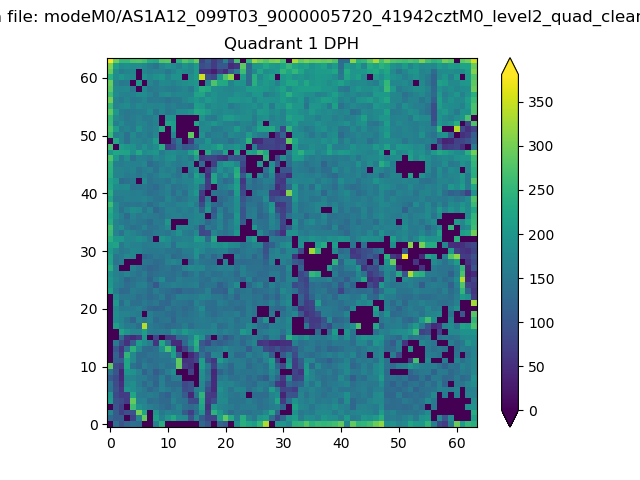 |
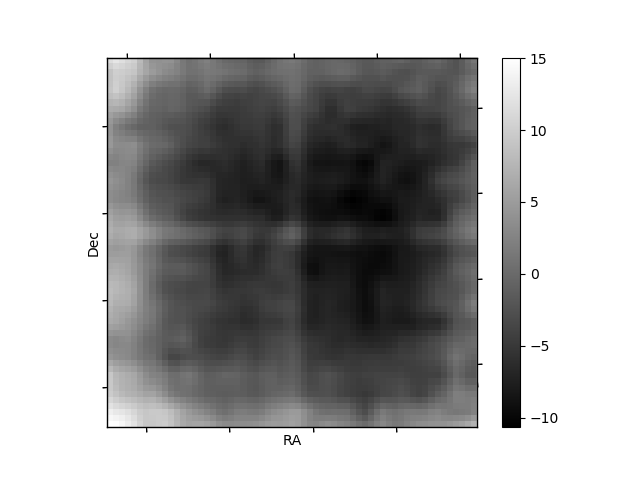
Quadrant B |
|---|---|---|---|
| Quadrant D | 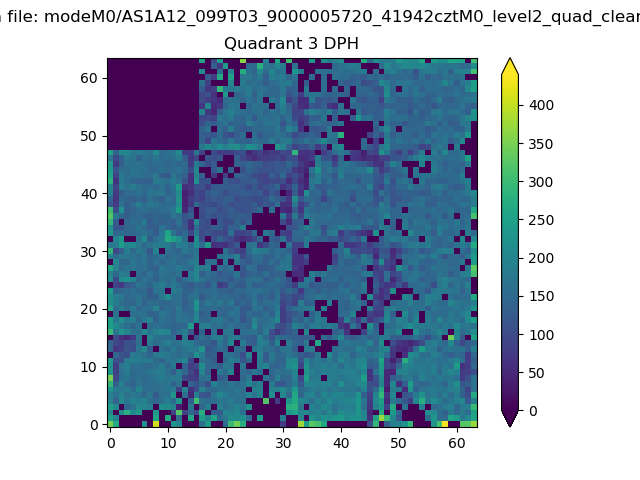 |
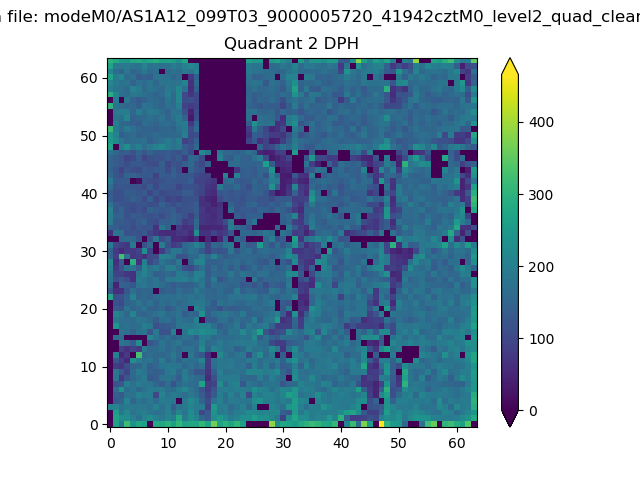 |
Quadrant C |
| Plot type | Count rate plots | Images |
|---|---|---|
| Comparison with Poisson distribution Blue bars denote a histogram of data divided into 1 sec bins. Red curve is a Poisson curve with rate = median count rate of data. |
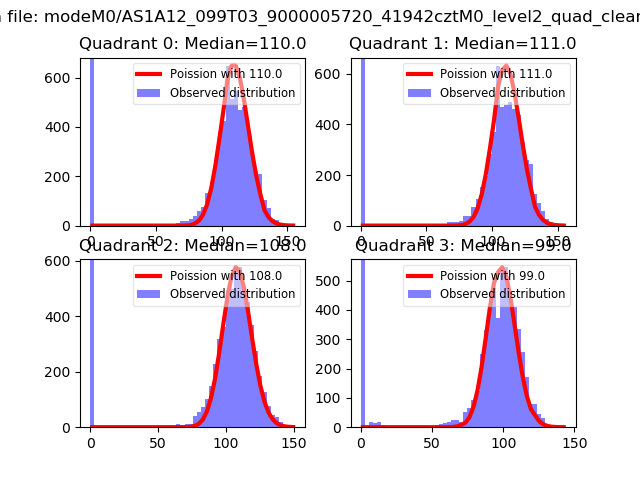 |
 |
| Quadrant-wise count rates Data is divided into 100 sec bins |
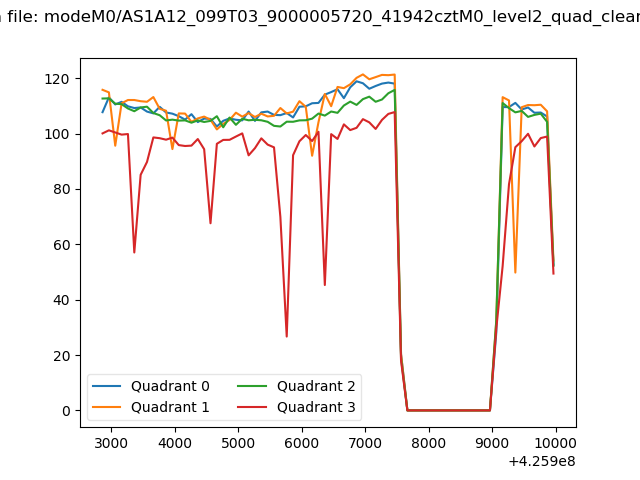 |
|
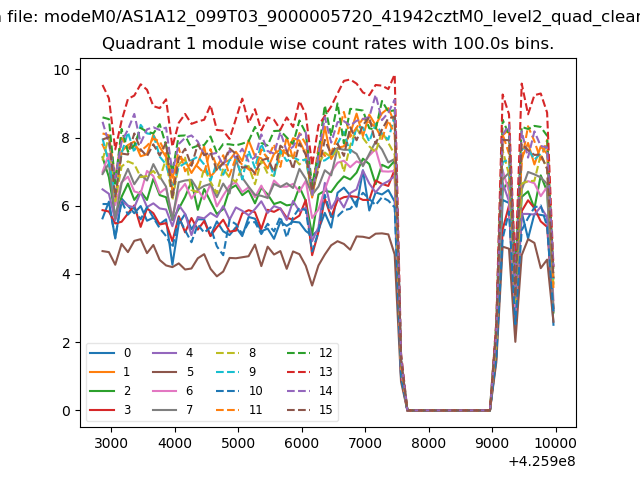
| Module-wise count rates for Quadrant A Data is divided into 100 sec bins |
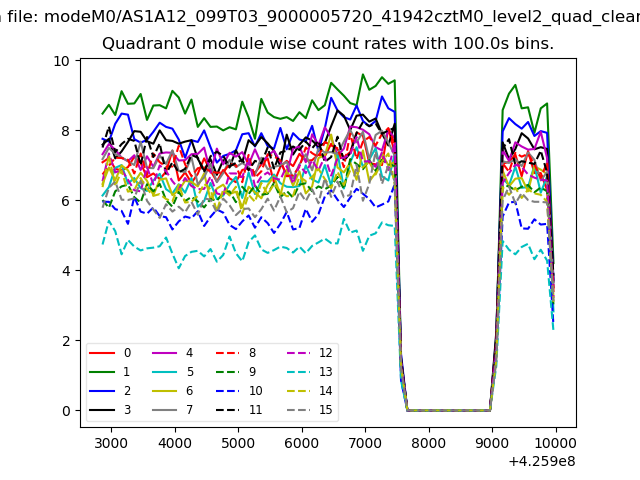 |
 |
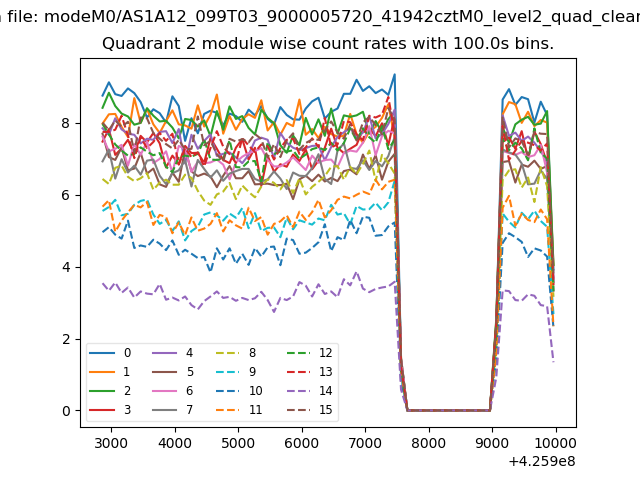
| Module-wise count rates for Quadrant B Data is divided into 100 sec bins |
 |
 |
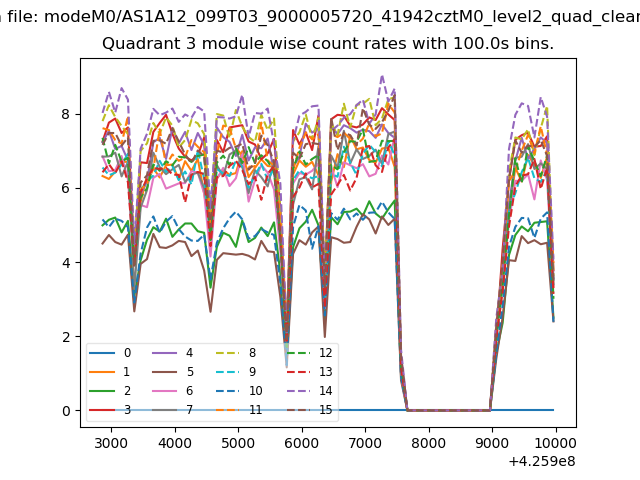
| Module-wise count rates for Quadrant C Data is divided into 100 sec bins |
 |
 |
| Module-wise count rates for Quadrant D Data is divided into 100 sec bins |
 |
 |
| Parameter | Plot |
|---|---|
| CZT HV Monitor | 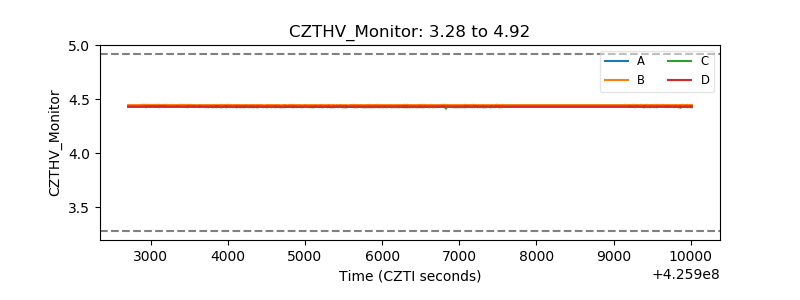 |
| D_VDD |  |
| Temperature 1 | 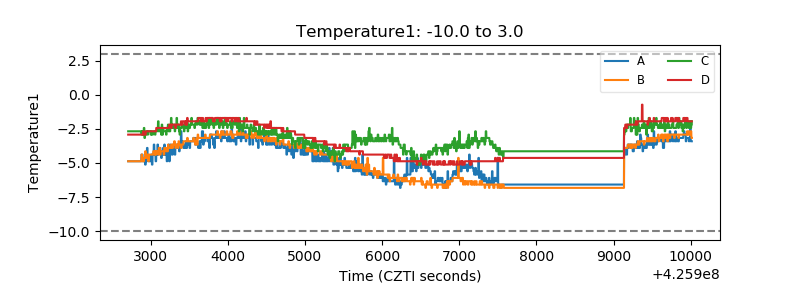 |
| Veto HV Monitor |  |
| Veto LLD | 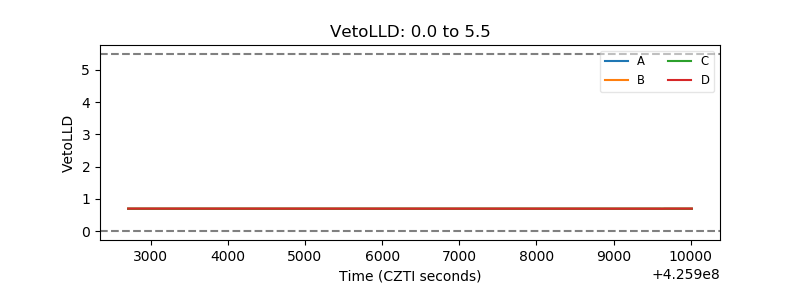 |
| Alpha Counter | 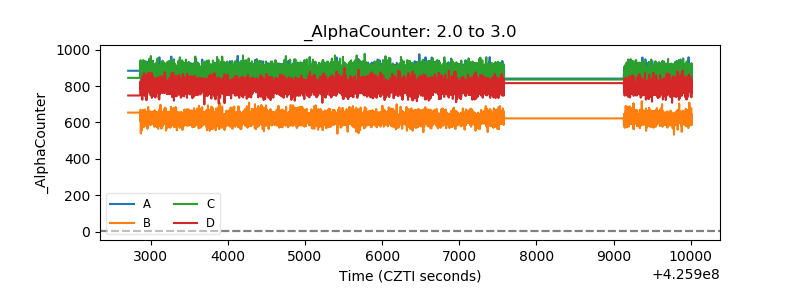 |
| _CPM_Rate | 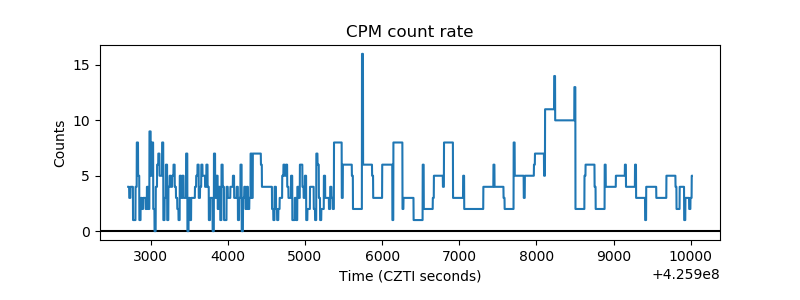 |
| CZT Counter | 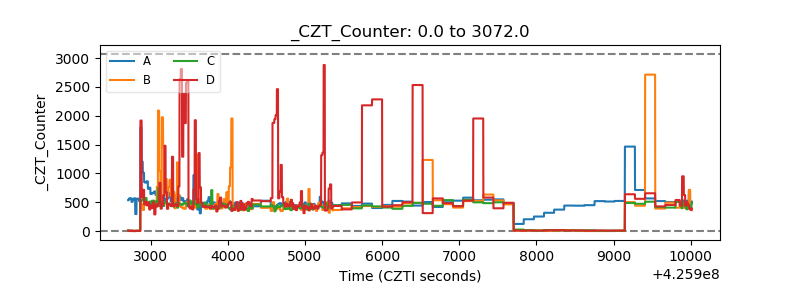 |
| +2.5 Volts monitor | 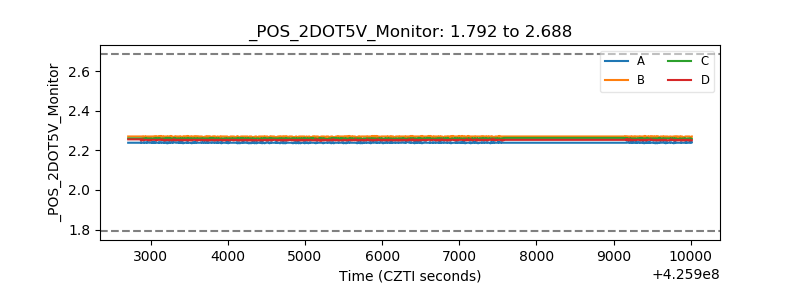 |
| +5 Volts monitor | 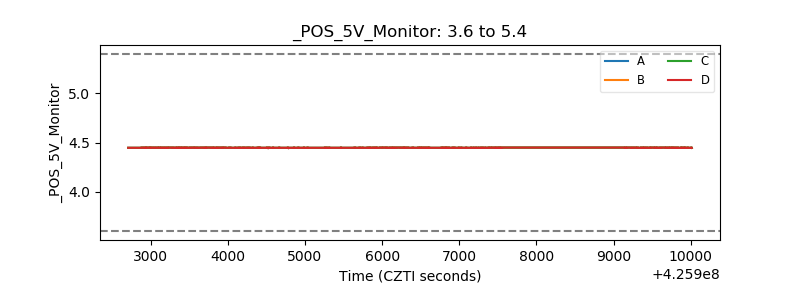 |
| _ROLL_ROT | 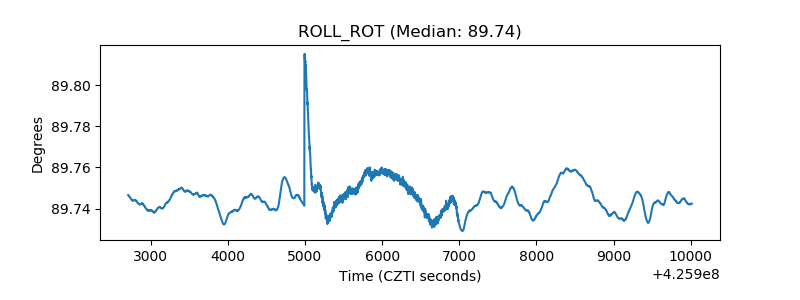 |
| _Roll_DEC | 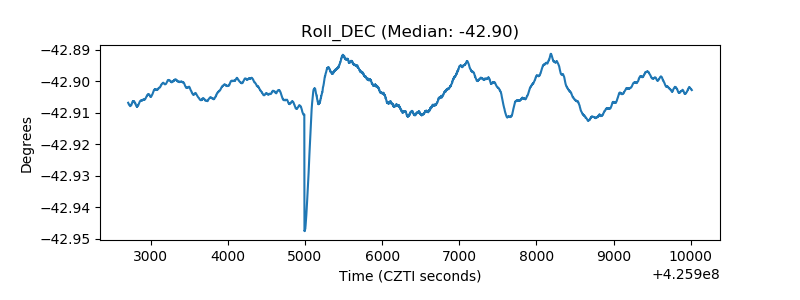 |
| _Roll_RA | 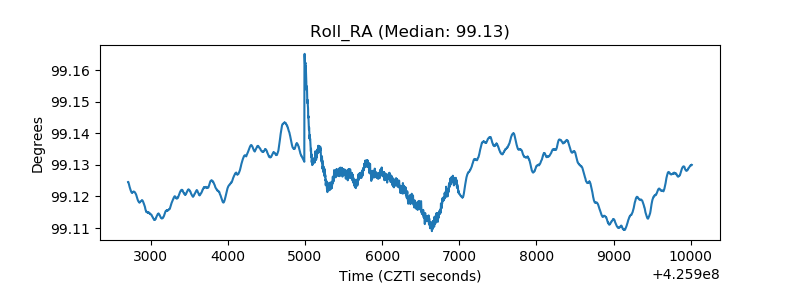 |
| Veto Counter | 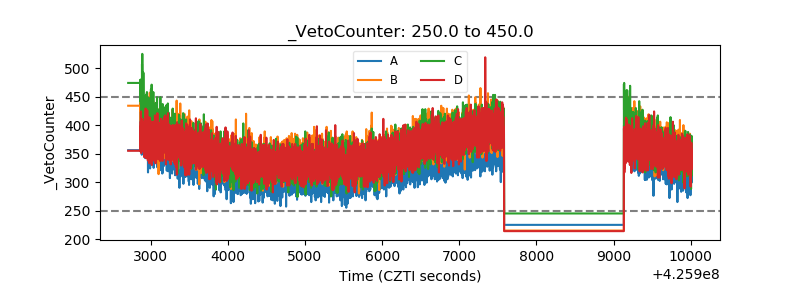 |