| Param | Original file | Final file |
|---|---|---|
| Filename | modeM0/AS1A12_099T03_9000005720_41943cztM0_level2.fits | modeM0/AS1A12_099T03_9000005720_41943cztM0_level2_quad_clean.evt |
| Size (bytes) | 386,274,240 | 91,771,200 |
| Size | 368.4 MB | 87.5 MB |
| Events in quadrant A | 3,037,134 | 634,850 |
| Events in quadrant B | 4,505,929 | 550,150 |
| Events in quadrant C | 2,697,691 | 622,082 |
| Events in quadrant D | 3,599,371 | 560,469 |
| Mode M0 | |||
|---|---|---|---|
| Quadrant | BADHDUFLAG | Total packets | Discarded packets |
| A | 0 | 12539 | 2 |
| B | 0 | 17661 | 2 |
| C | 0 | 11860 | 2 |
| D | 0 | 14822 | 2 |
| Mode SS | |||
|---|---|---|---|
| Quadrant | BADHDUFLAG | Total packets | Discarded packets |
| A | 0 | 120 | 0 |
| B | 0 | 120 | 0 |
| C | 0 | 120 | 0 |
| D | 0 | 120 | 0 |
| Mode M9 | |||
|---|---|---|---|
| Quadrant | BADHDUFLAG | Total packets | Discarded packets |
| A | 0 | 13 | 0 |
| B | 0 | 14 | 0 |
| C | 0 | 14 | 0 |
| D | 0 | 14 | 0 |
| Quadrant | Total seconds | Saturated seconds | Saturation percentage |
|---|---|---|---|
| A | 5882 | 11 | 0.187011% |
| B | 5881 | 871 | 14.810406% |
| C | 5881 | 5 | 0.085020% |
| D | 5881 | 231 | 3.927903% |
Noise dominated data is calculated using 1-second bins in cleaned event files. If a bin has >2000 counts, and if more than 50% of those come from <1% of pixels, then it is considered to be noise-dominated and hence unusable.
| Quadrant | # 1 sec bins | Bins with >0 counts | Bins with >2000 counts | High rate bins dominated by noise | Noise dominated (total time) | Noise dominated (detector-on time) | Marked lightcurve |
|---|---|---|---|---|---|---|---|
| A | 7195 | 5883 | 3 | 3 | 0.04% | 0.05% | 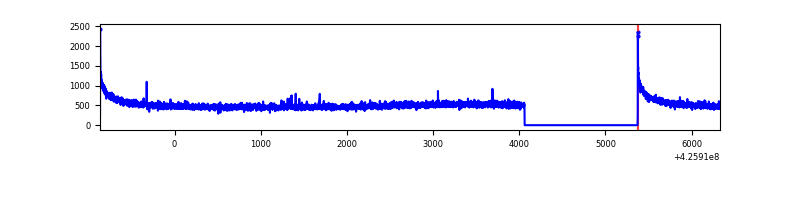 |
| B | 7194 | 5882 | 813 | 813 | 11.30% | 13.82% | 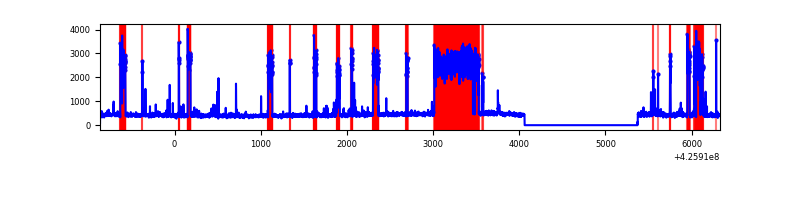 |
| C | 7194 | 5882 | 0 | 0 | 0.00% | 0.00% | 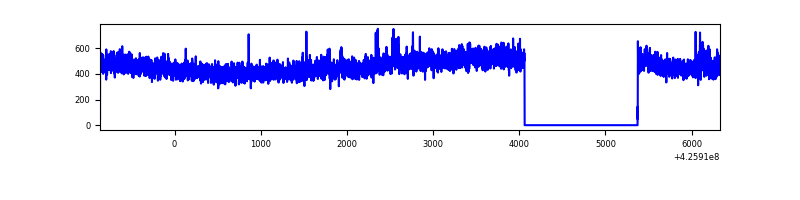 |
| D | 7194 | 5882 | 190 | 190 | 2.64% | 3.23% | 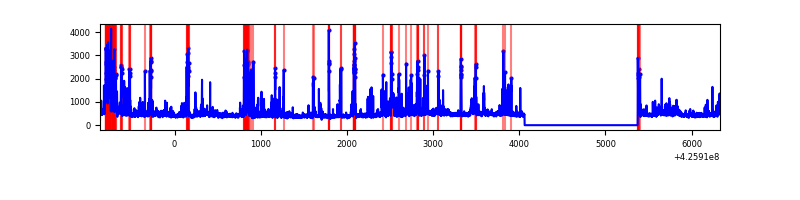 |
Top three noisy pixels from each quadrant. If the there are fewer than three noisy pixels in the level2.evt file, extra rows are filled as -1
| Pixel properties | Quadrant properties | ||||||
|---|---|---|---|---|---|---|---|
| Quadrant | DetID | PixID | Counts | Sigma | Mean | Median | Sigma |
| A | 10 | 83 | 568507 | 4345.88 | 635 | 620 | 130.7 |
| A | 13 | 254 | 8587 | 60.97 | 635 | 620 | 130.7 |
| A | 3 | 137 | 7240 | 50.66 | 635 | 620 | 130.7 |
| B | 7 | 202 | 1984668 | 17938.24 | 566 | 551 | 110.6 |
| B | 5 | 255 | 192082 | 1731.62 | 566 | 551 | 110.6 |
| B | 3 | 112 | 53746 | 480.93 | 566 | 551 | 110.6 |
| C | 15 | 214 | 244641 | 1689.64 | 615 | 618 | 144.4 |
| C | 0 | 239 | 45271 | 309.18 | 615 | 618 | 144.4 |
| C | 3 | 233 | 5758 | 35.59 | 615 | 618 | 144.4 |
| D | 13 | 249 | 534260 | 3624.01 | 609 | 595 | 147.3 |
| D | 2 | 249 | 194368 | 1315.87 | 609 | 595 | 147.3 |
| D | 10 | 199 | 136900 | 925.62 | 609 | 595 | 147.3 |
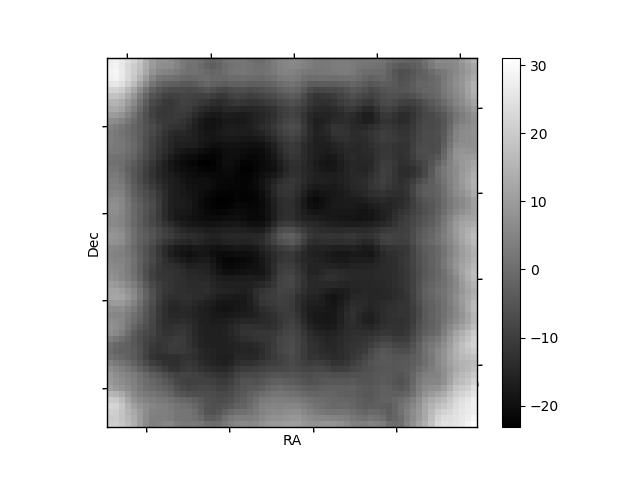
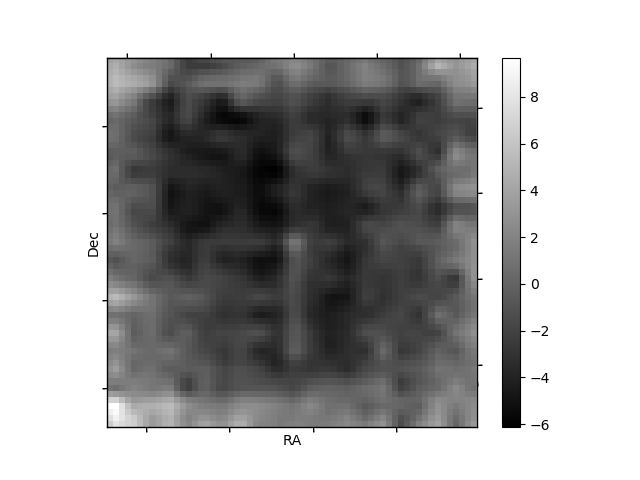
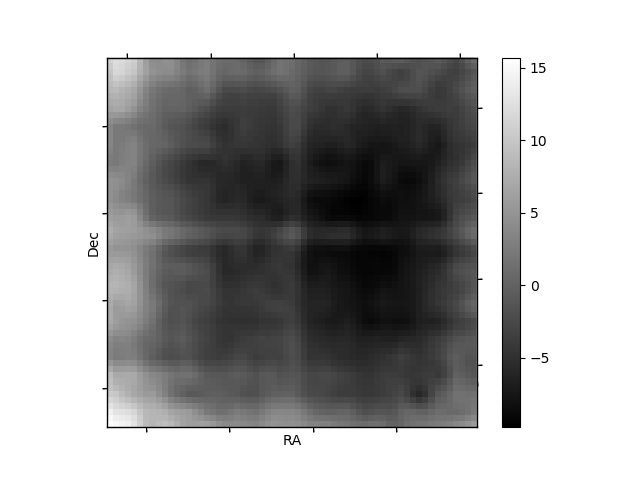
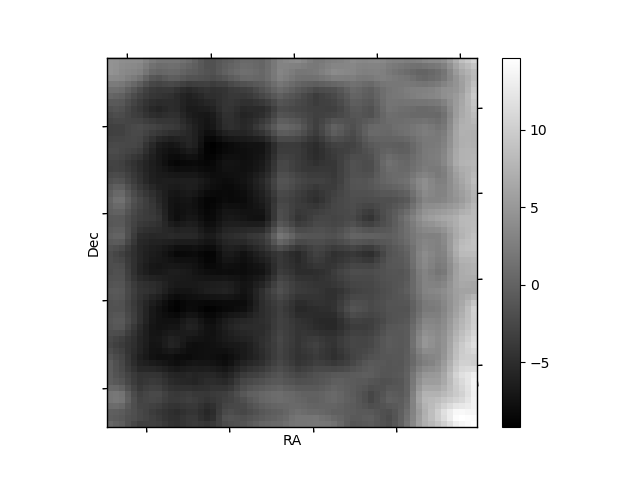
Histogram calculated using DETX and DETY for each event in the final _common_clean file
| Quadrant A | 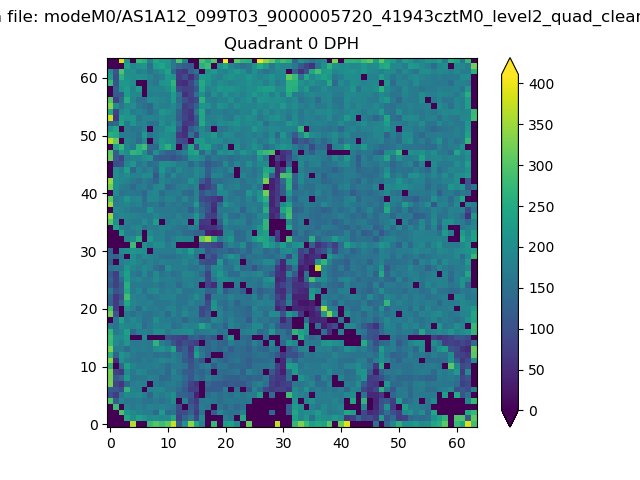 |
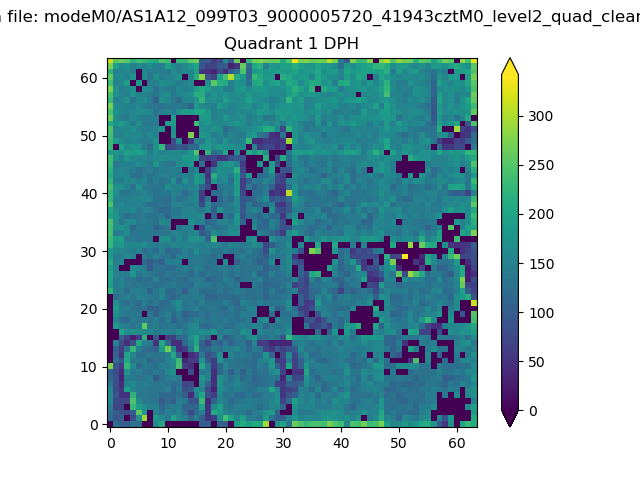 |
Quadrant B |
|---|---|---|---|
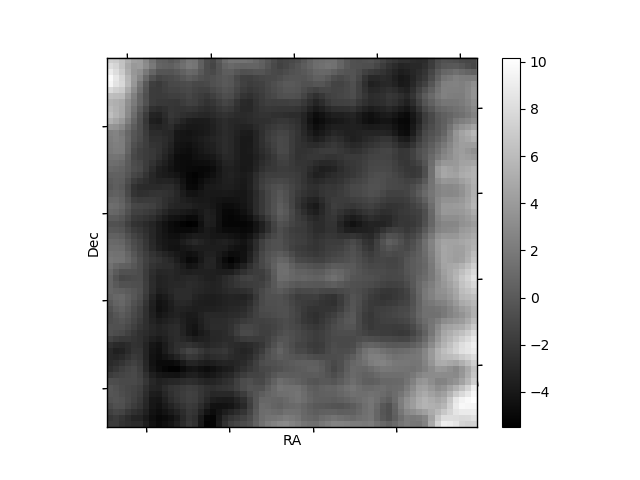
| Quadrant D | 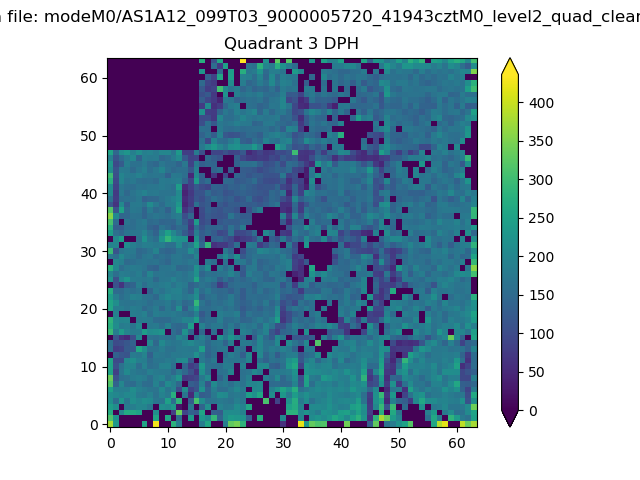 |
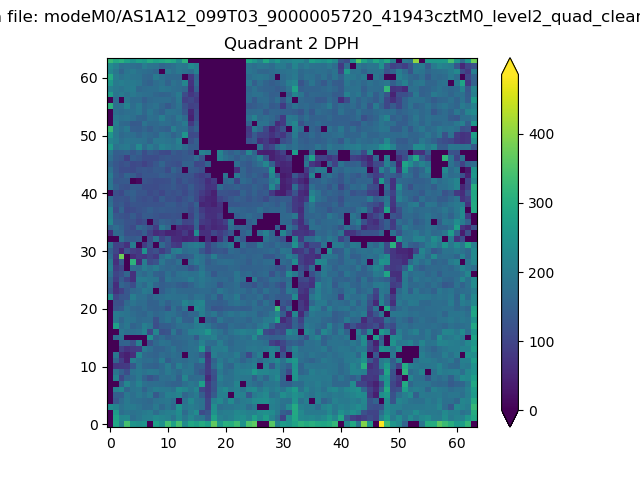 |
Quadrant C |
| Plot type | Count rate plots | Images |
|---|---|---|
| Comparison with Poisson distribution Blue bars denote a histogram of data divided into 1 sec bins. Red curve is a Poisson curve with rate = median count rate of data. |
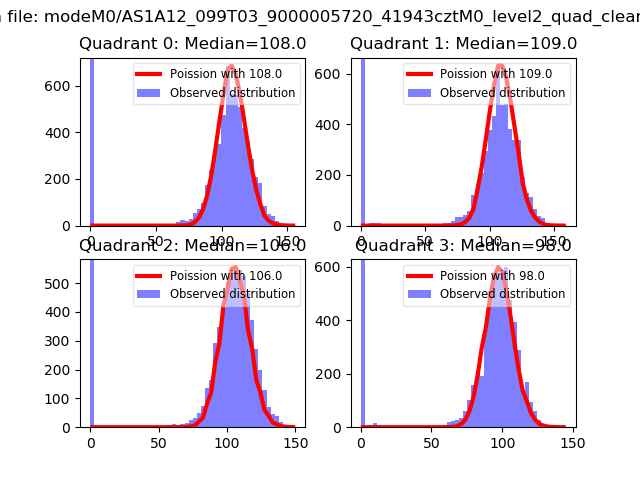 |
 |
| Quadrant-wise count rates Data is divided into 100 sec bins |
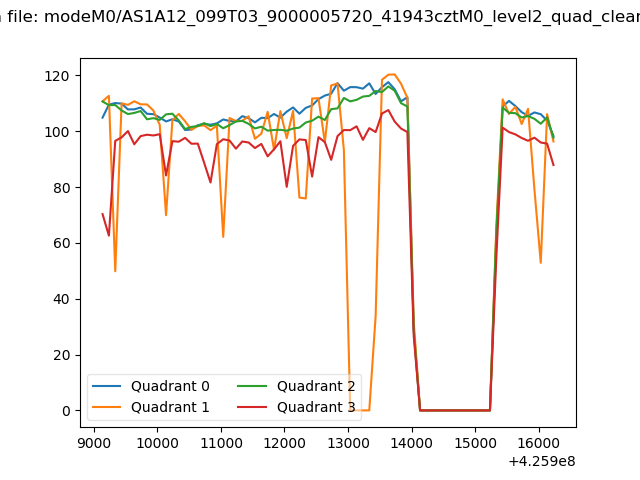 |
|
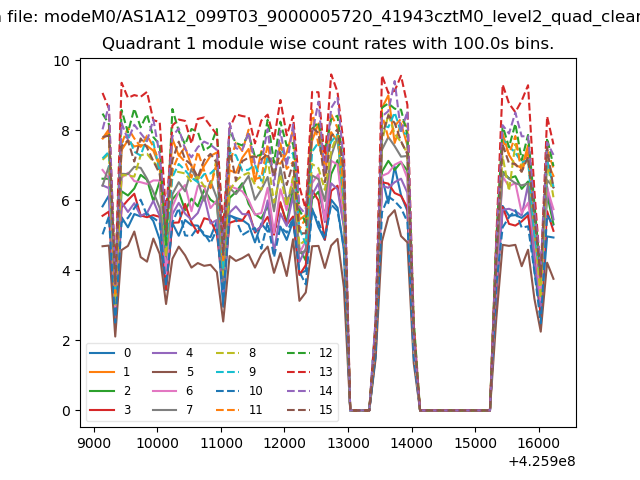
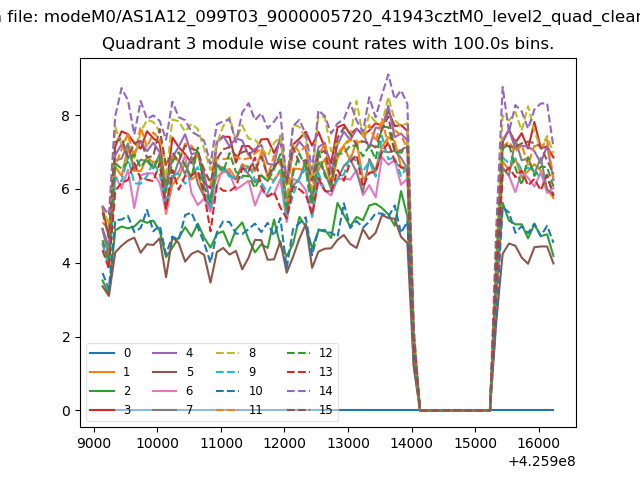
| Module-wise count rates for Quadrant A Data is divided into 100 sec bins |
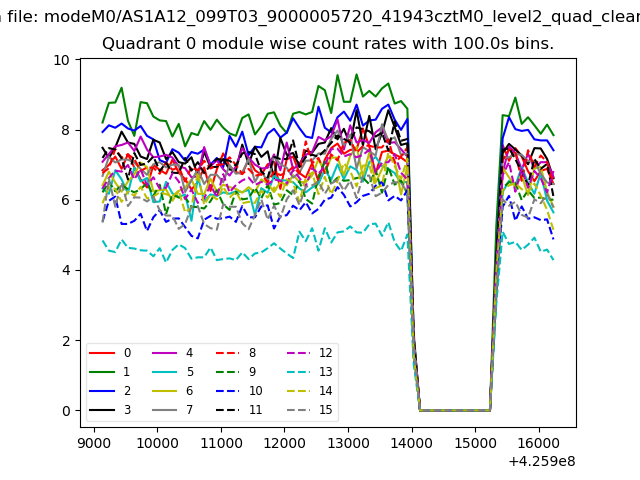 |
 |
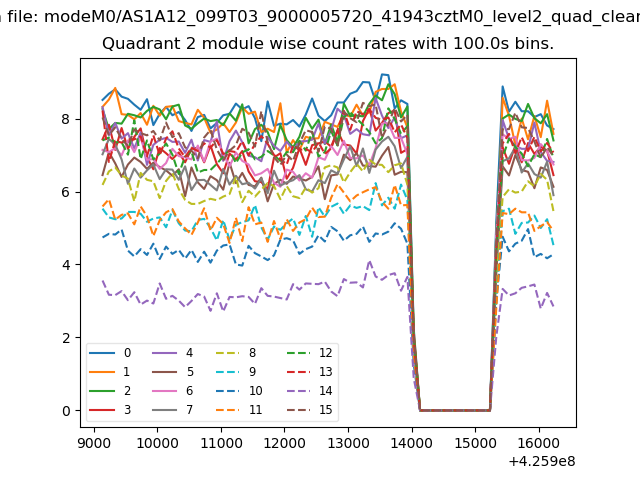
| Module-wise count rates for Quadrant B Data is divided into 100 sec bins |
 |
 |
| Module-wise count rates for Quadrant C Data is divided into 100 sec bins |
 |
 |
| Module-wise count rates for Quadrant D Data is divided into 100 sec bins |
 |
 |
| Parameter | Plot |
|---|---|
| CZT HV Monitor | 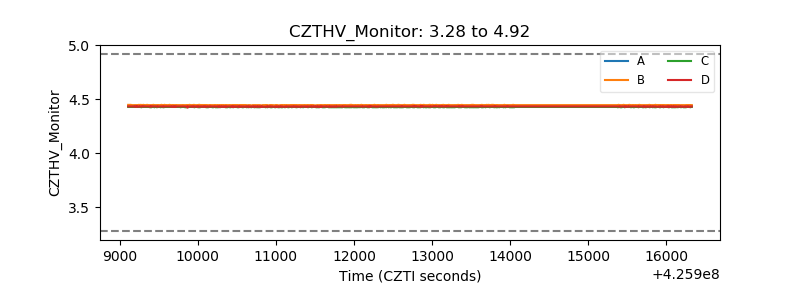 |
| D_VDD | 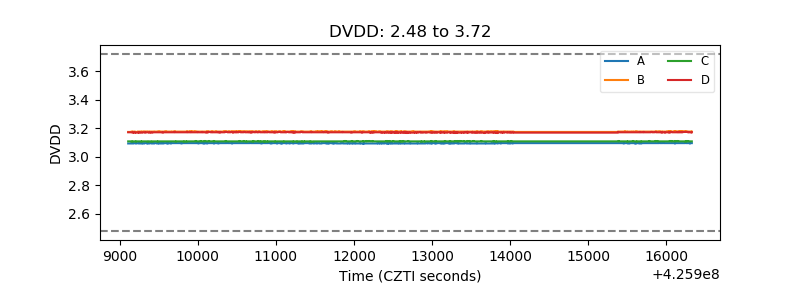 |
| Temperature 1 | 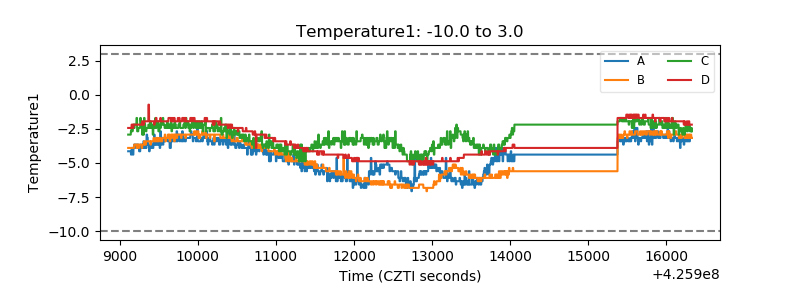 |
| Veto HV Monitor | 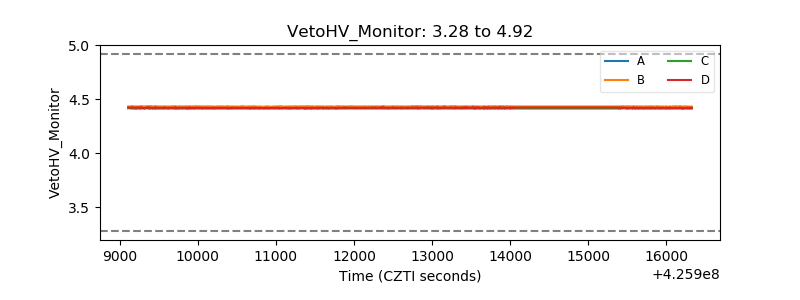 |
| Veto LLD | 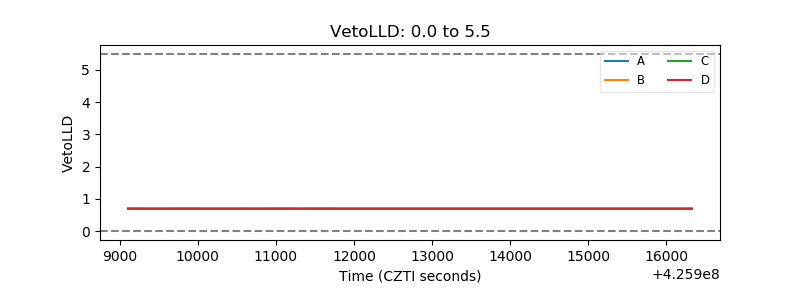 |
| Alpha Counter | 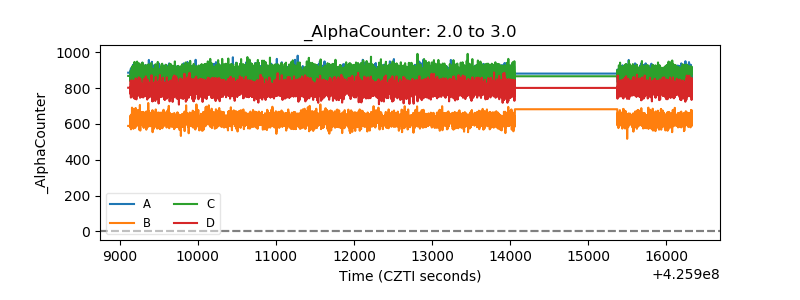 |
| _CPM_Rate | 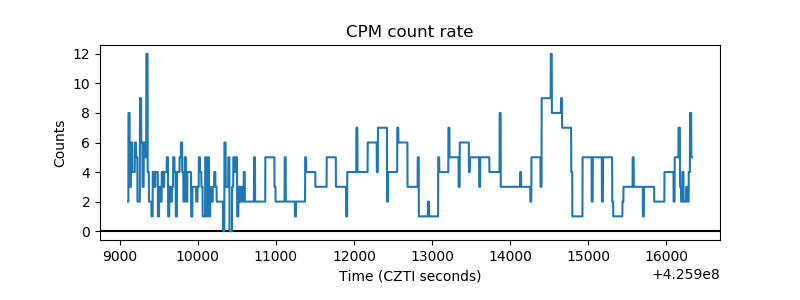 |
| CZT Counter | 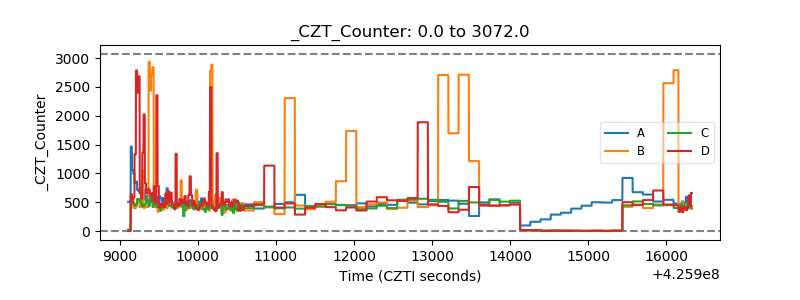 |
| +2.5 Volts monitor | 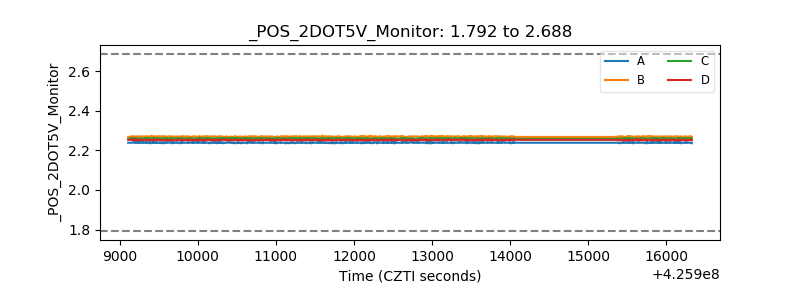 |
| +5 Volts monitor | 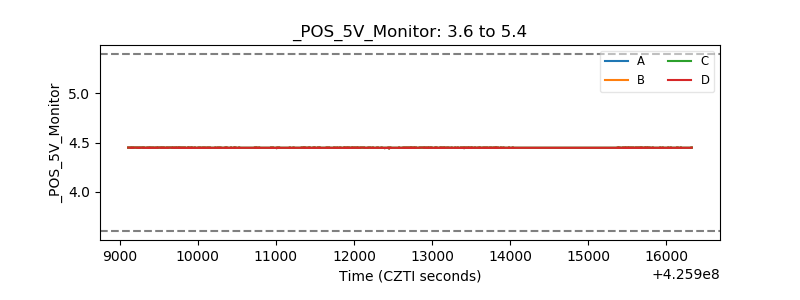 |
| _ROLL_ROT | 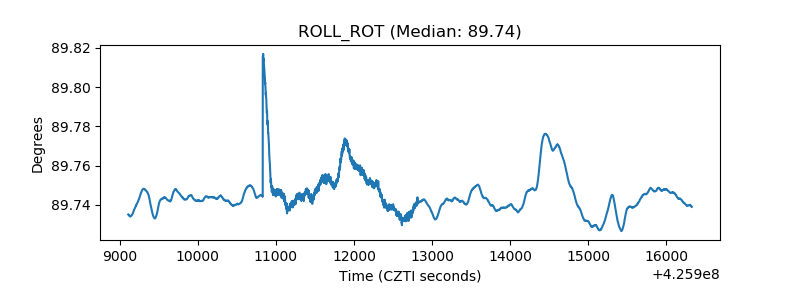 |
| _Roll_DEC | 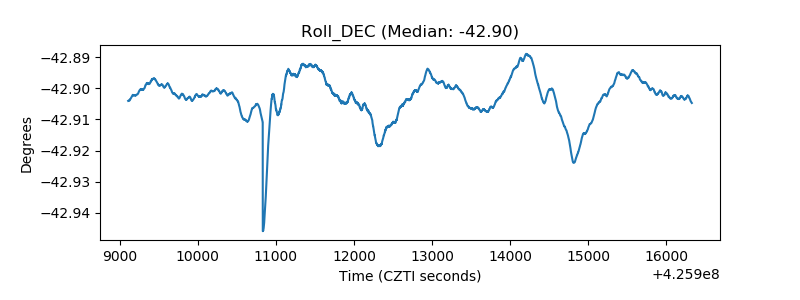 |
| _Roll_RA | 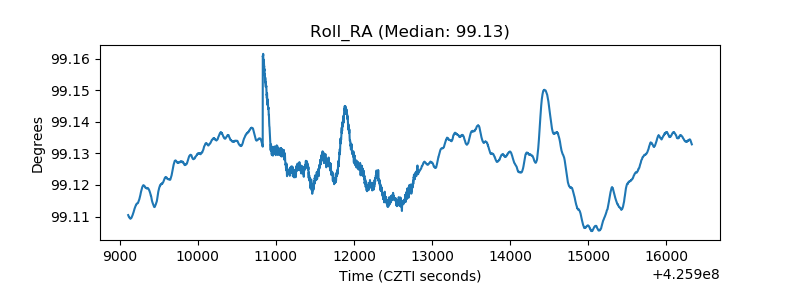 |
| Veto Counter | 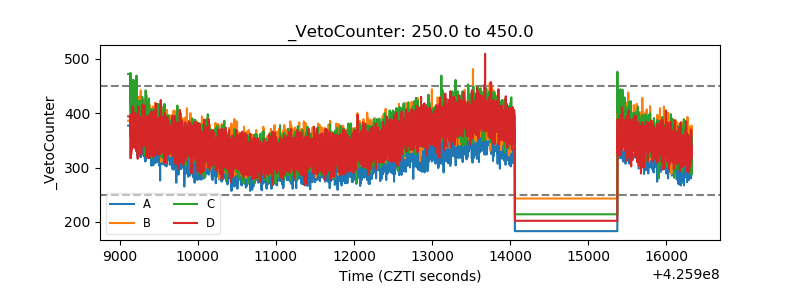 |