| Param | Original file | Final file |
|---|---|---|
| Filename | modeM0/AS1A12_099T03_9000005720_41944cztM0_level2.fits | modeM0/AS1A12_099T03_9000005720_41944cztM0_level2_quad_clean.evt |
| Size (bytes) | 358,672,320 | 96,537,600 |
| Size | 342.1 MB | 92.1 MB |
| Events in quadrant A | 3,127,217 | 648,599 |
| Events in quadrant B | 3,389,975 | 637,707 |
| Events in quadrant C | 2,776,938 | 632,697 |
| Events in quadrant D | 3,513,293 | 583,177 |
| Mode M0 | |||
|---|---|---|---|
| Quadrant | BADHDUFLAG | Total packets | Discarded packets |
| A | 0 | 12881 | 2 |
| B | 0 | 14401 | 3 |
| C | 0 | 12165 | 2 |
| D | 0 | 14618 | 2 |
| Mode SS | |||
|---|---|---|---|
| Quadrant | BADHDUFLAG | Total packets | Discarded packets |
| A | 0 | 122 | 0 |
| B | 0 | 122 | 0 |
| C | 0 | 122 | 0 |
| D | 0 | 122 | 0 |
| Mode M9 | |||
|---|---|---|---|
| Quadrant | BADHDUFLAG | Total packets | Discarded packets |
| A | 0 | 14 | 0 |
| B | 0 | 15 | 0 |
| C | 0 | 15 | 0 |
| D | 0 | 15 | 0 |
| Quadrant | Total seconds | Saturated seconds | Saturation percentage |
|---|---|---|---|
| A | 6028 | 10 | 0.165893% |
| B | 6027 | 245 | 4.065041% |
| C | 6027 | 5 | 0.082960% |
| D | 6027 | 103 | 1.708976% |
Noise dominated data is calculated using 1-second bins in cleaned event files. If a bin has >2000 counts, and if more than 50% of those come from <1% of pixels, then it is considered to be noise-dominated and hence unusable.
| Quadrant | # 1 sec bins | Bins with >0 counts | Bins with >2000 counts | High rate bins dominated by noise | Noise dominated (total time) | Noise dominated (detector-on time) | Marked lightcurve |
|---|---|---|---|---|---|---|---|
| A | 7310 | 6029 | 4 | 4 | 0.05% | 0.07% | 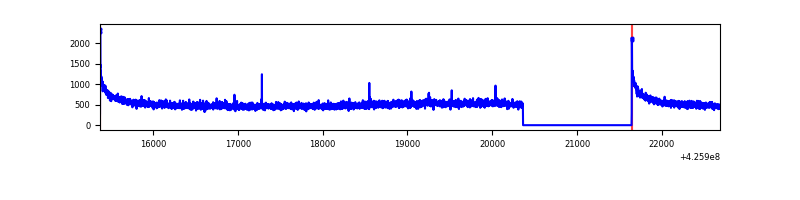 |
| B | 7309 | 6028 | 181 | 181 | 2.48% | 3.00% | 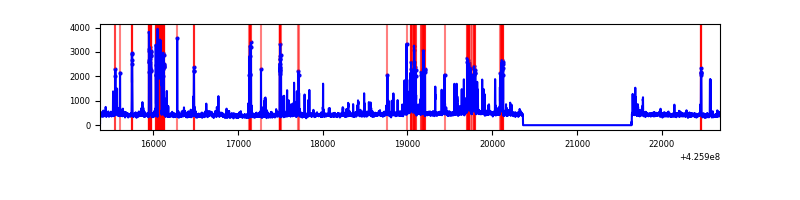 |
| C | 7309 | 6028 | 0 | 0 | 0.00% | 0.00% | 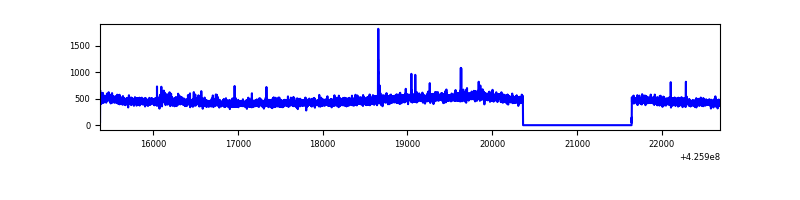 |
| D | 7309 | 6028 | 121 | 121 | 1.66% | 2.01% | 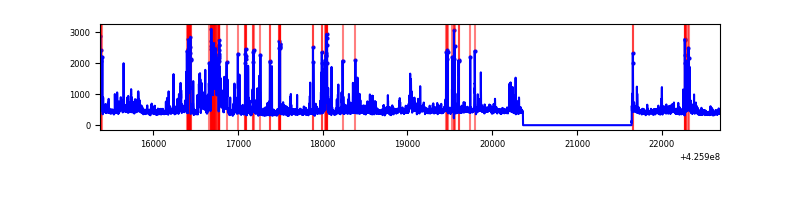 |
Top three noisy pixels from each quadrant. If the there are fewer than three noisy pixels in the level2.evt file, extra rows are filled as -1
| Pixel properties | Quadrant properties | ||||||
|---|---|---|---|---|---|---|---|
| Quadrant | DetID | PixID | Counts | Sigma | Mean | Median | Sigma |
| A | 10 | 83 | 586070 | 4349.13 | 651 | 638 | 134.6 |
| A | 13 | 254 | 9019 | 62.26 | 651 | 638 | 134.6 |
| A | 2 | 79 | 8709 | 59.96 | 651 | 638 | 134.6 |
| B | 5 | 255 | 378268 | 3054.18 | 632 | 614 | 123.7 |
| B | 0 | 229 | 298072 | 2405.61 | 632 | 614 | 123.7 |
| B | 7 | 202 | 180465 | 1454.5 | 632 | 614 | 123.7 |
| C | 15 | 214 | 266514 | 1809.22 | 631 | 635 | 147.0 |
| C | 0 | 239 | 25117 | 166.59 | 631 | 635 | 147.0 |
| C | 3 | 233 | 16123 | 105.39 | 631 | 635 | 147.0 |
| D | 13 | 249 | 482657 | 3146.69 | 630 | 612 | 153.2 |
| D | 2 | 249 | 119202 | 774.13 | 630 | 612 | 153.2 |
| D | 1 | 52 | 115334 | 748.88 | 630 | 612 | 153.2 |
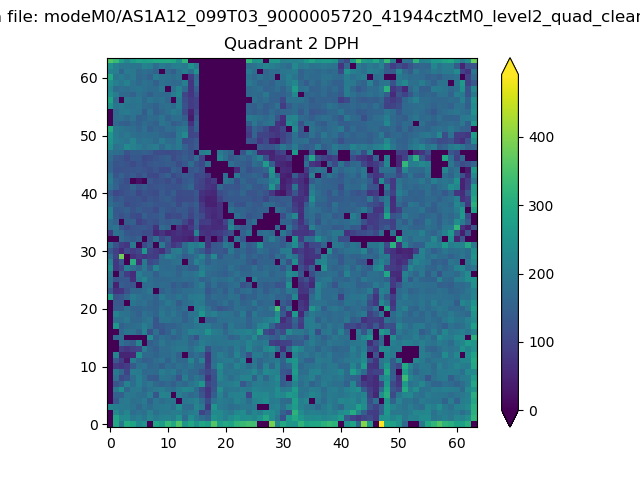
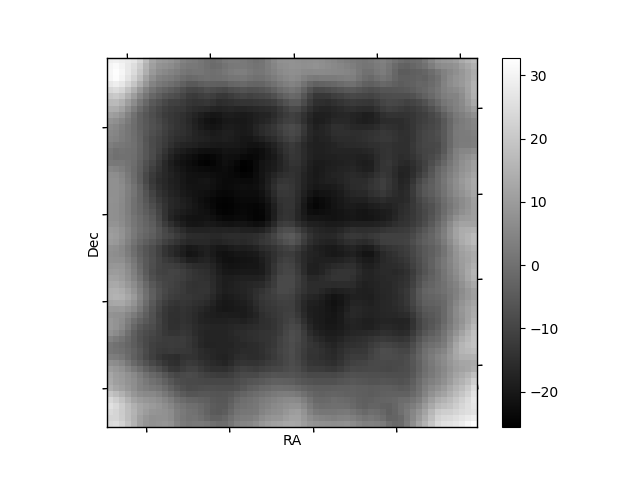
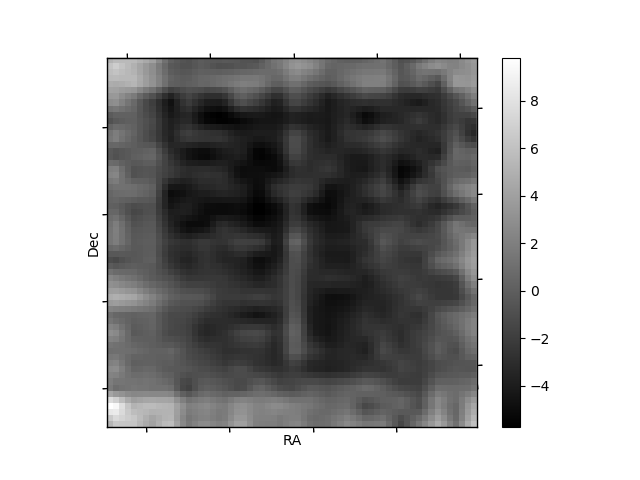
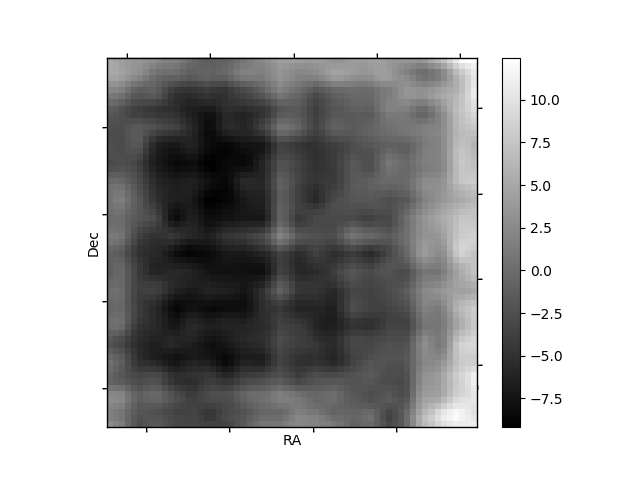
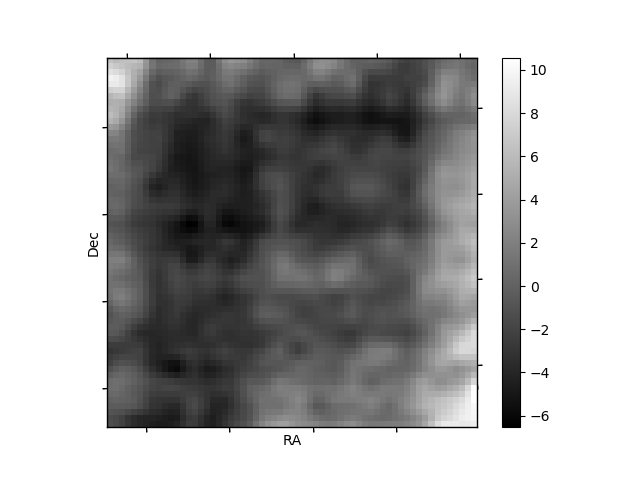
Histogram calculated using DETX and DETY for each event in the final _common_clean file
| Quadrant A | 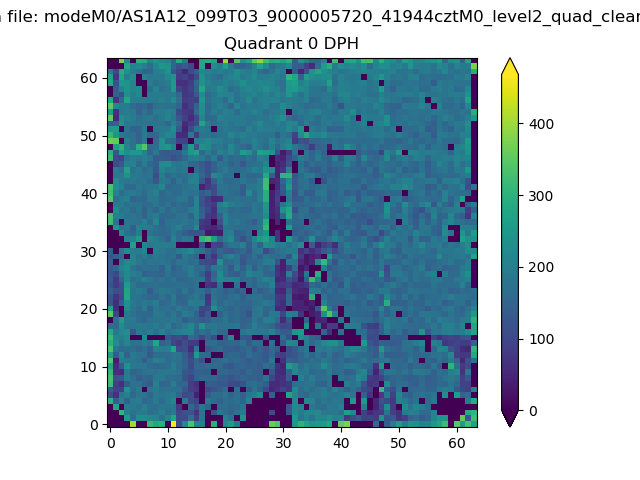 |
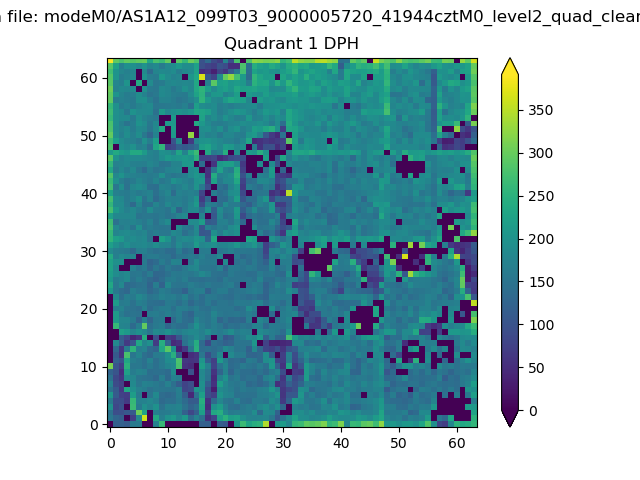 |
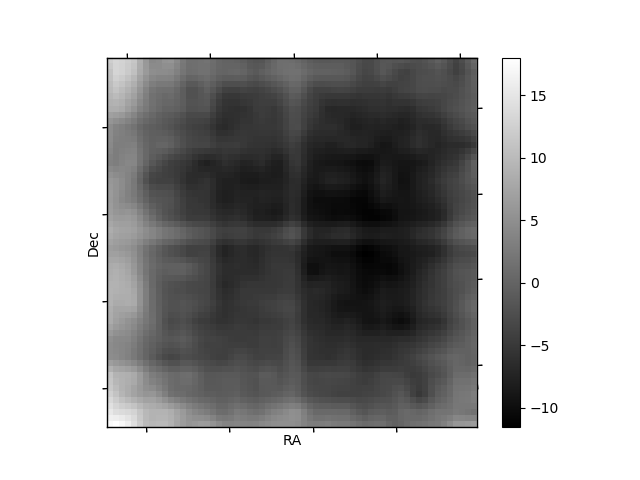
Quadrant B |
|---|---|---|---|
| Quadrant D | 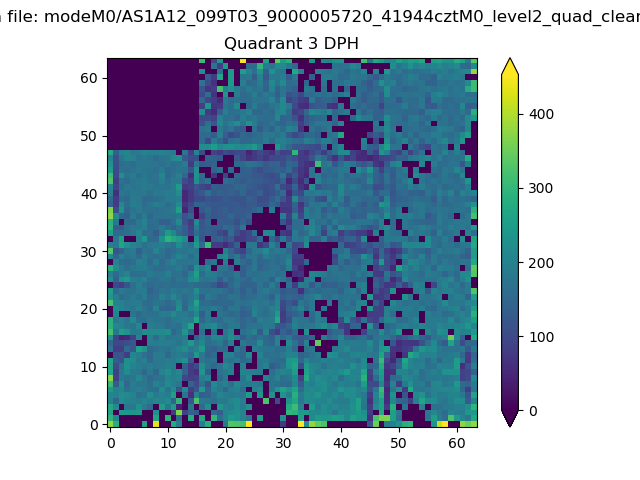 |
 |
Quadrant C |
| Plot type | Count rate plots | Images |
|---|---|---|
| Comparison with Poisson distribution Blue bars denote a histogram of data divided into 1 sec bins. Red curve is a Poisson curve with rate = median count rate of data. |
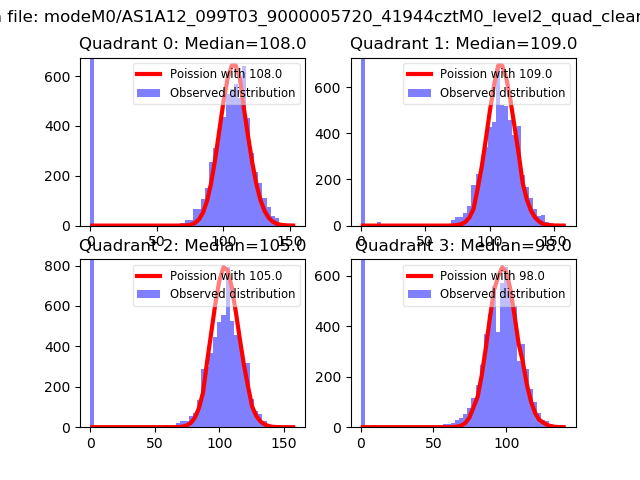 |
 |
| Quadrant-wise count rates Data is divided into 100 sec bins |
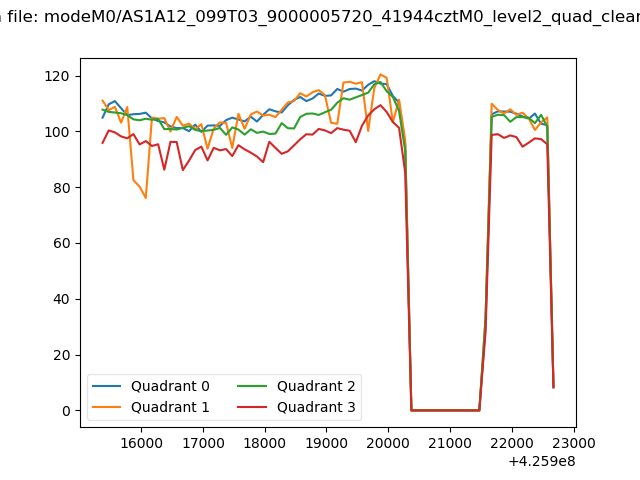 |
|
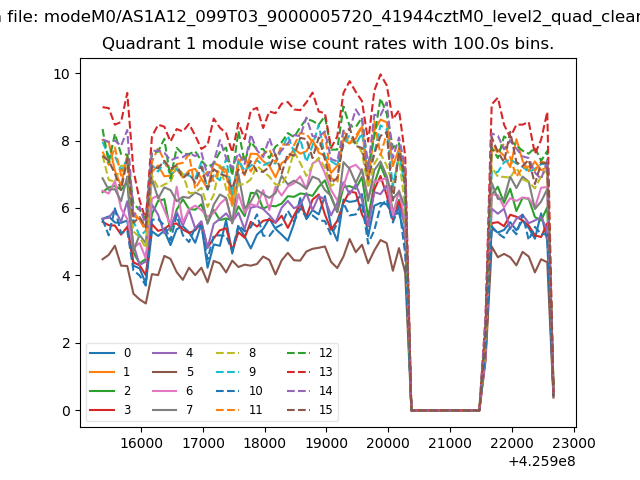
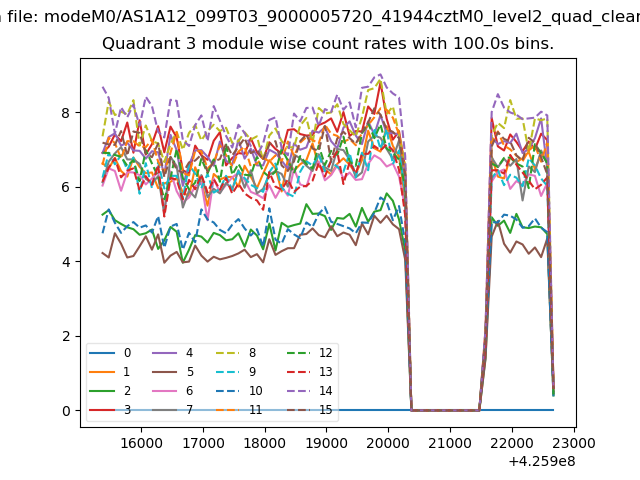
| Module-wise count rates for Quadrant A Data is divided into 100 sec bins |
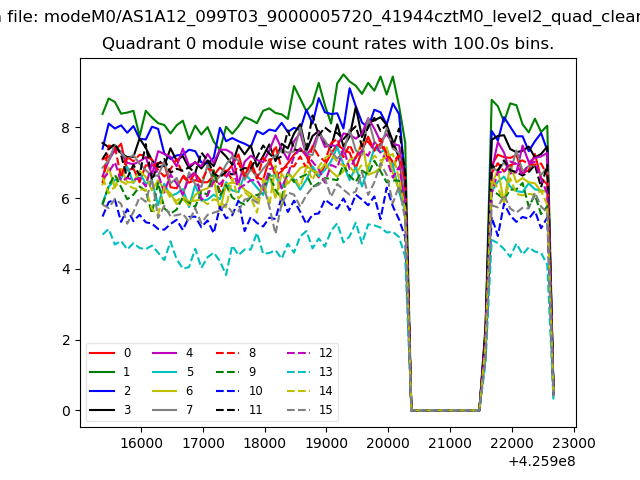 |
 |
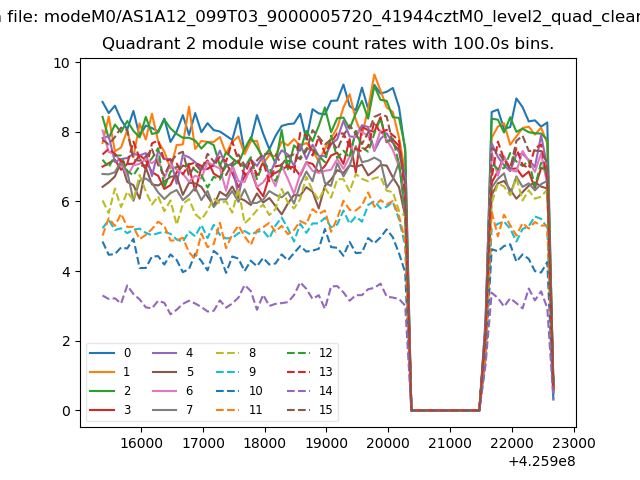
| Module-wise count rates for Quadrant B Data is divided into 100 sec bins |
 |
 |
| Module-wise count rates for Quadrant C Data is divided into 100 sec bins |
 |
 |
| Module-wise count rates for Quadrant D Data is divided into 100 sec bins |
 |
 |
| Parameter | Plot |
|---|---|
| CZT HV Monitor | 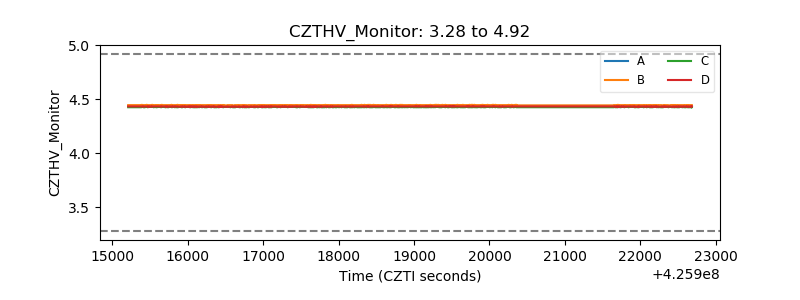 |
| D_VDD | 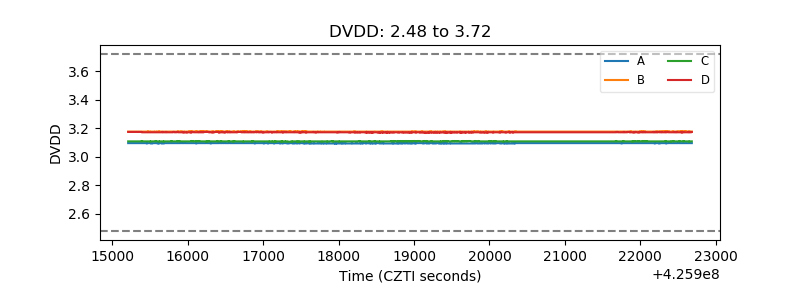 |
| Temperature 1 | 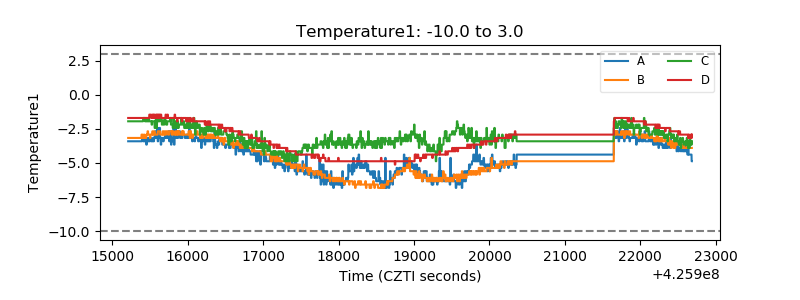 |
| Veto HV Monitor | 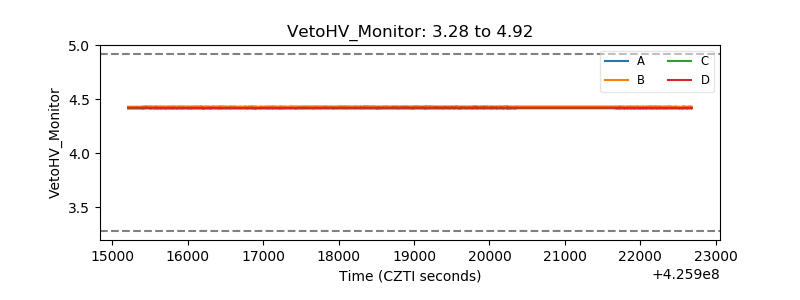 |
| Veto LLD | 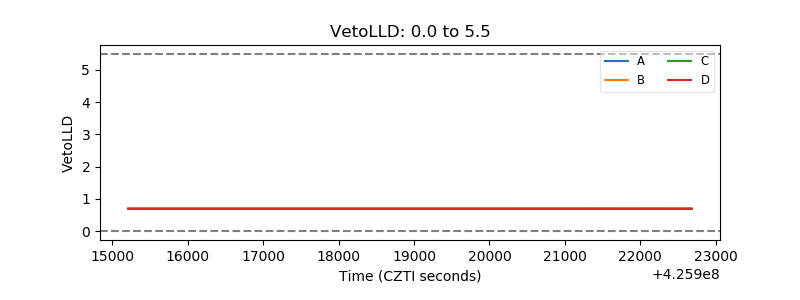 |
| Alpha Counter |  |
| _CPM_Rate | 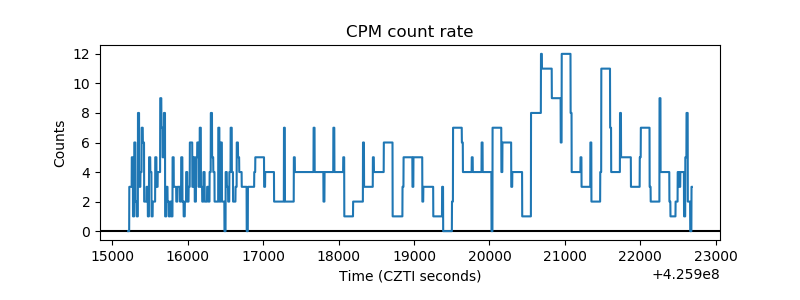 |
| CZT Counter | 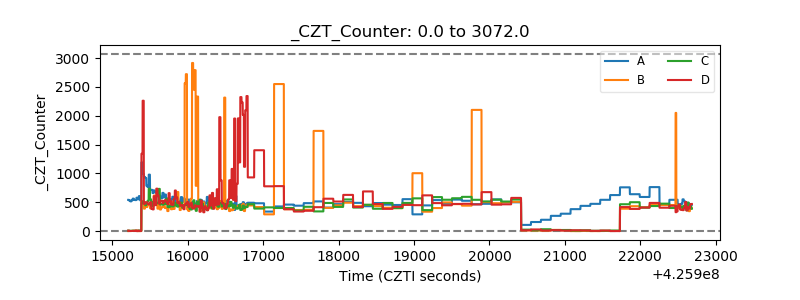 |
| +2.5 Volts monitor | 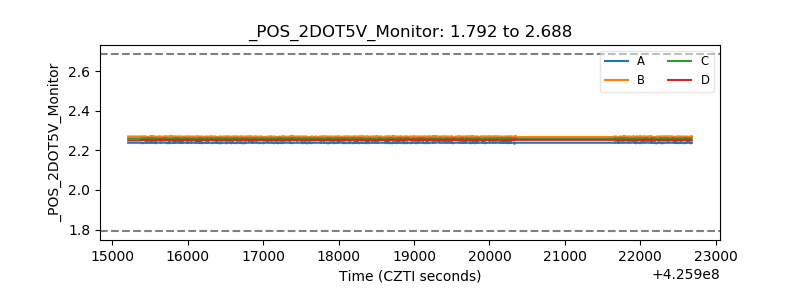 |
| +5 Volts monitor | 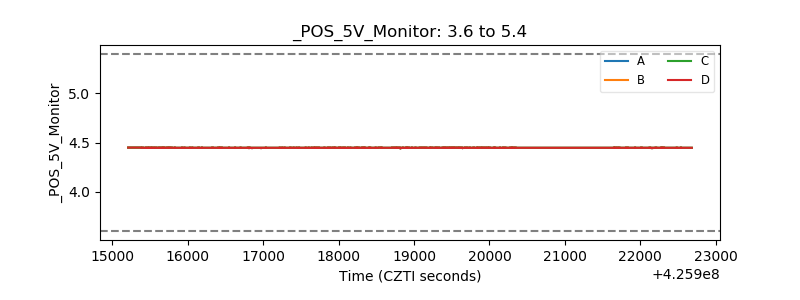 |
| _ROLL_ROT | 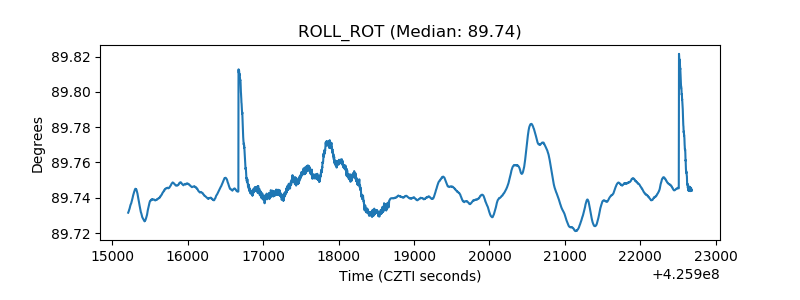 |
| _Roll_DEC | 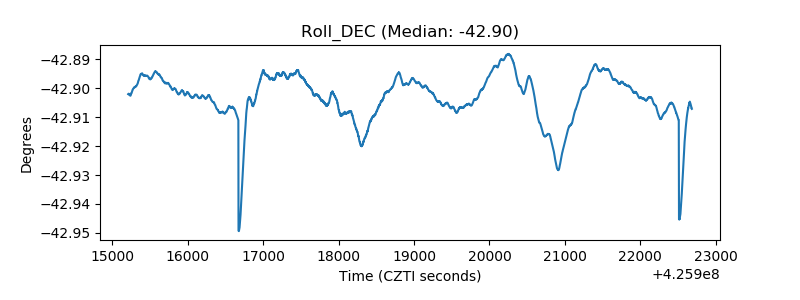 |
| _Roll_RA | 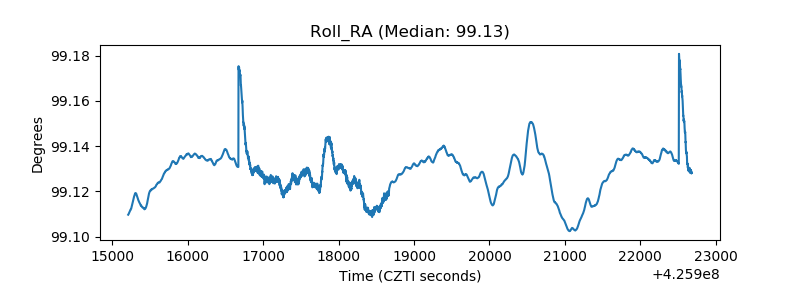 |
| Veto Counter | 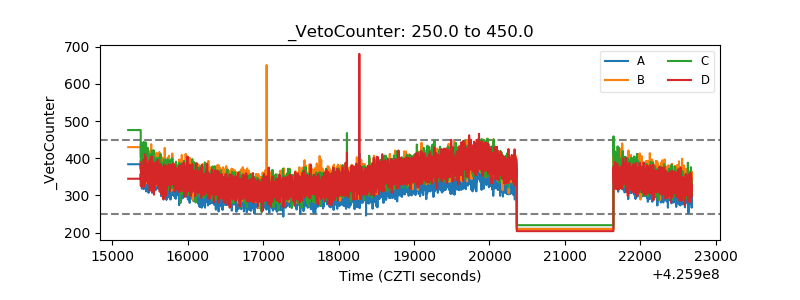 |