| Param | Original file | Final file |
|---|---|---|
| Filename | modeM0/AS1A12_099T03_9000005720_41946cztM0_level2.fits | modeM0/AS1A12_099T03_9000005720_41946cztM0_level2_quad_clean.evt |
| Size (bytes) | 686,681,280 | 169,104,960 |
| Size | 654.9 MB | 161.3 MB |
| Events in quadrant A | 5,516,609 | 1,145,158 |
| Events in quadrant B | 6,390,939 | 1,120,486 |
| Events in quadrant C | 5,155,298 | 1,109,233 |
| Events in quadrant D | 7,521,616 | 1,000,690 |
| Mode M0 | |||
|---|---|---|---|
| Quadrant | BADHDUFLAG | Total packets | Discarded packets |
| A | 0 | 22773 | 3 |
| B | 0 | 26602 | 3 |
| C | 0 | 22304 | 3 |
| D | 0 | 29824 | 9 |
| Mode SS | |||
|---|---|---|---|
| Quadrant | BADHDUFLAG | Total packets | Discarded packets |
| A | 0 | 218 | 0 |
| B | 0 | 218 | 0 |
| C | 0 | 218 | 0 |
| D | 0 | 218 | 0 |
| Mode M9 | |||
|---|---|---|---|
| Quadrant | BADHDUFLAG | Total packets | Discarded packets |
| A | 0 | 31 | 0 |
| B | 0 | 32 | 0 |
| C | 0 | 32 | 0 |
| D | 0 | 32 | 0 |
| Quadrant | Total seconds | Saturated seconds | Saturation percentage |
|---|---|---|---|
| A | 10754 | 25 | 0.232472% |
| B | 10754 | 493 | 4.584341% |
| C | 10754 | 36 | 0.334759% |
| D | 10753 | 490 | 4.556868% |
Noise dominated data is calculated using 1-second bins in cleaned event files. If a bin has >2000 counts, and if more than 50% of those come from <1% of pixels, then it is considered to be noise-dominated and hence unusable.
| Quadrant | # 1 sec bins | Bins with >0 counts | Bins with >2000 counts | High rate bins dominated by noise | Noise dominated (total time) | Noise dominated (detector-on time) | Marked lightcurve |
|---|---|---|---|---|---|---|---|
| A | 13529 | 10756 | 8 | 8 | 0.06% | 0.07% | 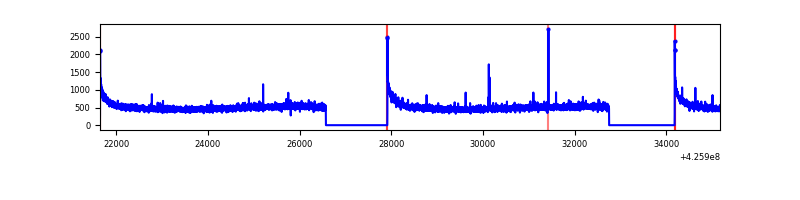 |
| B | 13529 | 10756 | 368 | 368 | 2.72% | 3.42% | 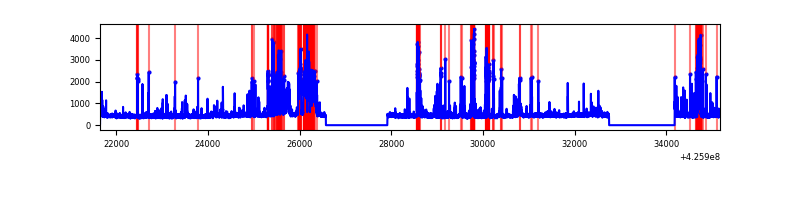 |
| C | 13529 | 10756 | 24 | 24 | 0.18% | 0.22% | 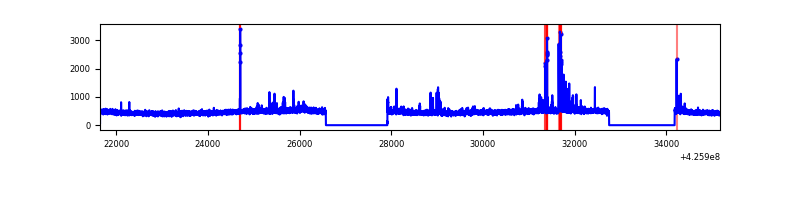 |
| D | 13528 | 10755 | 475 | 475 | 3.51% | 4.42% | 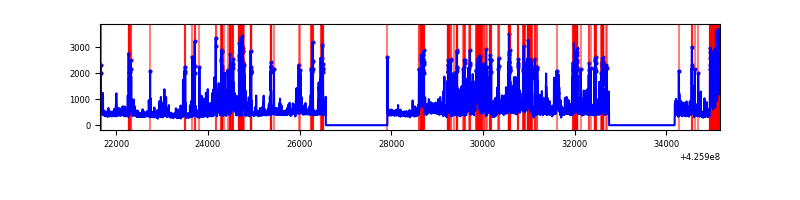 |
Top three noisy pixels from each quadrant. If the there are fewer than three noisy pixels in the level2.evt file, extra rows are filled as -1
| Pixel properties | Quadrant properties | ||||||
|---|---|---|---|---|---|---|---|
| Quadrant | DetID | PixID | Counts | Sigma | Mean | Median | Sigma |
| A | 10 | 83 | 982954 | 4138.03 | 1163 | 1138 | 237.3 |
| A | 14 | 250 | 15395 | 60.09 | 1163 | 1138 | 237.3 |
| A | 13 | 254 | 14899 | 58.0 | 1163 | 1138 | 237.3 |
| B | 0 | 229 | 1202056 | 5519.07 | 1126 | 1093 | 217.6 |
| B | 5 | 255 | 641589 | 2943.42 | 1126 | 1093 | 217.6 |
| B | 0 | 190 | 74468 | 337.2 | 1126 | 1093 | 217.6 |
| C | 15 | 214 | 470124 | 1775.46 | 1131 | 1138 | 264.1 |
| C | 14 | 254 | 217181 | 817.88 | 1131 | 1138 | 264.1 |
| C | 10 | 22 | 25247 | 91.27 | 1131 | 1138 | 264.1 |
| D | 2 | 249 | 1088285 | 3969.72 | 1117 | 1086 | 273.9 |
| D | 5 | 222 | 826498 | 3013.85 | 1117 | 1086 | 273.9 |
| D | 13 | 249 | 525900 | 1916.27 | 1117 | 1086 | 273.9 |
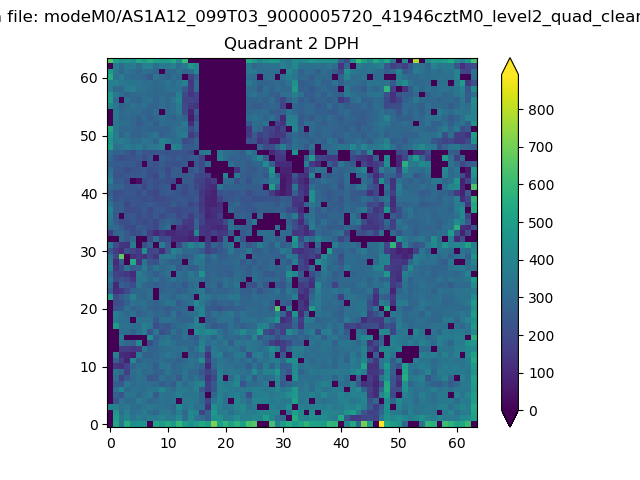
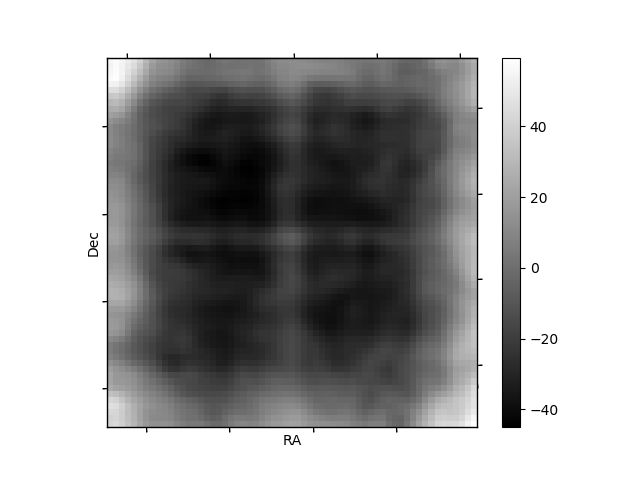
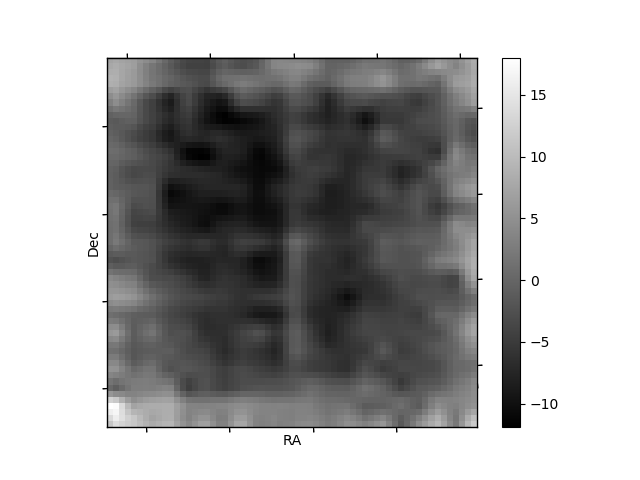
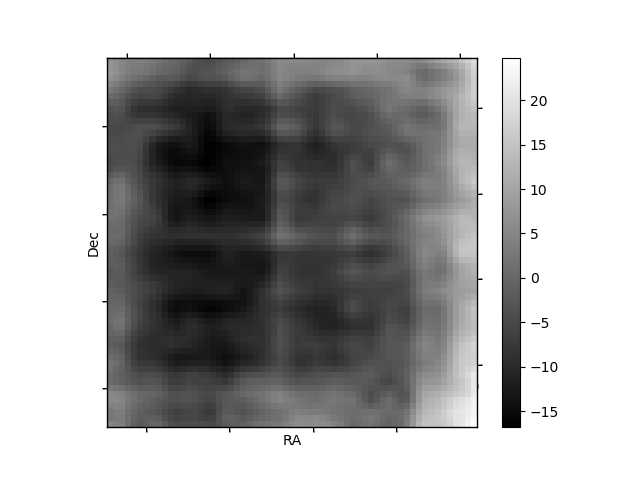
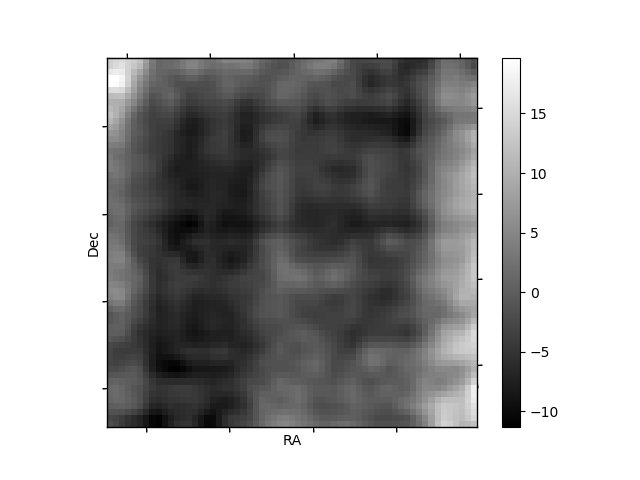
Histogram calculated using DETX and DETY for each event in the final _common_clean file
| Quadrant A | 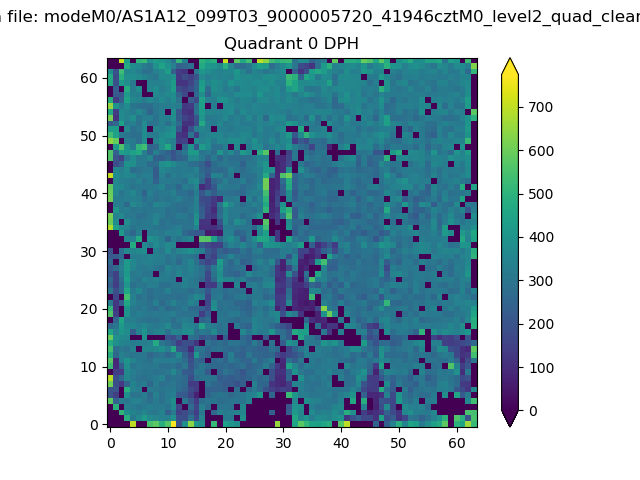 |
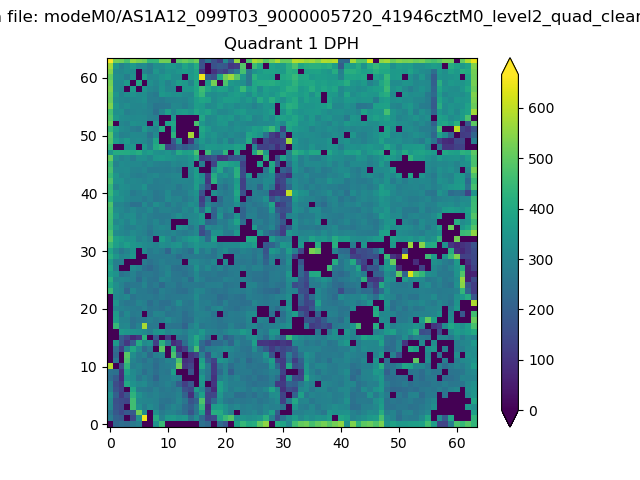 |
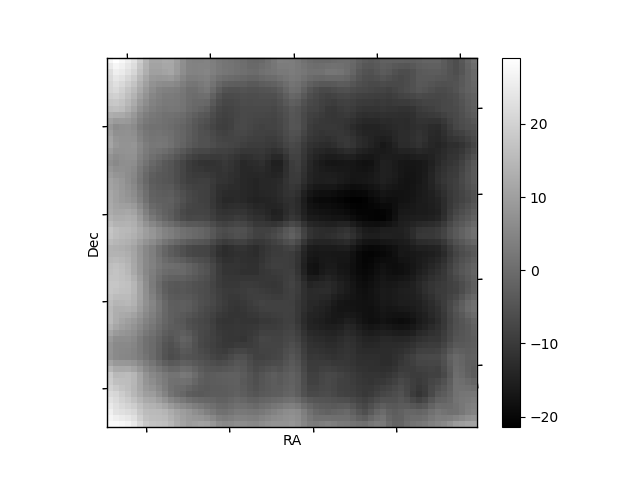
Quadrant B |
|---|---|---|---|
| Quadrant D | 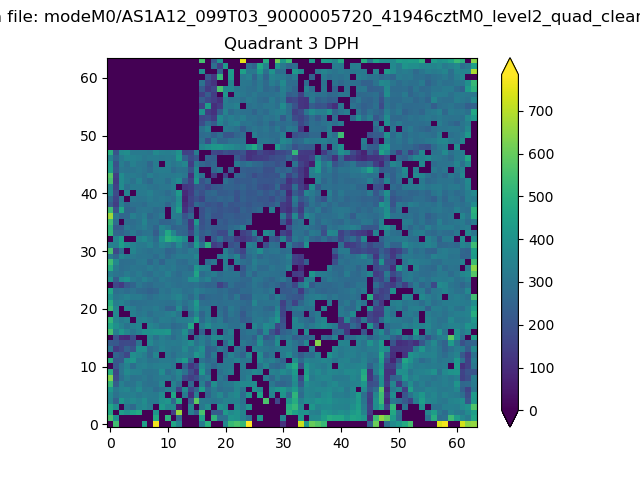 |
 |
Quadrant C |
| Plot type | Count rate plots | Images |
|---|---|---|
| Comparison with Poisson distribution Blue bars denote a histogram of data divided into 1 sec bins. Red curve is a Poisson curve with rate = median count rate of data. |
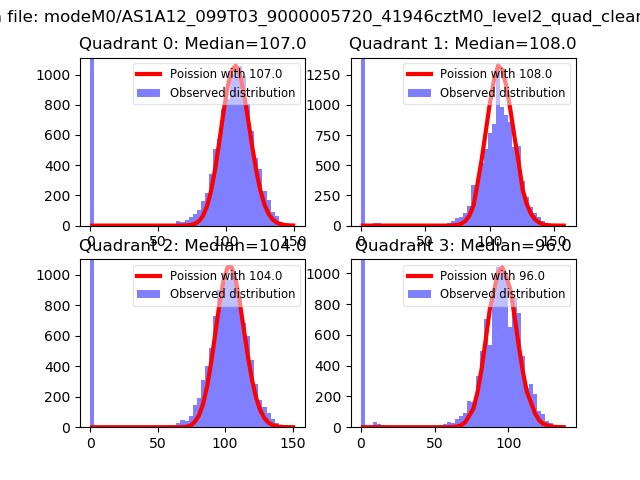 |
 |
| Quadrant-wise count rates Data is divided into 100 sec bins |
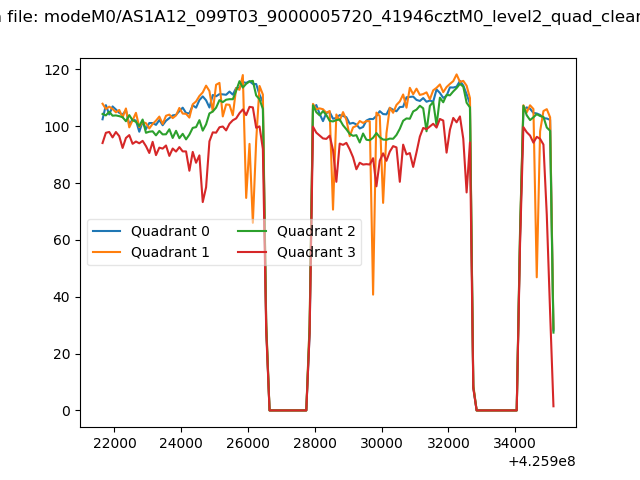 |
|
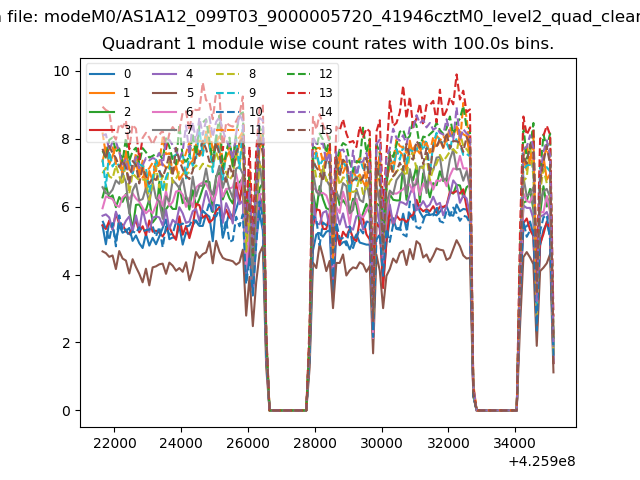
| Module-wise count rates for Quadrant A Data is divided into 100 sec bins |
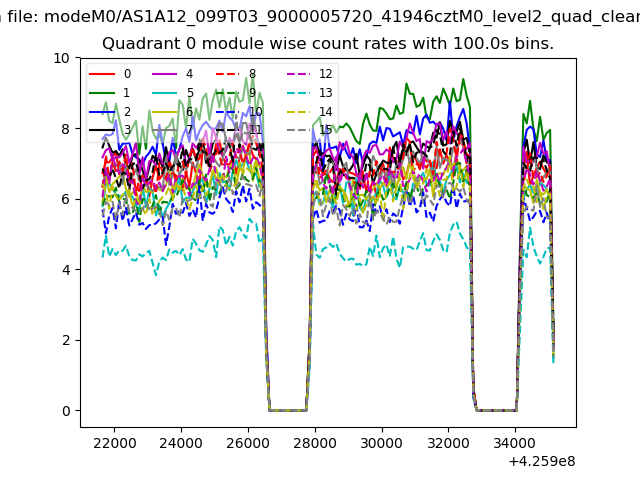 |
 |
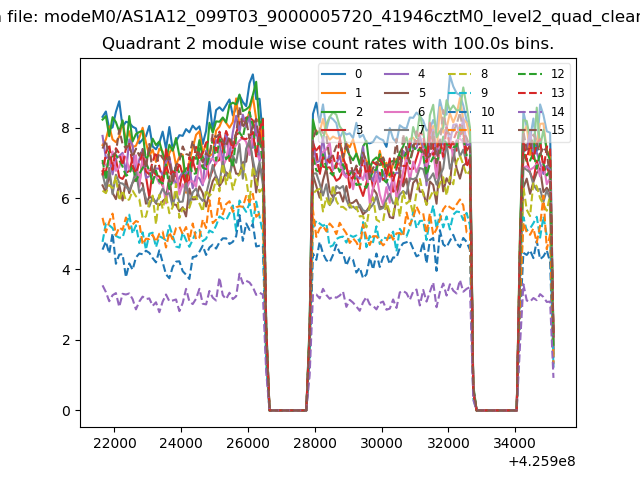
| Module-wise count rates for Quadrant B Data is divided into 100 sec bins |
 |
 |
| Module-wise count rates for Quadrant C Data is divided into 100 sec bins |
 |
 |
| Module-wise count rates for Quadrant D Data is divided into 100 sec bins |
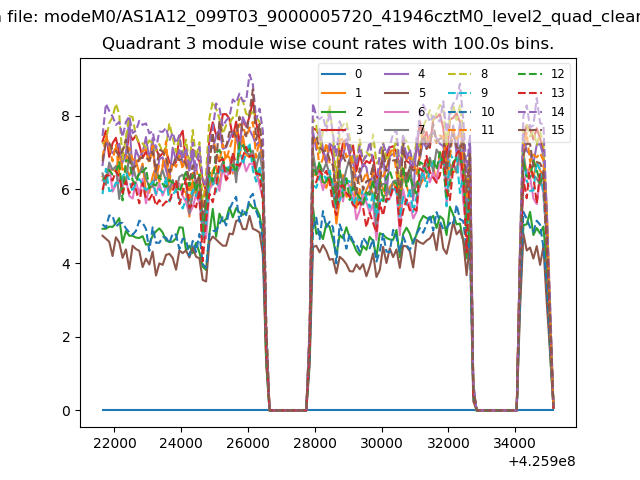 |
 |
| Parameter | Plot |
|---|---|
| CZT HV Monitor | 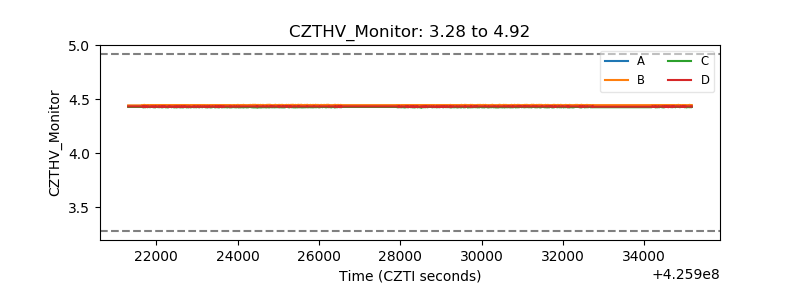 |
| D_VDD | 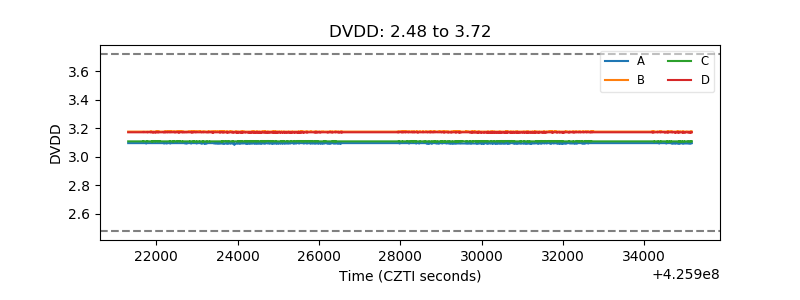 |
| Temperature 1 |  |
| Veto HV Monitor | 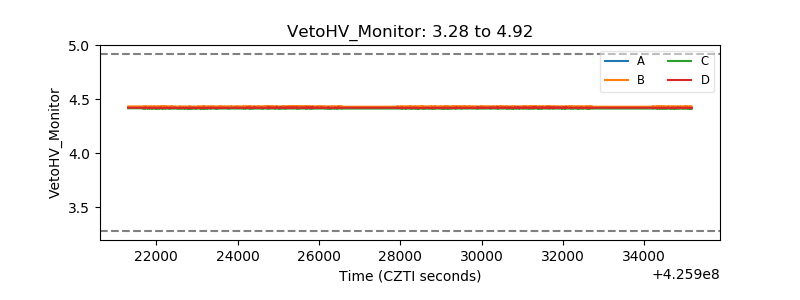 |
| Veto LLD | 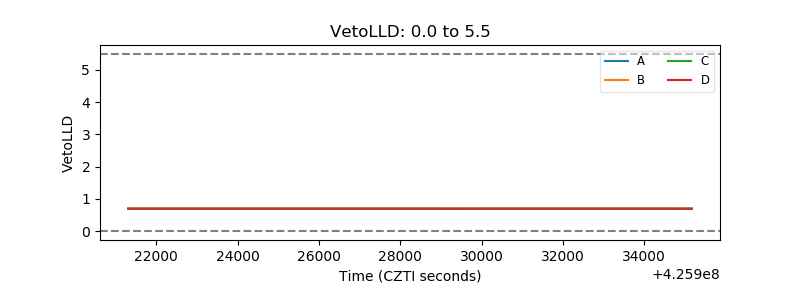 |
| Alpha Counter | 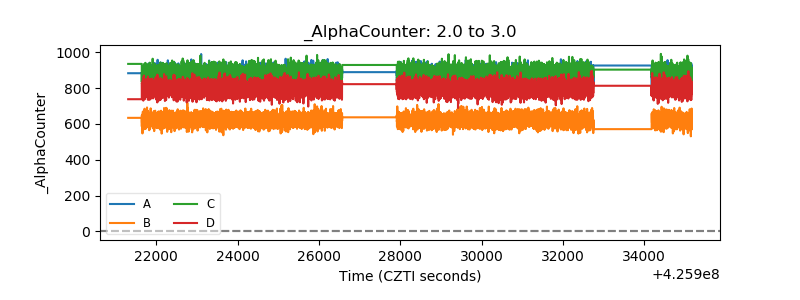 |
| _CPM_Rate | 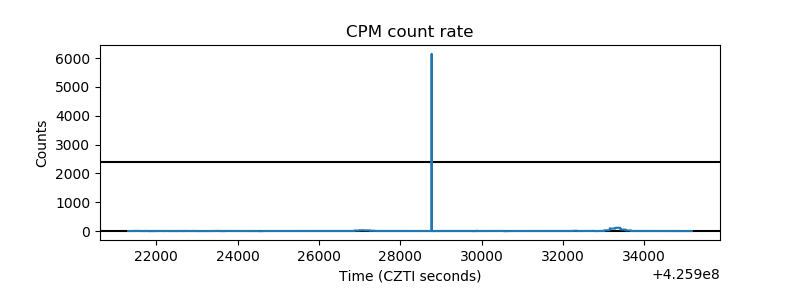 |
| CZT Counter | 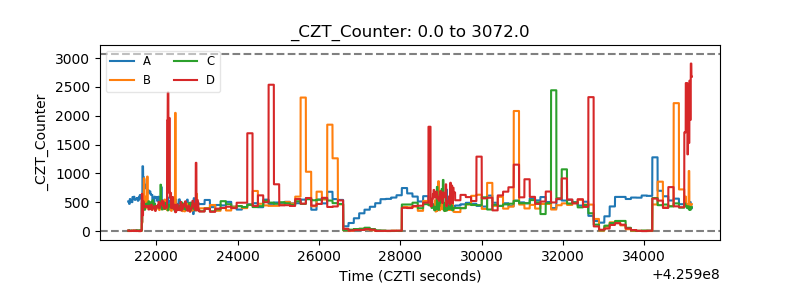 |
| +2.5 Volts monitor |  |
| +5 Volts monitor | 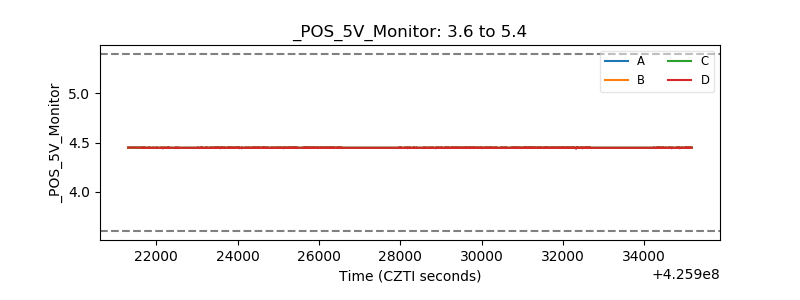 |
| _ROLL_ROT | 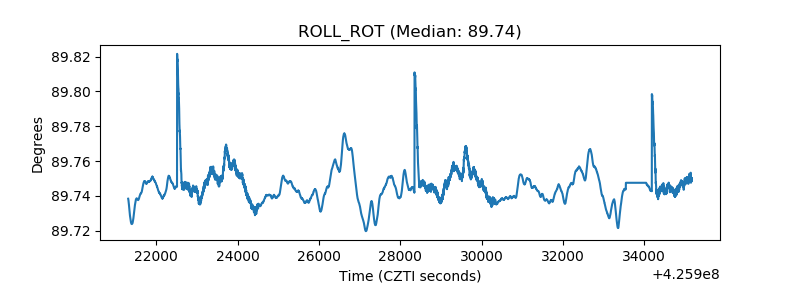 |
| _Roll_DEC | 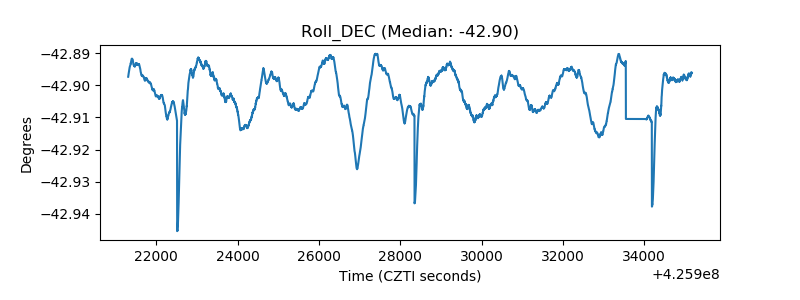 |
| _Roll_RA | 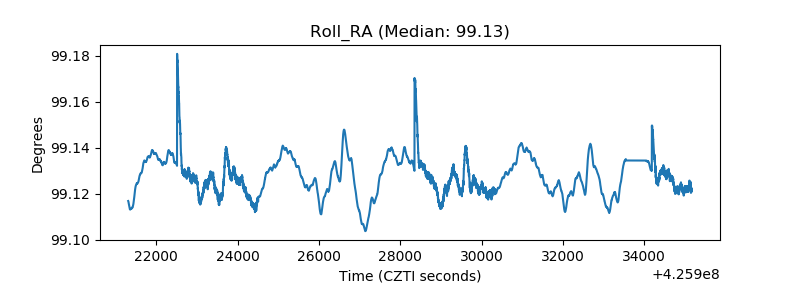 |
| Veto Counter | 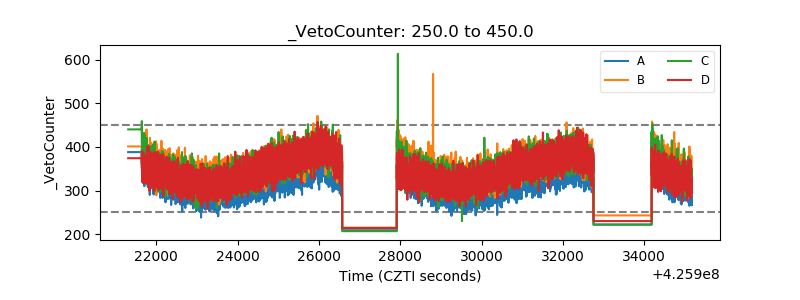 |