| Param | Original file | Final file |
|---|---|---|
| Filename | modeM0/AS1A12_099T03_9000005720_41947cztM0_level2.fits | modeM0/AS1A12_099T03_9000005720_41947cztM0_level2_quad_clean.evt |
| Size (bytes) | 389,093,760 | 90,302,400 |
| Size | 371.1 MB | 86.1 MB |
| Events in quadrant A | 2,927,841 | 616,069 |
| Events in quadrant B | 3,066,776 | 611,972 |
| Events in quadrant C | 2,676,840 | 591,738 |
| Events in quadrant D | 5,288,817 | 516,346 |
| Mode M0 | |||
|---|---|---|---|
| Quadrant | BADHDUFLAG | Total packets | Discarded packets |
| A | 0 | 12153 | 2 |
| B | 0 | 13039 | 2 |
| C | 0 | 11647 | 2 |
| D | 0 | 19701 | 2 |
| Mode SS | |||
|---|---|---|---|
| Quadrant | BADHDUFLAG | Total packets | Discarded packets |
| A | 0 | 116 | 0 |
| B | 0 | 116 | 0 |
| C | 0 | 116 | 0 |
| D | 0 | 116 | 0 |
| Mode M9 | |||
|---|---|---|---|
| Quadrant | BADHDUFLAG | Total packets | Discarded packets |
| A | 0 | 23 | 0 |
| B | 0 | 24 | 0 |
| C | 0 | 24 | 0 |
| D | 0 | 24 | 0 |
| Quadrant | Total seconds | Saturated seconds | Saturation percentage |
|---|---|---|---|
| A | 5690 | 11 | 0.193322% |
| B | 5690 | 150 | 2.636204% |
| C | 5690 | 5 | 0.087873% |
| D | 5690 | 467 | 8.207381% |
Noise dominated data is calculated using 1-second bins in cleaned event files. If a bin has >2000 counts, and if more than 50% of those come from <1% of pixels, then it is considered to be noise-dominated and hence unusable.
| Quadrant | # 1 sec bins | Bins with >0 counts | Bins with >2000 counts | High rate bins dominated by noise | Noise dominated (total time) | Noise dominated (detector-on time) | Marked lightcurve |
|---|---|---|---|---|---|---|---|
| A | 7243 | 5691 | 5 | 5 | 0.07% | 0.09% | 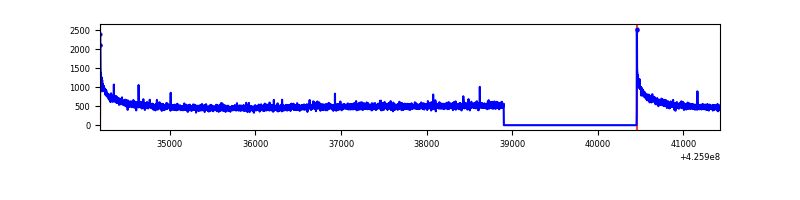 |
| B | 7243 | 5691 | 108 | 108 | 1.49% | 1.90% | 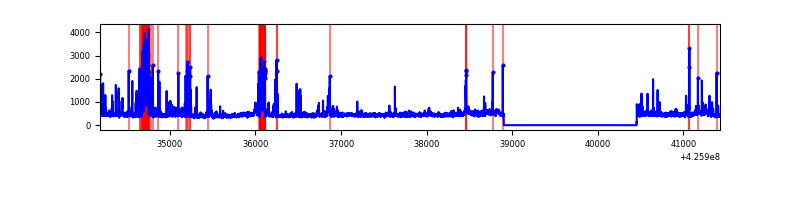 |
| C | 7243 | 5691 | 1 | 1 | 0.01% | 0.02% | 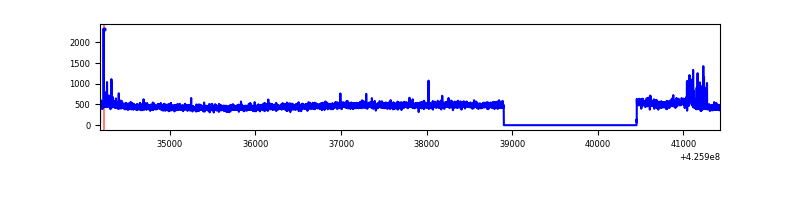 |
| D | 7243 | 5691 | 469 | 469 | 6.48% | 8.24% | 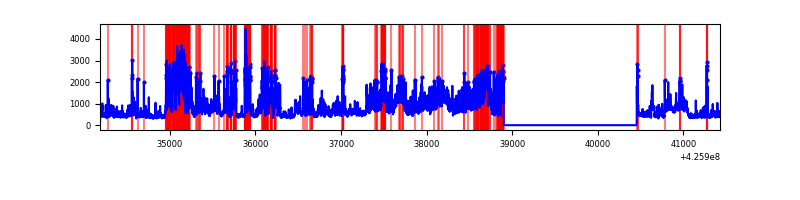 |
Top three noisy pixels from each quadrant. If the there are fewer than three noisy pixels in the level2.evt file, extra rows are filled as -1
| Pixel properties | Quadrant properties | ||||||
|---|---|---|---|---|---|---|---|
| Quadrant | DetID | PixID | Counts | Sigma | Mean | Median | Sigma |
| A | 10 | 83 | 542290 | 4327.22 | 613 | 601 | 125.2 |
| A | 13 | 254 | 7447 | 54.69 | 613 | 601 | 125.2 |
| A | 3 | 137 | 7206 | 52.76 | 613 | 601 | 125.2 |
| B | 5 | 255 | 366413 | 3087.92 | 601 | 582 | 118.5 |
| B | 0 | 229 | 251708 | 2119.72 | 601 | 582 | 118.5 |
| B | 0 | 156 | 59322 | 495.82 | 601 | 582 | 118.5 |
| C | 15 | 214 | 251360 | 1784.51 | 595 | 597 | 140.5 |
| C | 9 | 54 | 80208 | 566.54 | 595 | 597 | 140.5 |
| C | 14 | 254 | 20348 | 140.55 | 595 | 597 | 140.5 |
| D | 5 | 222 | 1287732 | 9126.24 | 580 | 564 | 141.0 |
| D | 2 | 249 | 928779 | 6581.2 | 580 | 564 | 141.0 |
| D | 2 | 120 | 309563 | 2190.86 | 580 | 564 | 141.0 |
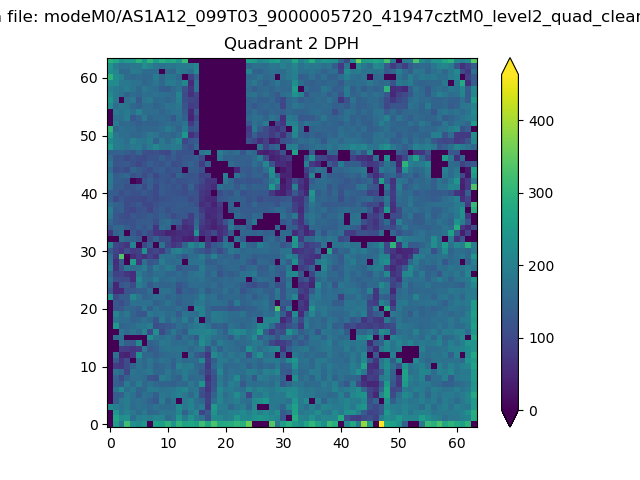
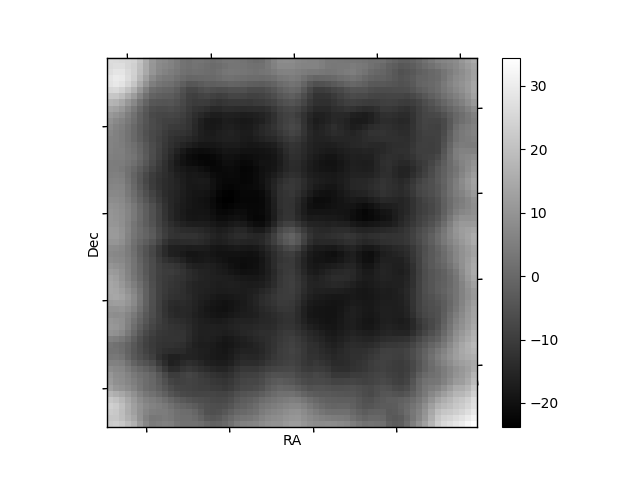
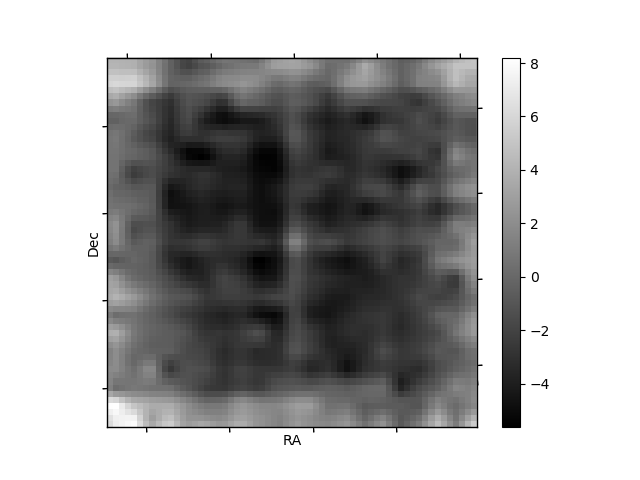
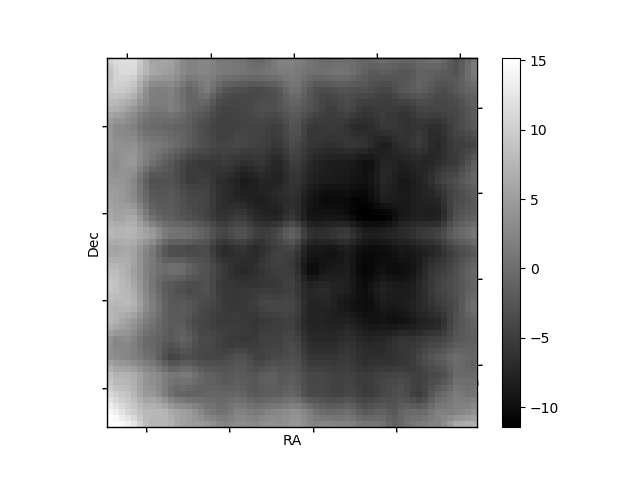
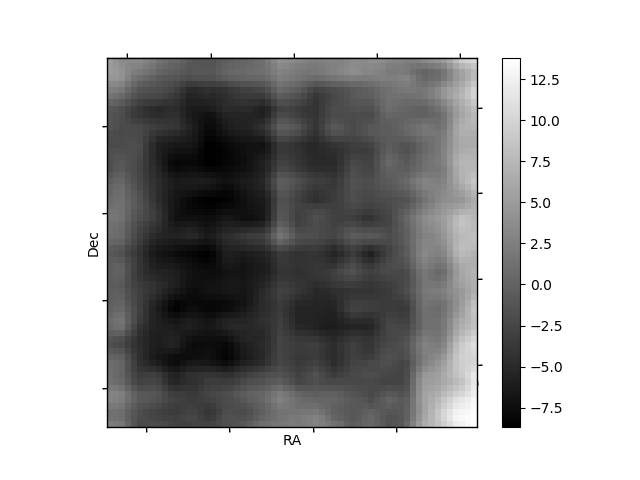
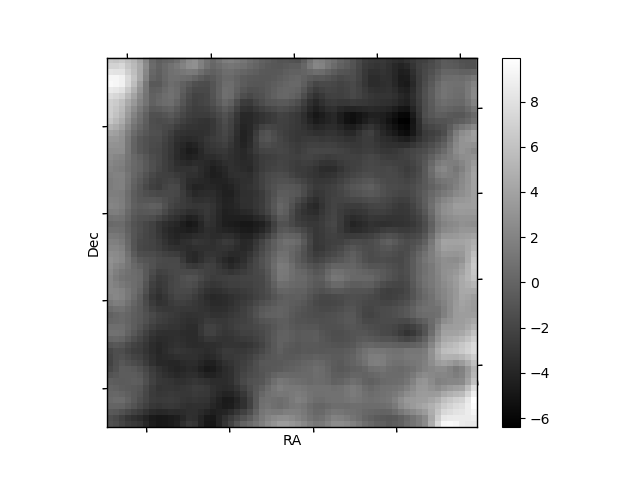
Histogram calculated using DETX and DETY for each event in the final _common_clean file
| Quadrant A | 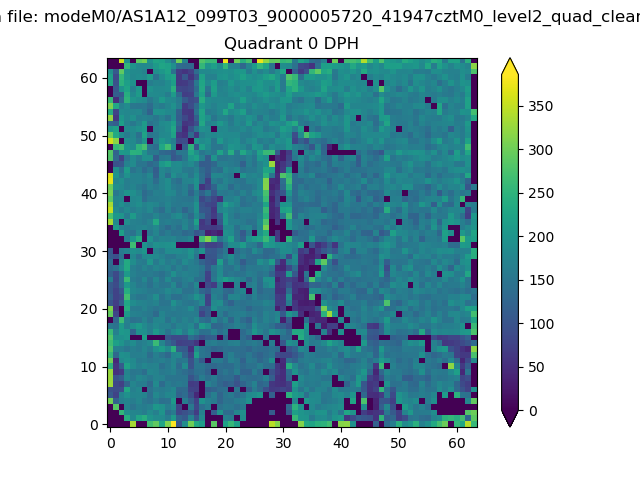 |
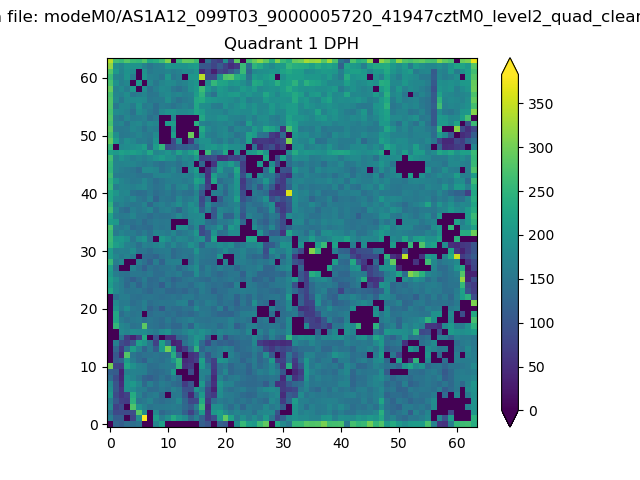 |
Quadrant B |
|---|---|---|---|
| Quadrant D | 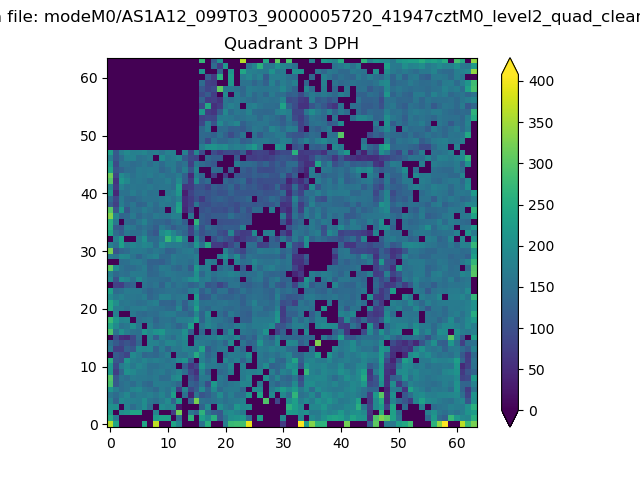 |
 |
Quadrant C |
| Plot type | Count rate plots | Images |
|---|---|---|
| Comparison with Poisson distribution Blue bars denote a histogram of data divided into 1 sec bins. Red curve is a Poisson curve with rate = median count rate of data. |
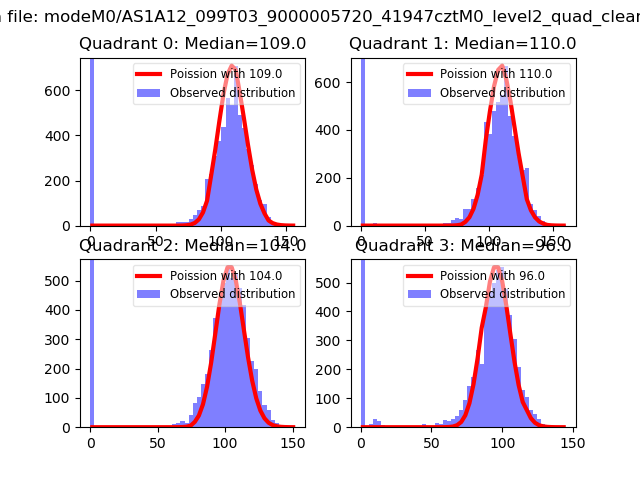 |
 |
| Quadrant-wise count rates Data is divided into 100 sec bins |
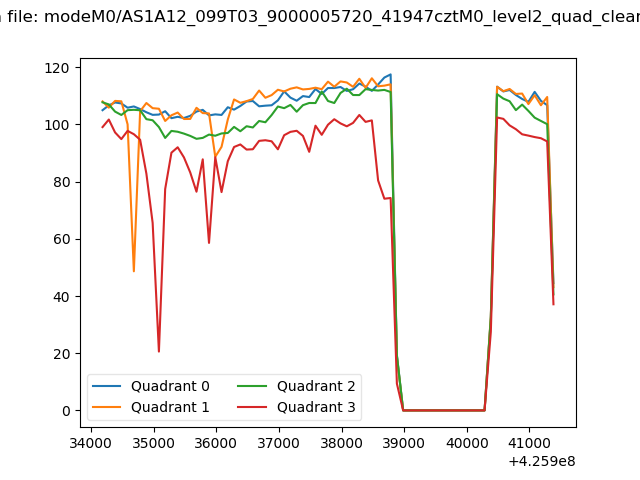 |
|
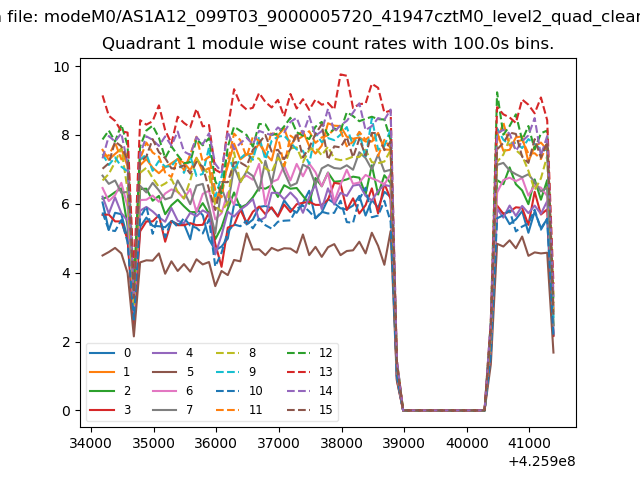
| Module-wise count rates for Quadrant A Data is divided into 100 sec bins |
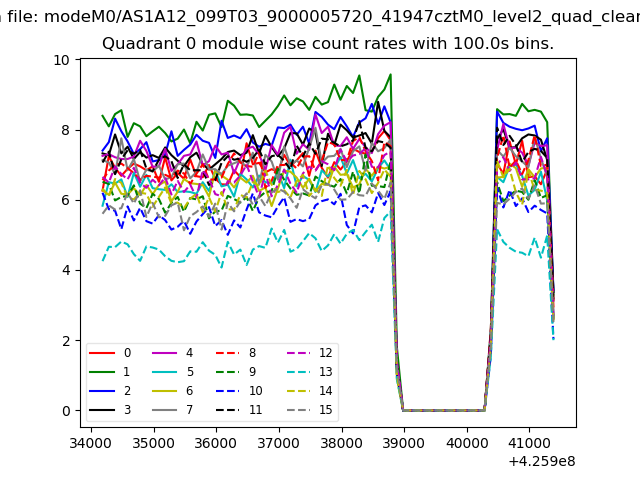 |
 |
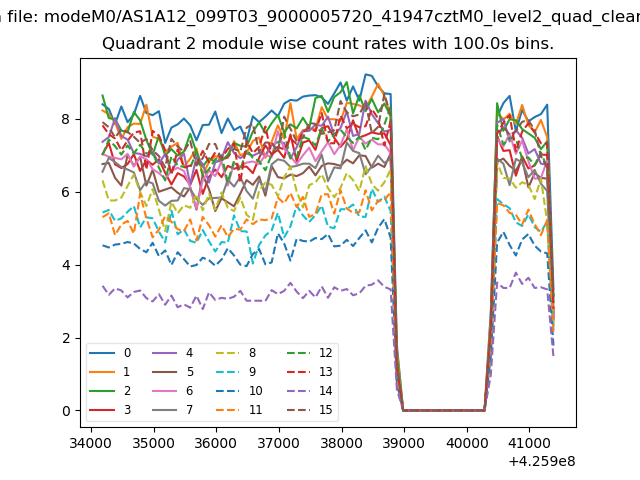
| Module-wise count rates for Quadrant B Data is divided into 100 sec bins |
 |
 |
| Module-wise count rates for Quadrant C Data is divided into 100 sec bins |
 |
 |
| Module-wise count rates for Quadrant D Data is divided into 100 sec bins |
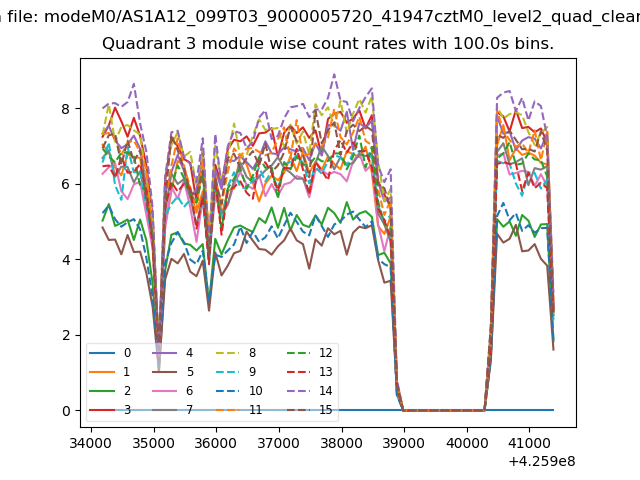 |
 |
| Parameter | Plot |
|---|---|
| CZT HV Monitor | 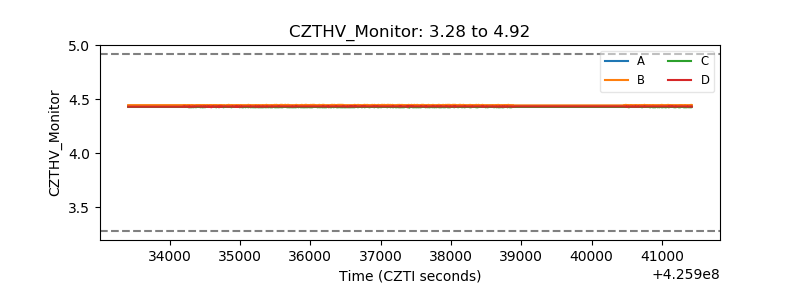 |
| D_VDD |  |
| Temperature 1 | 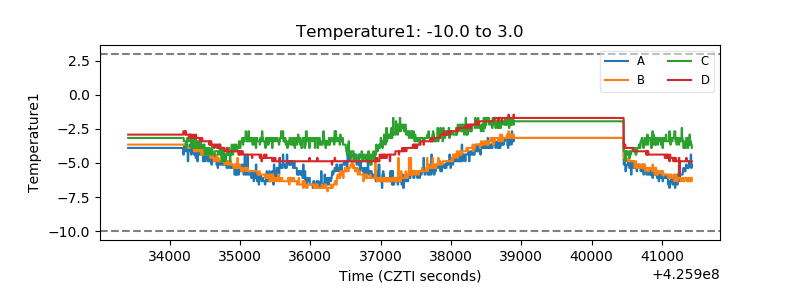 |
| Veto HV Monitor | 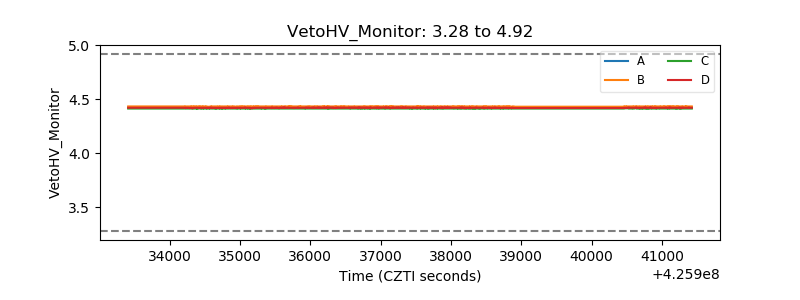 |
| Veto LLD | 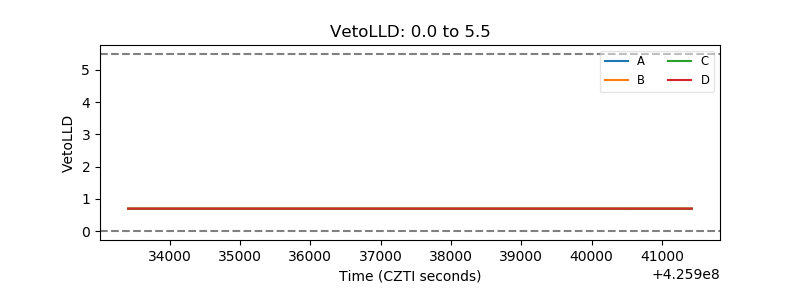 |
| Alpha Counter | 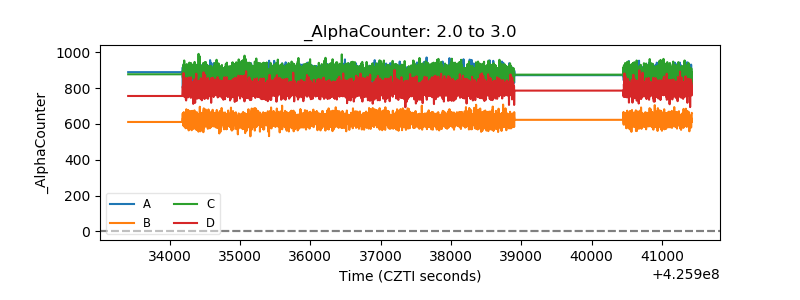 |
| _CPM_Rate | 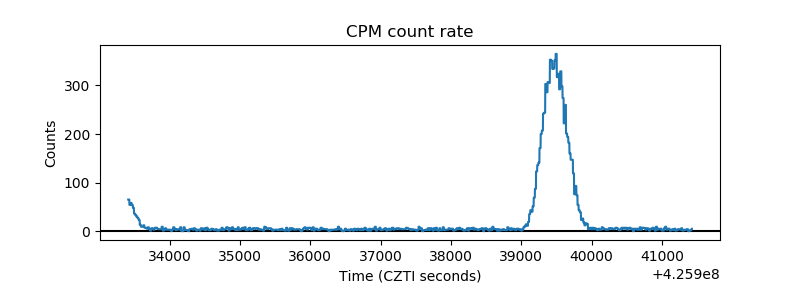 |
| CZT Counter |  |
| +2.5 Volts monitor | 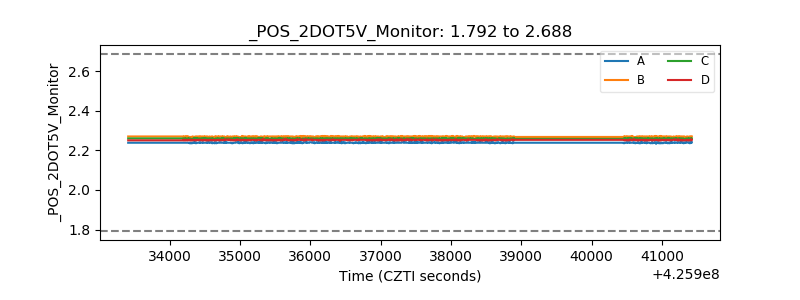 |
| +5 Volts monitor |  |
| _ROLL_ROT | 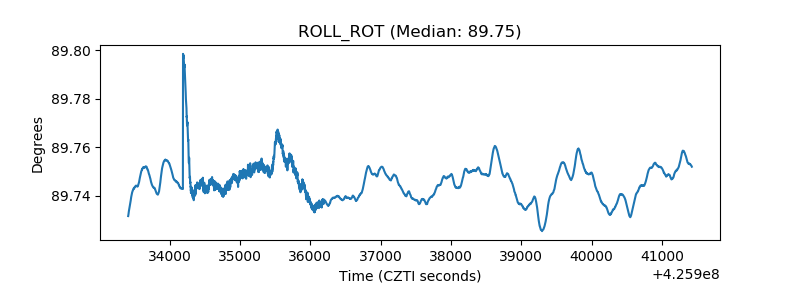 |
| _Roll_DEC | 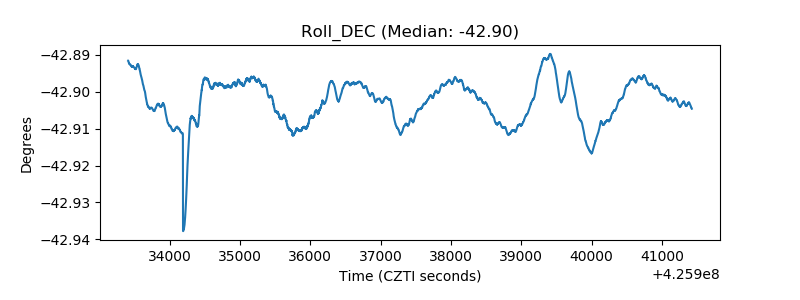 |
| _Roll_RA | 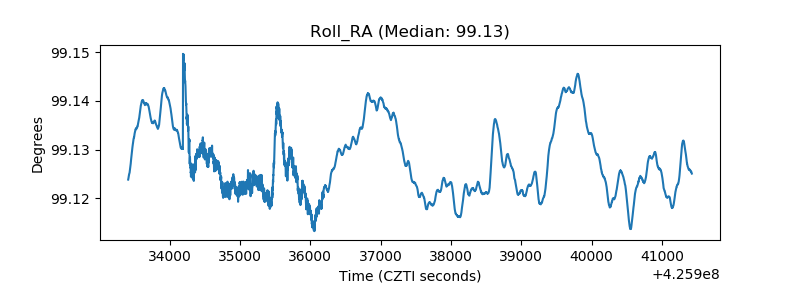 |
| Veto Counter | 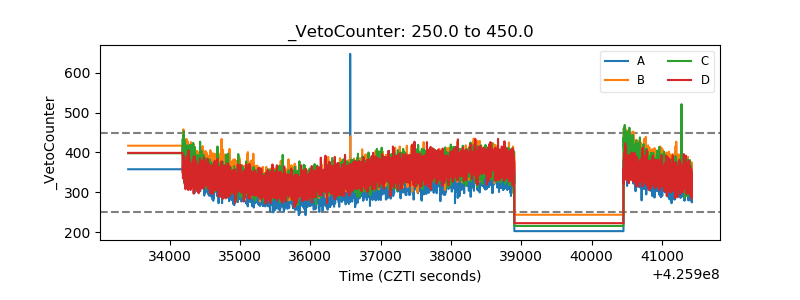 |