| Param | Original file | Final file |
|---|---|---|
| Filename | modeM0/AS1A12_101T01_9000005722_41948cztM0_level2.fits | modeM0/AS1A12_101T01_9000005722_41948cztM0_level2_quad_clean.evt |
| Size (bytes) | 54,357,120 | 12,723,840 |
| Size | 51.8 MB | 12.1 MB |
| Events in quadrant A | 454,587 | 86,550 |
| Events in quadrant B | 368,380 | 88,505 |
| Events in quadrant C | 356,574 | 84,354 |
| Events in quadrant D | 771,462 | 67,004 |
| Mode M0 | |||
|---|---|---|---|
| Quadrant | BADHDUFLAG | Total packets | Discarded packets |
| A | 0 | 1819 | 1 |
| B | 0 | 1571 | 1 |
| C | 0 | 1496 | 1 |
| D | 0 | 2787 | 1 |
| Mode M9 | |||
|---|---|---|---|
| Quadrant | BADHDUFLAG | Total packets | Discarded packets |
| A | 0 | 16 | 0 |
| B | 0 | 16 | 0 |
| C | 0 | 16 | 0 |
| D | 0 | 16 | 0 |
| Mode SS | |||
|---|---|---|---|
| Quadrant | BADHDUFLAG | Total packets | Discarded packets |
| A | 0 | 14 | 0 |
| B | 0 | 14 | 0 |
| C | 0 | 14 | 0 |
| D | 0 | 14 | 0 |
| Quadrant | Total seconds | Saturated seconds | Saturation percentage |
|---|---|---|---|
| A | 744 | 3 | 0.403226% |
| B | 744 | 3 | 0.403226% |
| C | 744 | 1 | 0.134409% |
| D | 744 | 126 | 16.935484% |
Noise dominated data is calculated using 1-second bins in cleaned event files. If a bin has >2000 counts, and if more than 50% of those come from <1% of pixels, then it is considered to be noise-dominated and hence unusable.
| Quadrant | # 1 sec bins | Bins with >0 counts | Bins with >2000 counts | High rate bins dominated by noise | Noise dominated (total time) | Noise dominated (detector-on time) | Marked lightcurve |
|---|---|---|---|---|---|---|---|
| A | 744 | 744 | 2 | 2 | 0.27% | 0.27% | 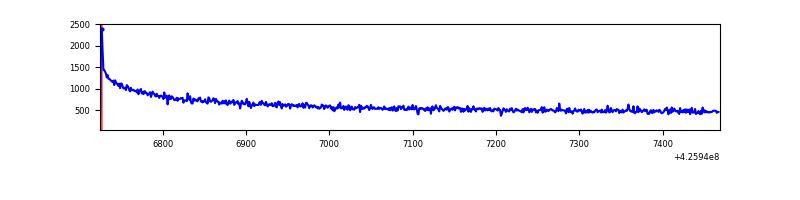 |
| B | 744 | 744 | 2 | 2 | 0.27% | 0.27% | 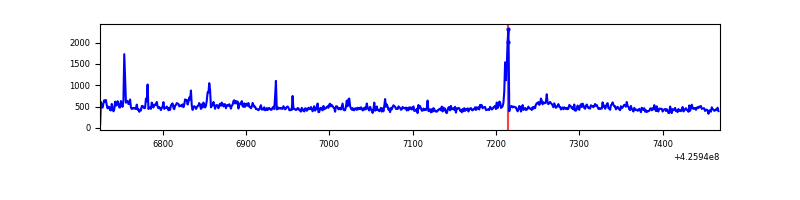 |
| C | 744 | 744 | 0 | 0 | 0.00% | 0.00% | 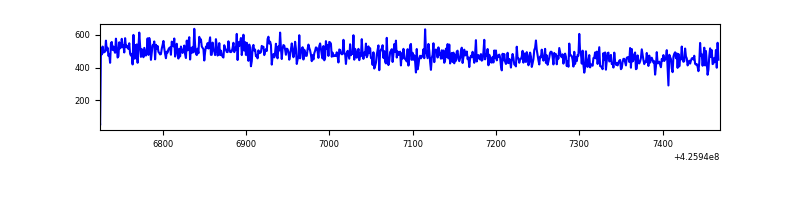 |
| D | 744 | 744 | 127 | 127 | 17.07% | 17.07% | 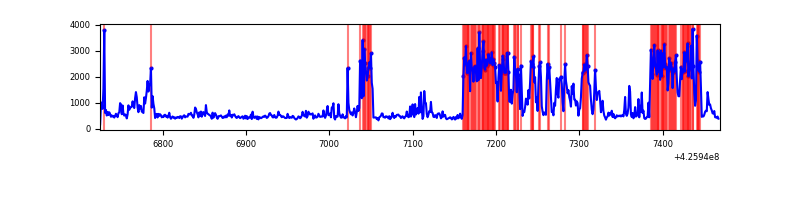 |
Top three noisy pixels from each quadrant. If the there are fewer than three noisy pixels in the level2.evt file, extra rows are filled as -1
| Pixel properties | Quadrant properties | ||||||
|---|---|---|---|---|---|---|---|
| Quadrant | DetID | PixID | Counts | Sigma | Mean | Median | Sigma |
| A | 10 | 83 | 141594 | 7522.92 | 80 | 78 | 18.8 |
| A | 10 | 67 | 1761 | 89.47 | 80 | 78 | 18.8 |
| A | 13 | 254 | 1059 | 52.15 | 80 | 78 | 18.8 |
| B | 0 | 156 | 23834 | 1356.52 | 81 | 79 | 17.5 |
| B | 5 | 255 | 13006 | 738.19 | 81 | 79 | 17.5 |
| B | 0 | 190 | 7631 | 431.25 | 81 | 79 | 17.5 |
| C | 15 | 214 | 38056 | 1828.5 | 81 | 81 | 20.8 |
| C | 15 | 111 | 918 | 40.3 | 81 | 81 | 20.8 |
| C | 9 | 54 | 730 | 31.25 | 81 | 81 | 20.8 |
| D | 2 | 249 | 373965 | 18809.31 | 73 | 71 | 19.9 |
| D | 5 | 222 | 46989 | 2360.28 | 73 | 71 | 19.9 |
| D | 12 | 250 | 35980 | 1806.46 | 73 | 71 | 19.9 |
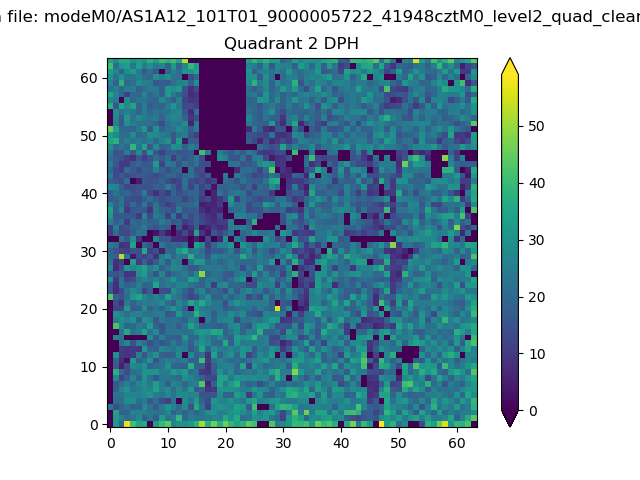
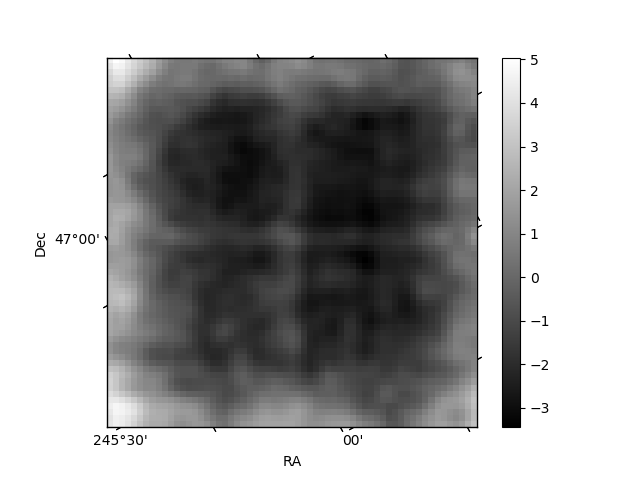
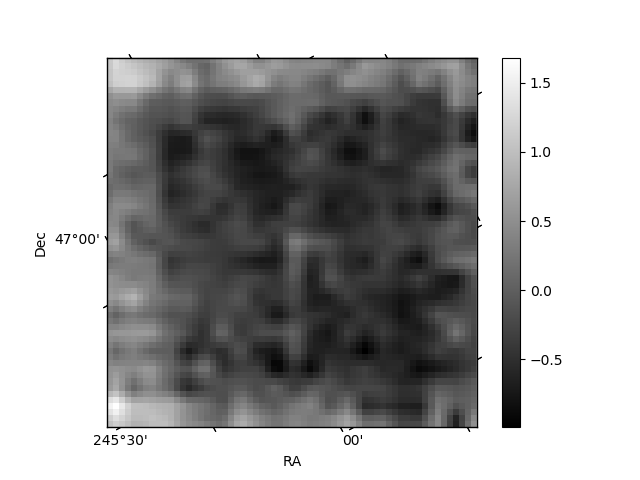
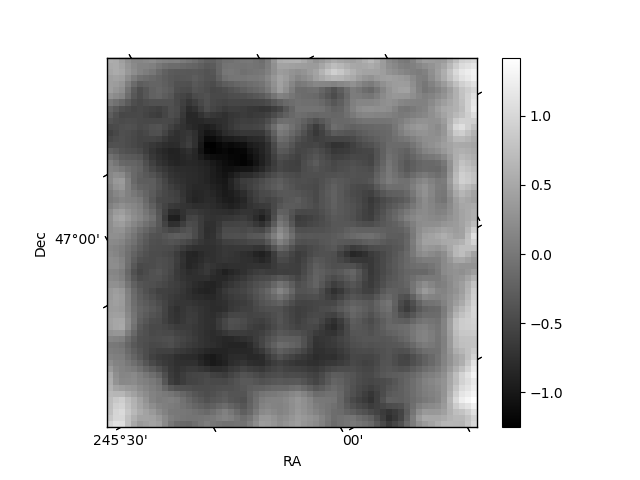
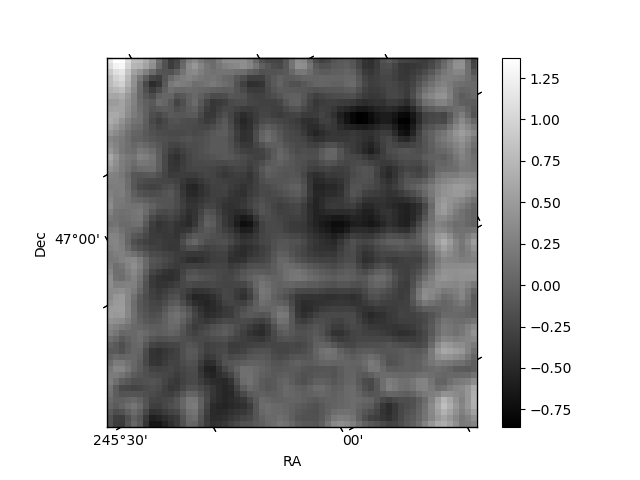
Histogram calculated using DETX and DETY for each event in the final _common_clean file
| Quadrant A | 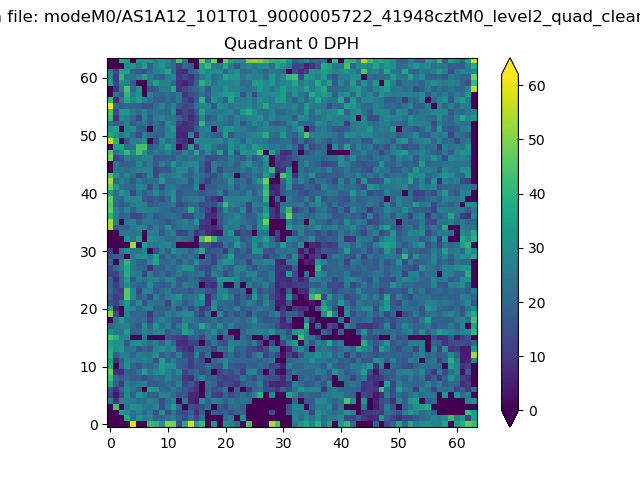 |
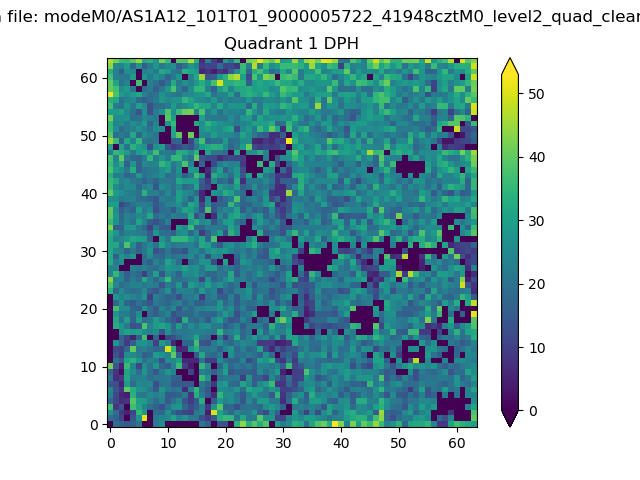 |
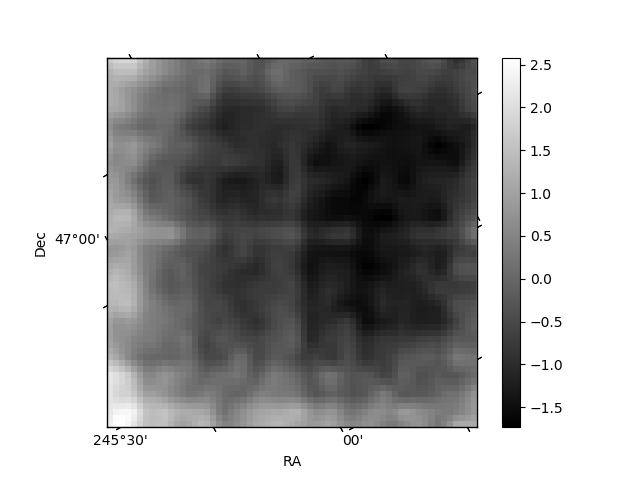
Quadrant B |
|---|---|---|---|
| Quadrant D | 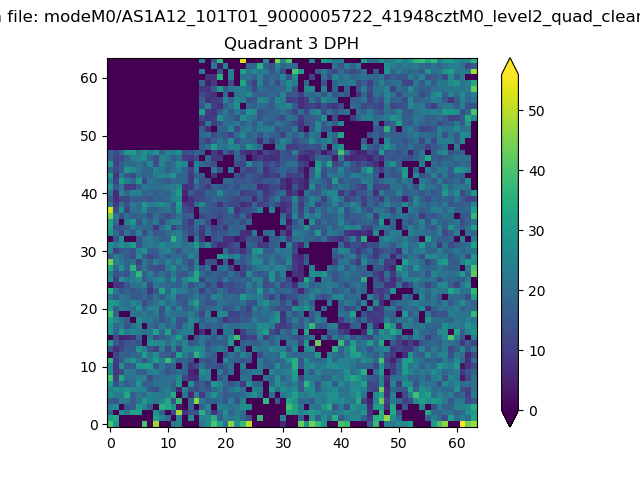 |
 |
Quadrant C |
| Plot type | Count rate plots | Images |
|---|---|---|
| Comparison with Poisson distribution Blue bars denote a histogram of data divided into 1 sec bins. Red curve is a Poisson curve with rate = median count rate of data. |
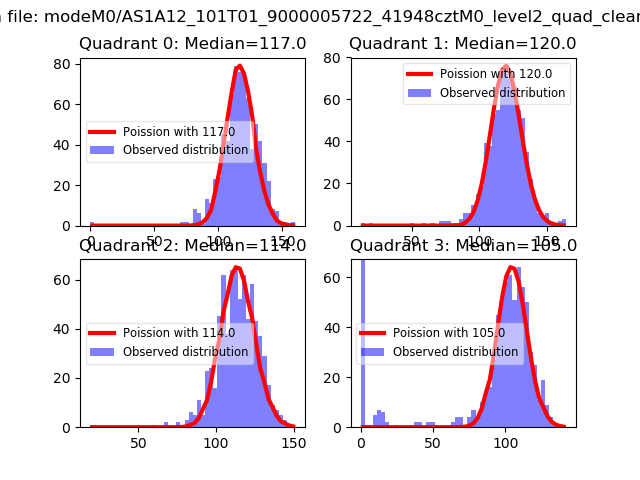 |
 |
| Quadrant-wise count rates Data is divided into 100 sec bins |
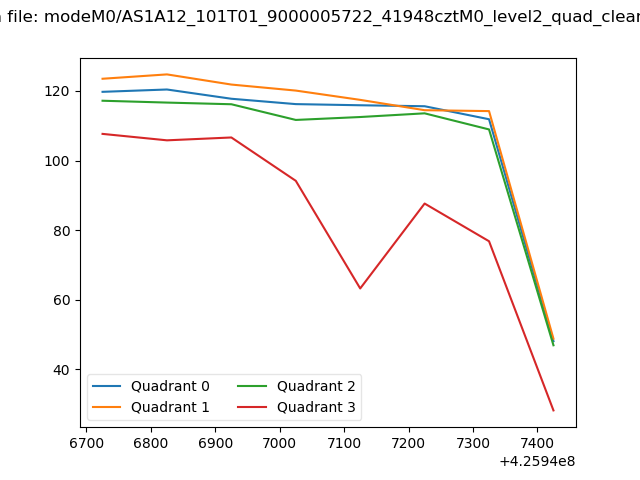 |
|
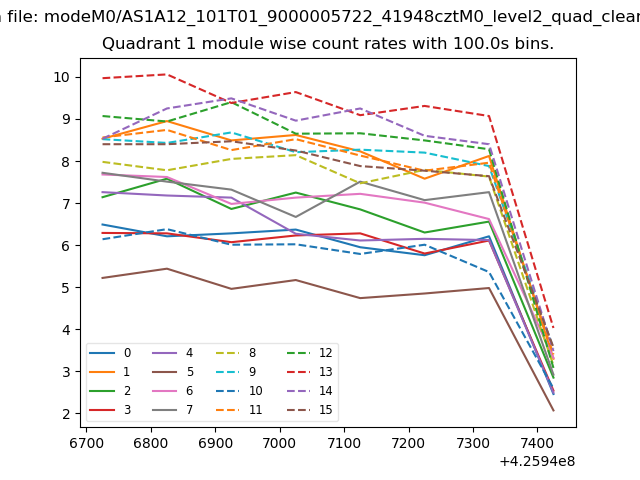
| Module-wise count rates for Quadrant A Data is divided into 100 sec bins |
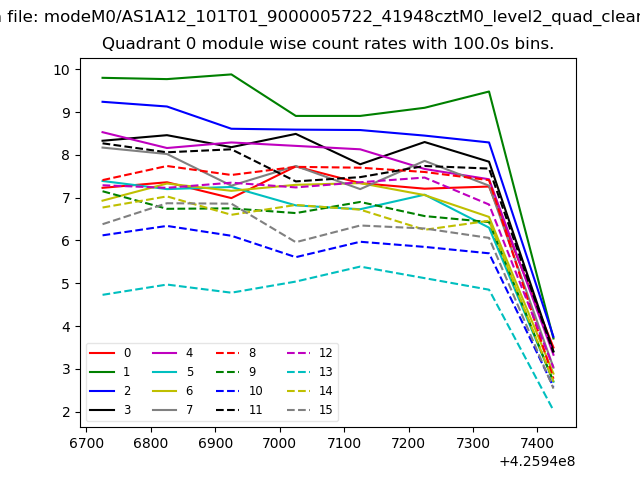 |
 |
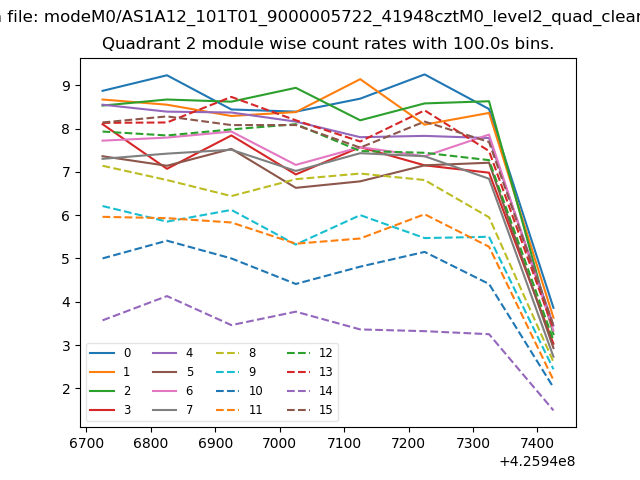
| Module-wise count rates for Quadrant B Data is divided into 100 sec bins |
 |
 |
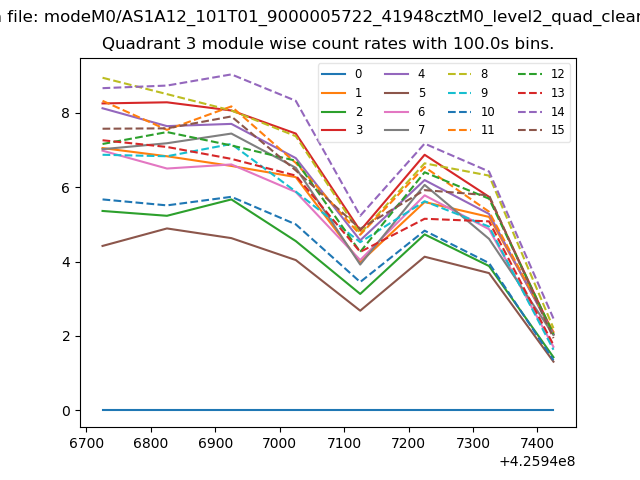
| Module-wise count rates for Quadrant C Data is divided into 100 sec bins |
 |
 |
| Module-wise count rates for Quadrant D Data is divided into 100 sec bins |
 |
 |
| Parameter | Plot |
|---|---|
| CZT HV Monitor | 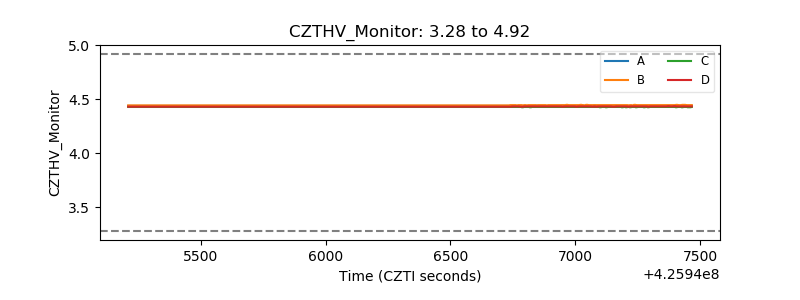 |
| D_VDD | 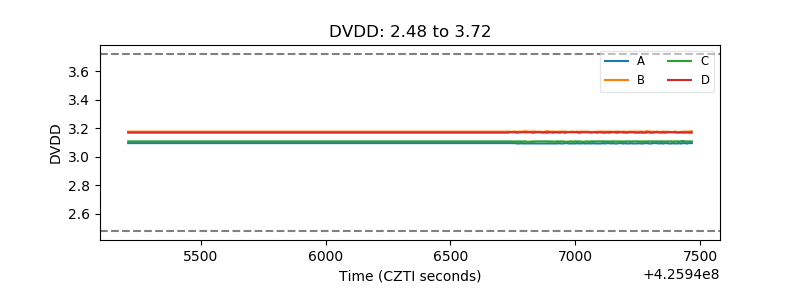 |
| Temperature 1 | 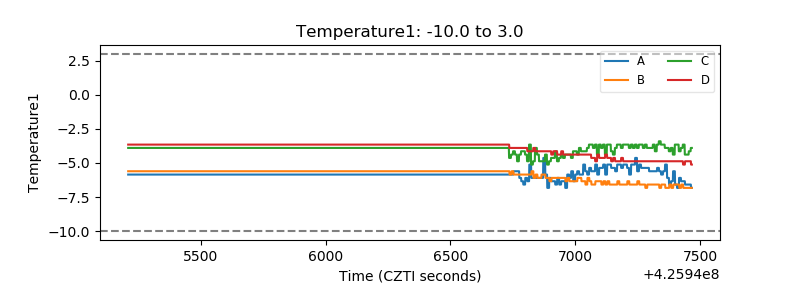 |
| Veto HV Monitor | 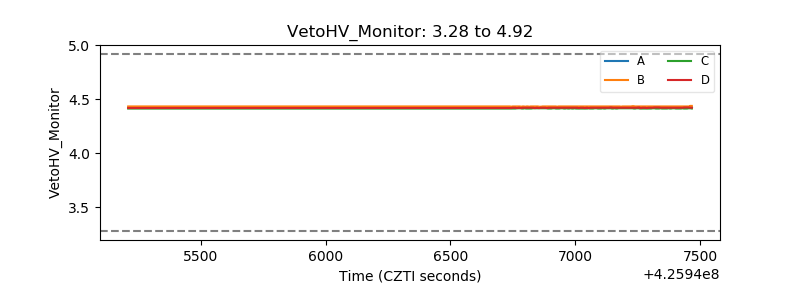 |
| Veto LLD | 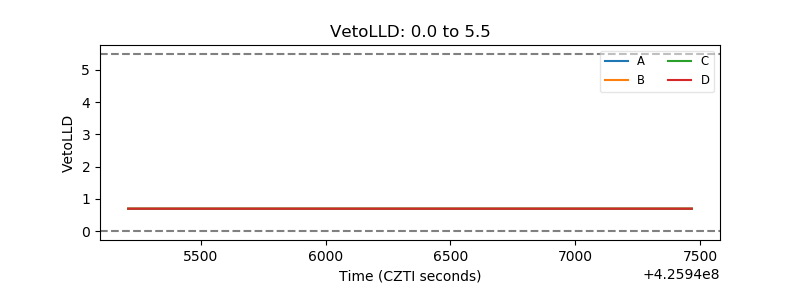 |
| Alpha Counter | 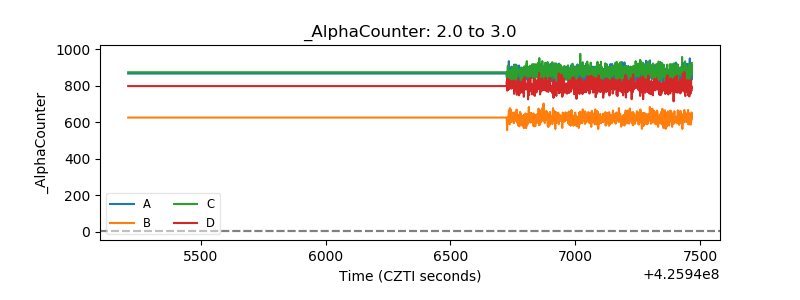 |
| _CPM_Rate | 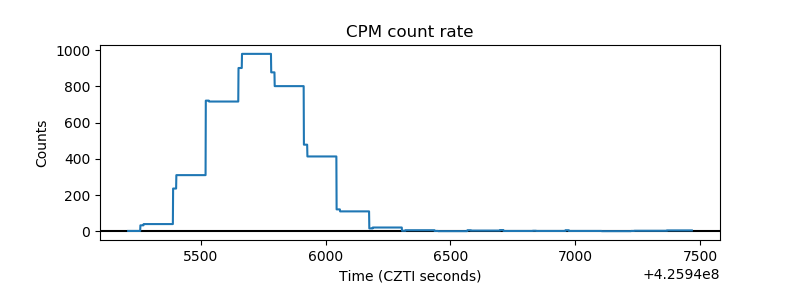 |
| CZT Counter | 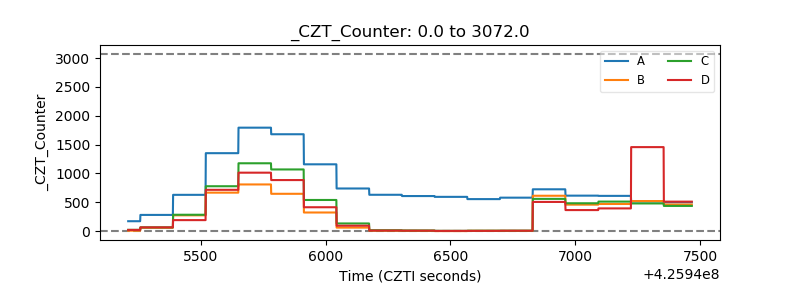 |
| +2.5 Volts monitor |  |
| +5 Volts monitor | 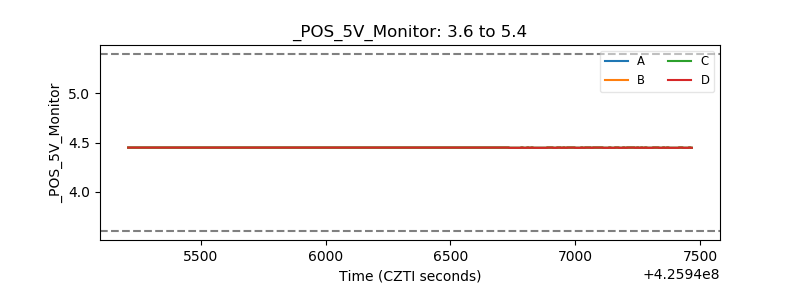 |
| _ROLL_ROT | 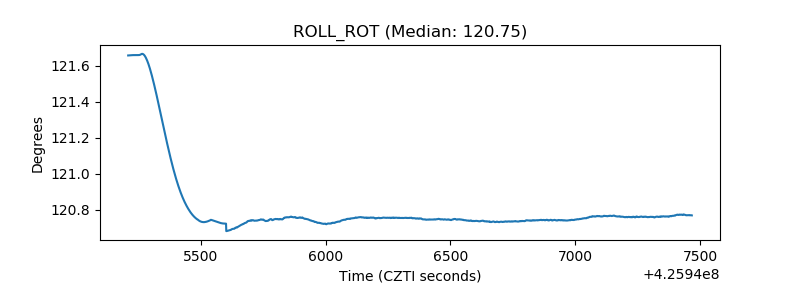 |
| _Roll_DEC | 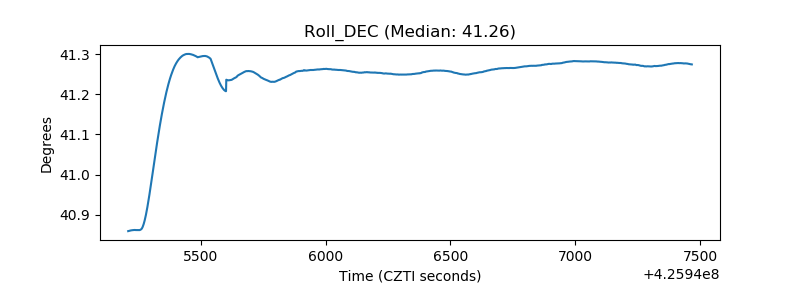 |
| _Roll_RA | 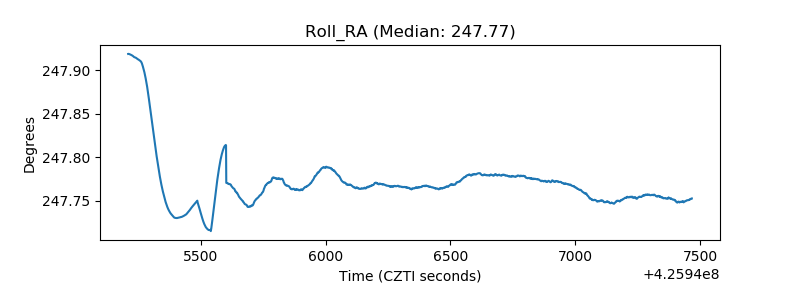 |
| Veto Counter | 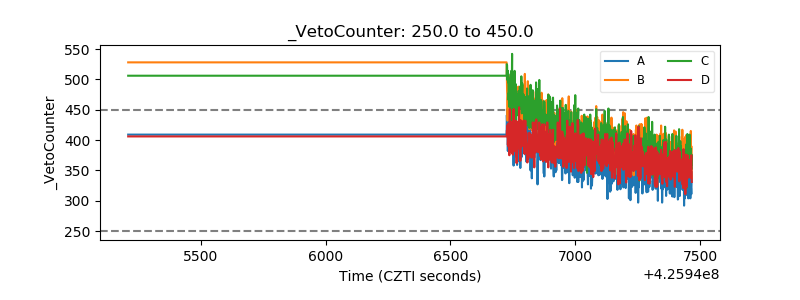 |