| Param | Original file | Final file |
|---|---|---|
| Filename | modeM0/AS1A12_101T01_9000005722_41951cztM0_level2.fits | modeM0/AS1A12_101T01_9000005722_41951cztM0_level2_quad_clean.evt |
| Size (bytes) | 317,770,560 | 91,722,240 |
| Size | 303.0 MB | 87.5 MB |
| Events in quadrant A | 2,838,725 | 616,726 |
| Events in quadrant B | 2,566,336 | 635,973 |
| Events in quadrant C | 2,532,135 | 607,510 |
| Events in quadrant D | 3,411,772 | 545,475 |
| Mode M0 | |||
|---|---|---|---|
| Quadrant | BADHDUFLAG | Total packets | Discarded packets |
| A | 0 | 11572 | 2 |
| B | 0 | 11242 | 2 |
| C | 0 | 10767 | 2 |
| D | 0 | 13964 | 2 |
| Mode M9 | |||
|---|---|---|---|
| Quadrant | BADHDUFLAG | Total packets | Discarded packets |
| A | 0 | 38 | 0 |
| B | 0 | 38 | 0 |
| C | 0 | 38 | 0 |
| D | 0 | 38 | 0 |
| Mode SS | |||
|---|---|---|---|
| Quadrant | BADHDUFLAG | Total packets | Discarded packets |
| A | 0 | 110 | 0 |
| B | 0 | 110 | 0 |
| C | 0 | 110 | 0 |
| D | 0 | 110 | 0 |
| Quadrant | Total seconds | Saturated seconds | Saturation percentage |
|---|---|---|---|
| A | 5309 | 8 | 0.150688% |
| B | 5309 | 35 | 0.659258% |
| C | 5309 | 4 | 0.075344% |
| D | 5310 | 145 | 2.730697% |
Noise dominated data is calculated using 1-second bins in cleaned event files. If a bin has >2000 counts, and if more than 50% of those come from <1% of pixels, then it is considered to be noise-dominated and hence unusable.
| Quadrant | # 1 sec bins | Bins with >0 counts | Bins with >2000 counts | High rate bins dominated by noise | Noise dominated (total time) | Noise dominated (detector-on time) | Marked lightcurve |
|---|---|---|---|---|---|---|---|
| A | 9044 | 5311 | 4 | 4 | 0.04% | 0.08% | 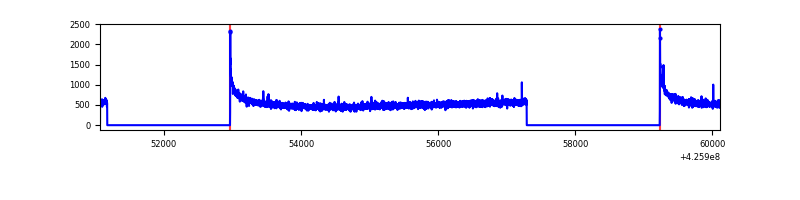 |
| B | 9044 | 5311 | 15 | 15 | 0.17% | 0.28% | 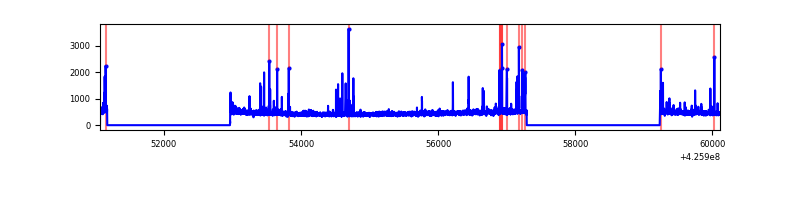 |
| C | 9044 | 5311 | 2 | 2 | 0.02% | 0.04% | 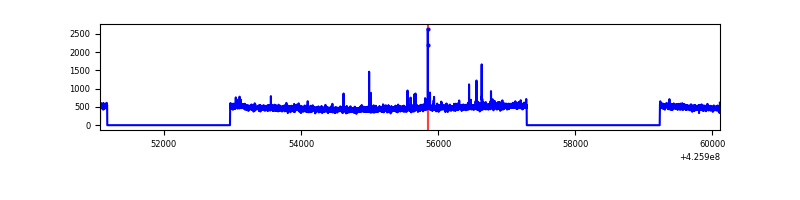 |
| D | 9045 | 5312 | 158 | 158 | 1.75% | 2.97% | 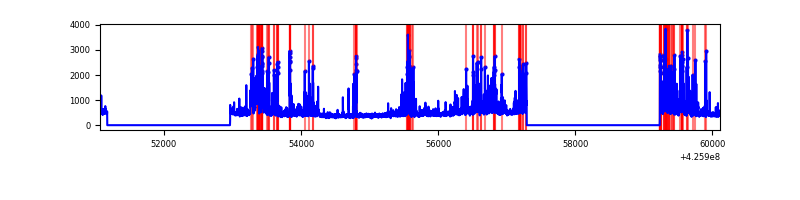 |
Top three noisy pixels from each quadrant. If the there are fewer than three noisy pixels in the level2.evt file, extra rows are filled as -1
| Pixel properties | Quadrant properties | ||||||
|---|---|---|---|---|---|---|---|
| Quadrant | DetID | PixID | Counts | Sigma | Mean | Median | Sigma |
| A | 10 | 83 | 529311 | 4338.42 | 593 | 582 | 121.9 |
| A | 2 | 79 | 12595 | 98.57 | 593 | 582 | 121.9 |
| A | 13 | 254 | 7519 | 56.92 | 593 | 582 | 121.9 |
| B | 5 | 255 | 130115 | 1146.12 | 590 | 573 | 113.0 |
| B | 0 | 229 | 55520 | 486.14 | 590 | 573 | 113.0 |
| B | 0 | 190 | 35683 | 310.64 | 590 | 573 | 113.0 |
| C | 15 | 214 | 234353 | 1743.13 | 577 | 582 | 134.1 |
| C | 15 | 111 | 25667 | 187.05 | 577 | 582 | 134.1 |
| C | 9 | 54 | 13246 | 94.43 | 577 | 582 | 134.1 |
| D | 12 | 218 | 402129 | 2859.08 | 568 | 552 | 140.5 |
| D | 2 | 249 | 254834 | 1810.4 | 568 | 552 | 140.5 |
| D | 12 | 6 | 211273 | 1500.26 | 568 | 552 | 140.5 |
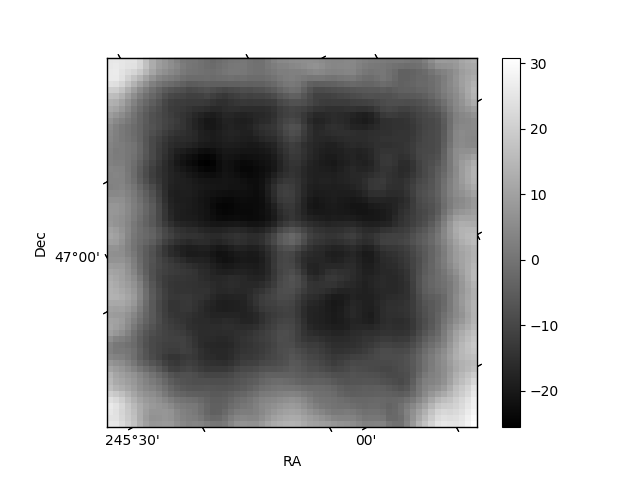
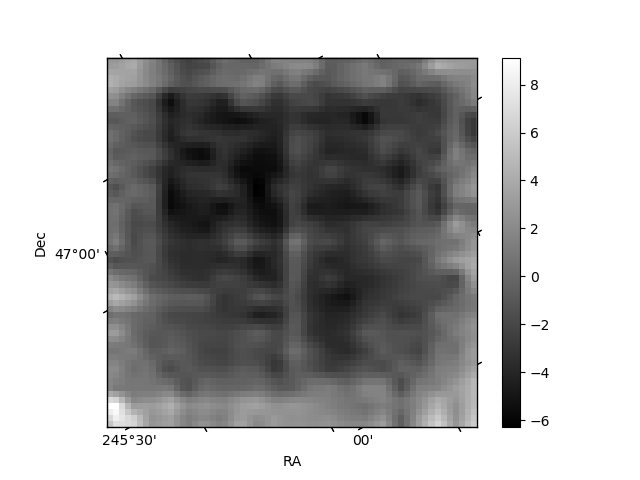
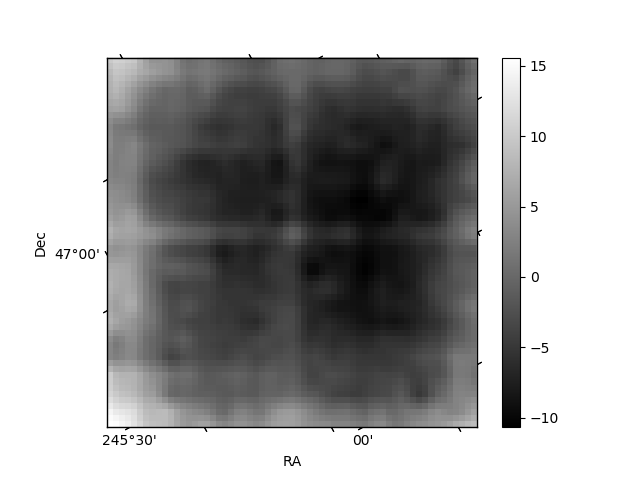
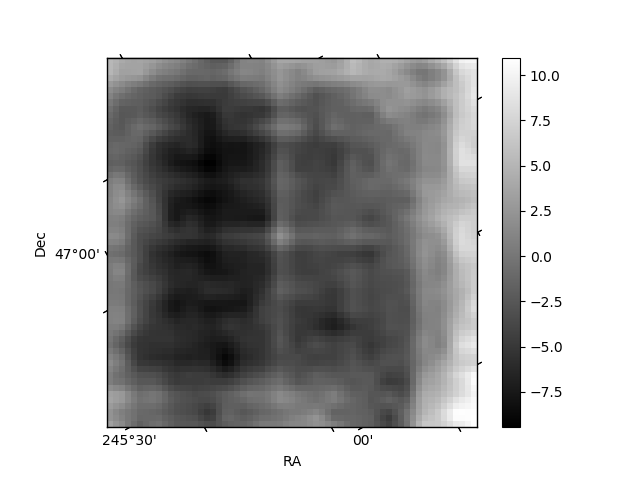
Histogram calculated using DETX and DETY for each event in the final _common_clean file
| Quadrant A | 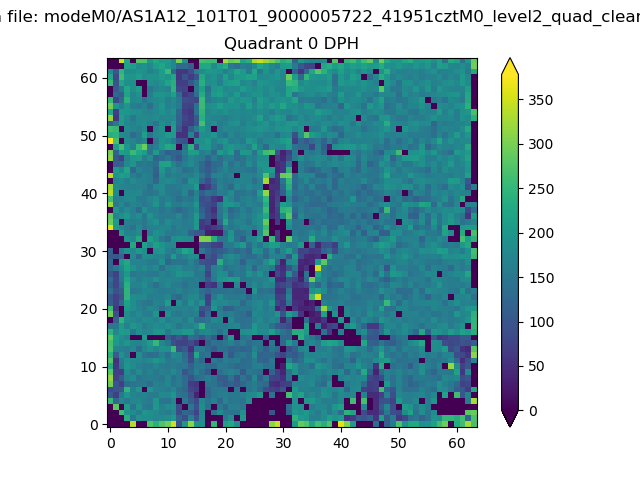 |
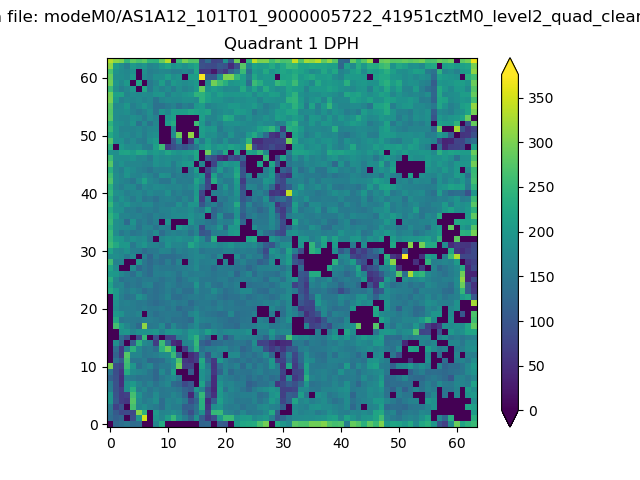 |
Quadrant B |
|---|---|---|---|
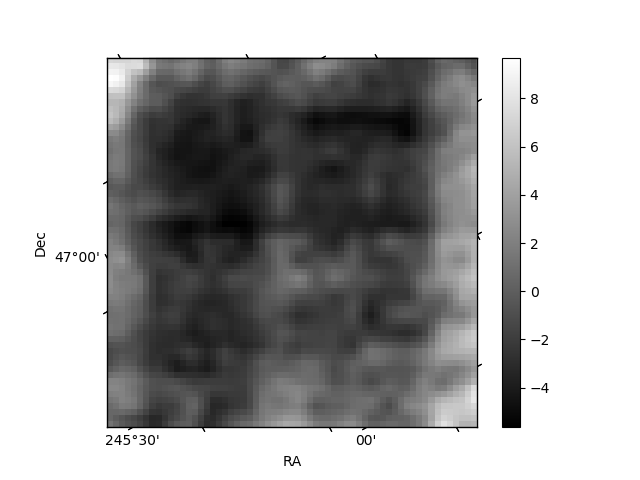
| Quadrant D | 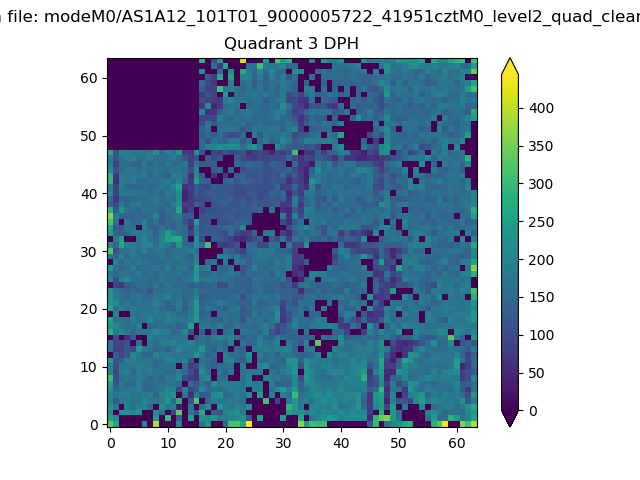 |
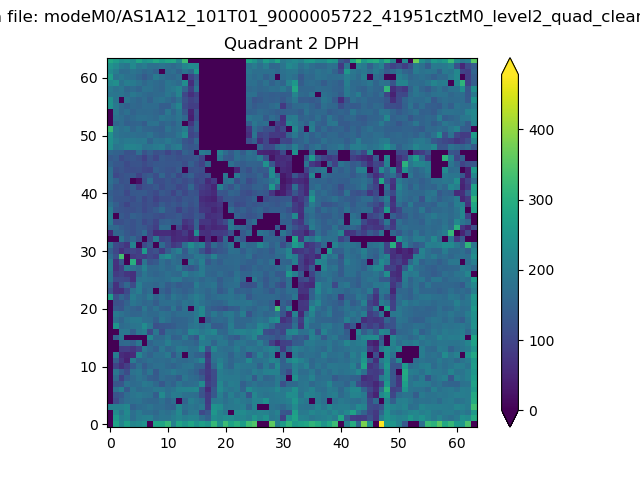 |
Quadrant C |
| Plot type | Count rate plots | Images |
|---|---|---|
| Comparison with Poisson distribution Blue bars denote a histogram of data divided into 1 sec bins. Red curve is a Poisson curve with rate = median count rate of data. |
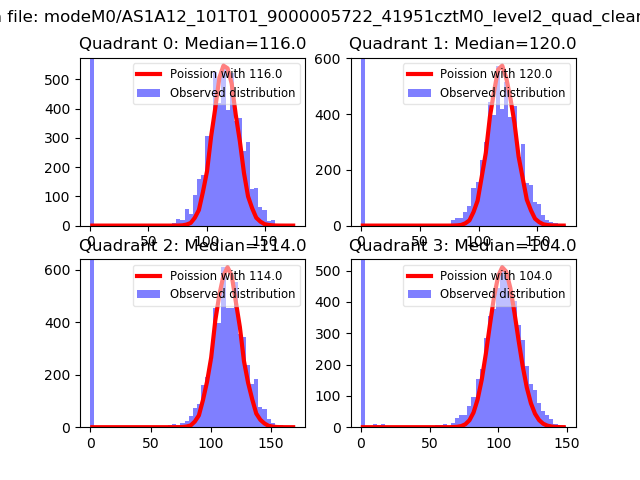 |
 |
| Quadrant-wise count rates Data is divided into 100 sec bins |
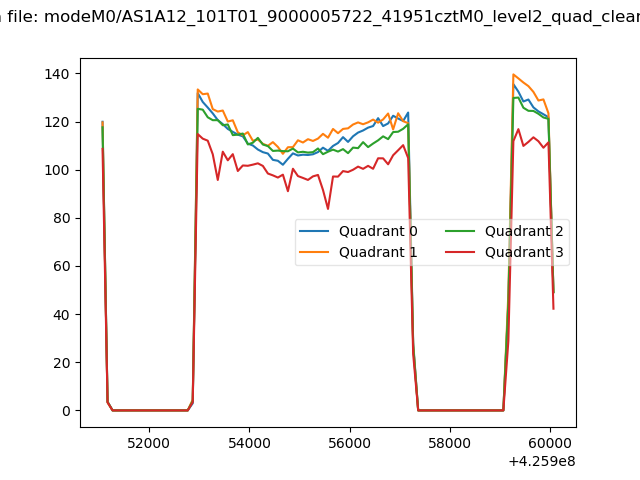 |
|
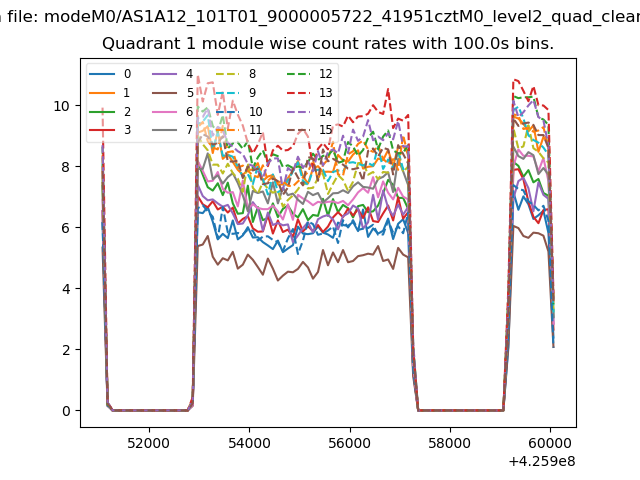
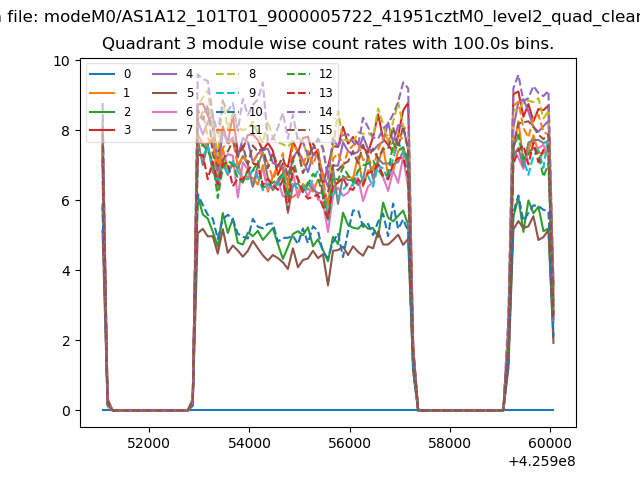
| Module-wise count rates for Quadrant A Data is divided into 100 sec bins |
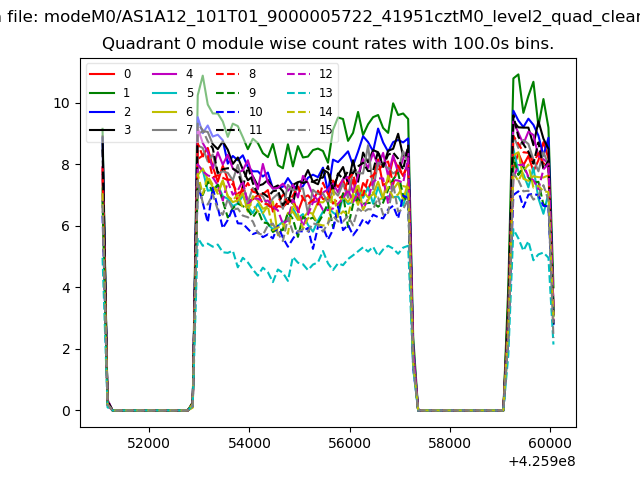 |
 |
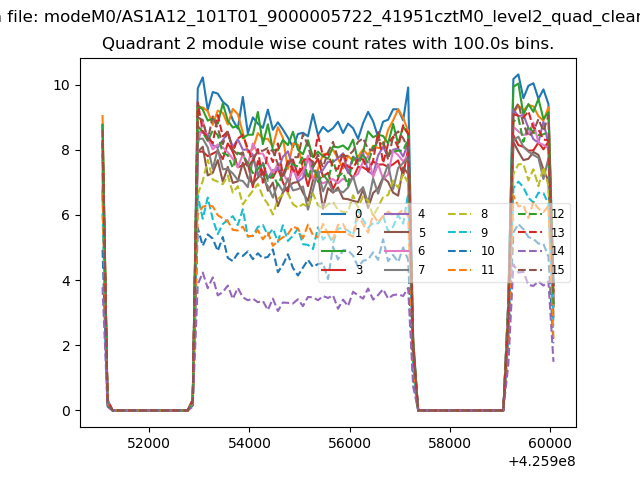
| Module-wise count rates for Quadrant B Data is divided into 100 sec bins |
 |
 |
| Module-wise count rates for Quadrant C Data is divided into 100 sec bins |
 |
 |
| Module-wise count rates for Quadrant D Data is divided into 100 sec bins |
 |
 |
| Parameter | Plot |
|---|---|
| CZT HV Monitor | 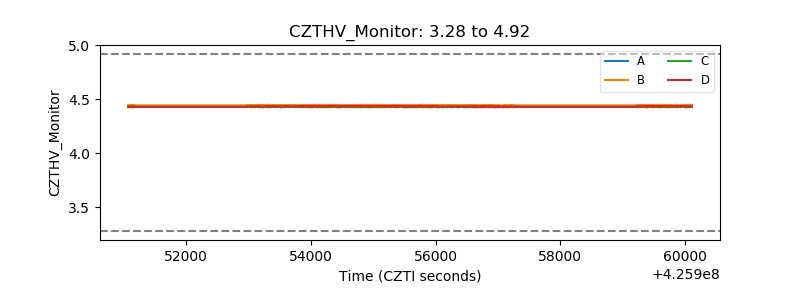 |
| D_VDD | 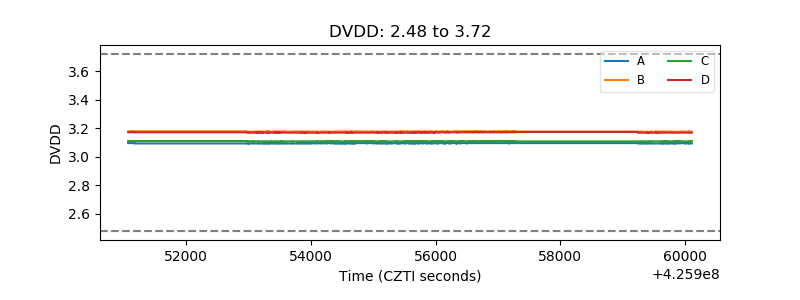 |
| Temperature 1 | 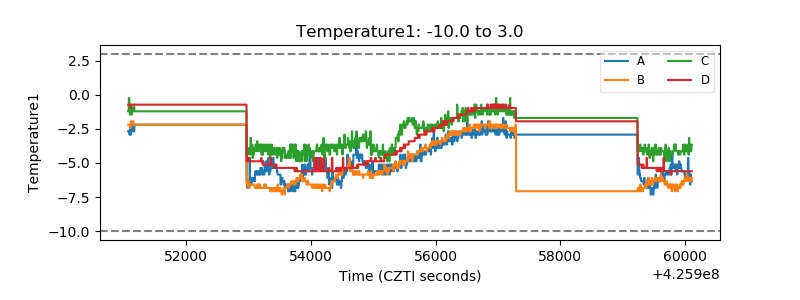 |
| Veto HV Monitor | 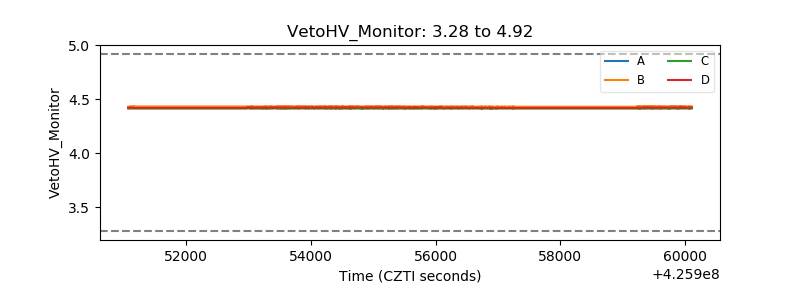 |
| Veto LLD | 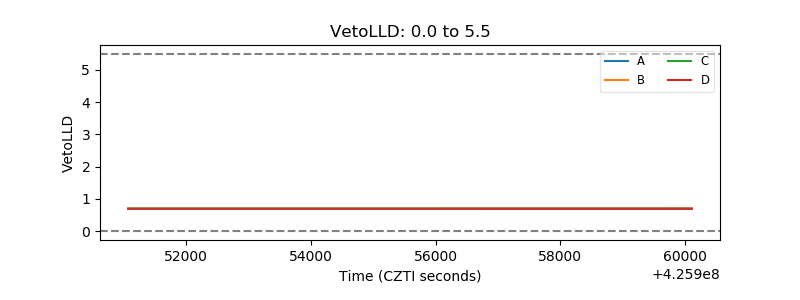 |
| Alpha Counter | 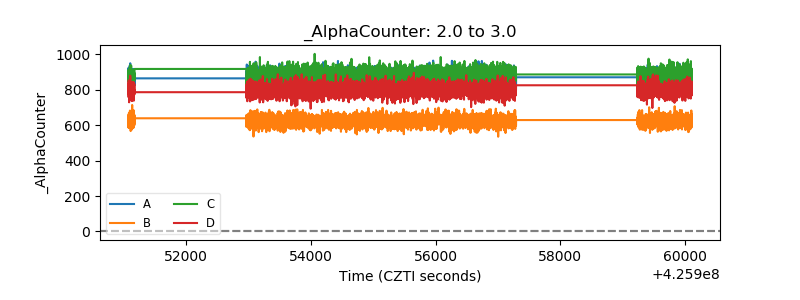 |
| _CPM_Rate | 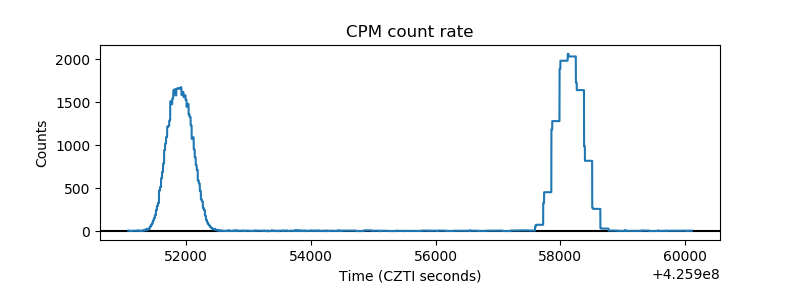 |
| CZT Counter | 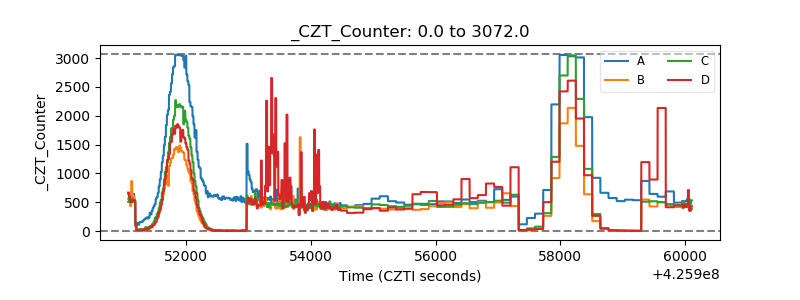 |
| +2.5 Volts monitor | 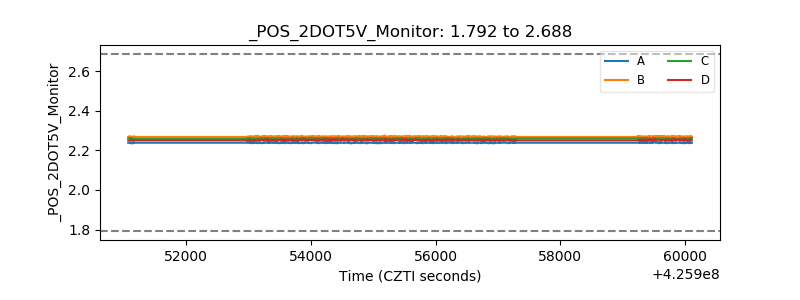 |
| +5 Volts monitor |  |
| _ROLL_ROT | 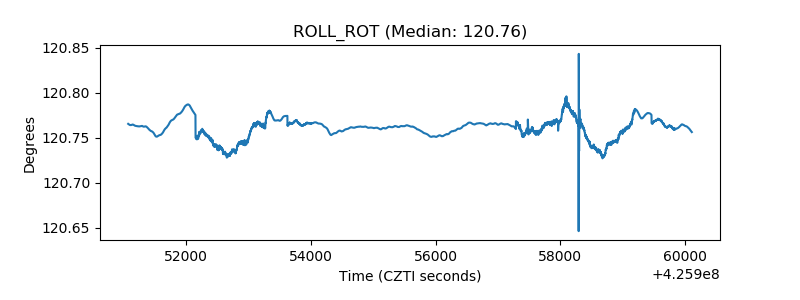 |
| _Roll_DEC | 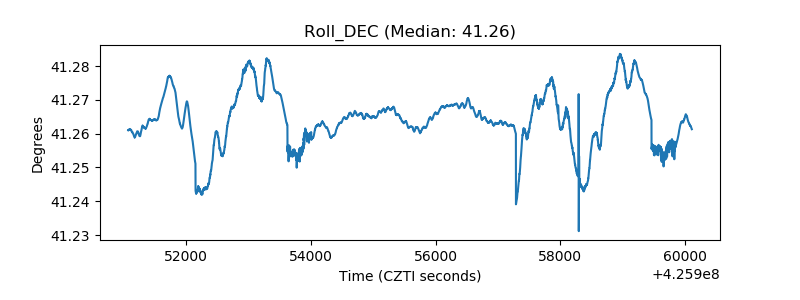 |
| _Roll_RA | 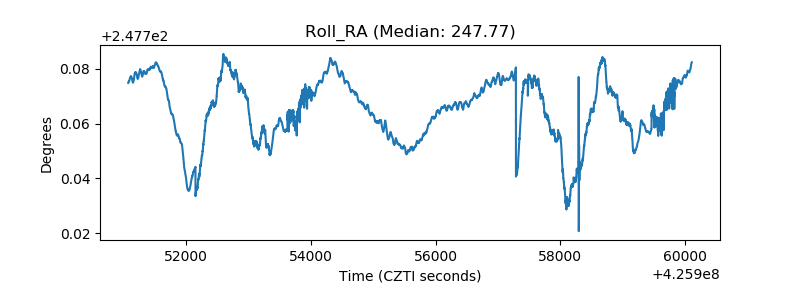 |
| Veto Counter |  |