| Param | Original file | Final file |
|---|---|---|
| Filename | modeM0/AS1A12_101T01_9000005722_41952cztM0_level2.fits | modeM0/AS1A12_101T01_9000005722_41952cztM0_level2_quad_clean.evt |
| Size (bytes) | 322,649,280 | 88,159,680 |
| Size | 307.7 MB | 84.1 MB |
| Events in quadrant A | 2,756,858 | 600,281 |
| Events in quadrant B | 2,598,483 | 617,126 |
| Events in quadrant C | 2,436,484 | 587,884 |
| Events in quadrant D | 3,763,921 | 515,336 |
| Mode M0 | |||
|---|---|---|---|
| Quadrant | BADHDUFLAG | Total packets | Discarded packets |
| A | 0 | 11060 | 2 |
| B | 0 | 10930 | 2 |
| C | 0 | 10169 | 2 |
| D | 0 | 14592 | 3 |
| Mode M9 | |||
|---|---|---|---|
| Quadrant | BADHDUFLAG | Total packets | Discarded packets |
| A | 0 | 38 | 0 |
| B | 0 | 38 | 0 |
| C | 0 | 39 | 0 |
| D | 0 | 39 | 0 |
| Mode SS | |||
|---|---|---|---|
| Quadrant | BADHDUFLAG | Total packets | Discarded packets |
| A | 0 | 102 | 0 |
| B | 0 | 102 | 0 |
| C | 0 | 102 | 0 |
| D | 0 | 102 | 0 |
| Quadrant | Total seconds | Saturated seconds | Saturation percentage |
|---|---|---|---|
| A | 4976 | 13 | 0.261254% |
| B | 4976 | 74 | 1.487138% |
| C | 4976 | 5 | 0.100482% |
| D | 4975 | 287 | 5.768844% |
Noise dominated data is calculated using 1-second bins in cleaned event files. If a bin has >2000 counts, and if more than 50% of those come from <1% of pixels, then it is considered to be noise-dominated and hence unusable.
| Quadrant | # 1 sec bins | Bins with >0 counts | Bins with >2000 counts | High rate bins dominated by noise | Noise dominated (total time) | Noise dominated (detector-on time) | Marked lightcurve |
|---|---|---|---|---|---|---|---|
| A | 7037 | 4977 | 7 | 7 | 0.10% | 0.14% | 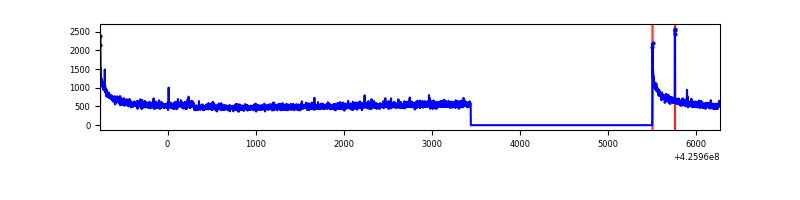 |
| B | 7037 | 4977 | 38 | 38 | 0.54% | 0.76% | 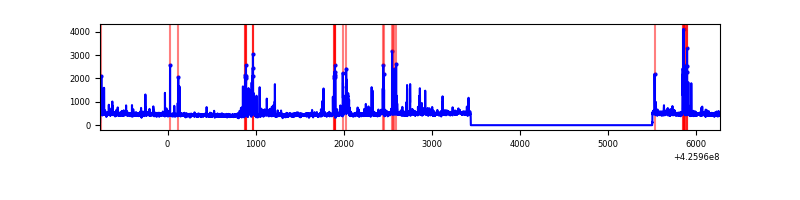 |
| C | 7037 | 4977 | 7 | 7 | 0.10% | 0.14% | 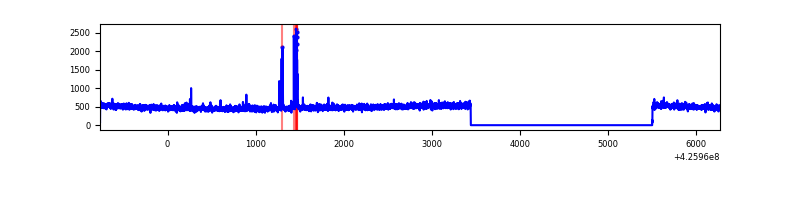 |
| D | 7036 | 4976 | 269 | 269 | 3.82% | 5.41% | 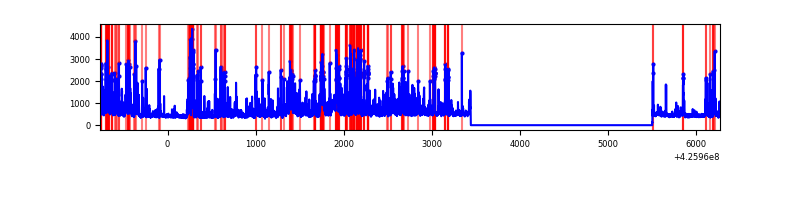 |
Top three noisy pixels from each quadrant. If the there are fewer than three noisy pixels in the level2.evt file, extra rows are filled as -1
| Pixel properties | Quadrant properties | ||||||
|---|---|---|---|---|---|---|---|
| Quadrant | DetID | PixID | Counts | Sigma | Mean | Median | Sigma |
| A | 10 | 83 | 506756 | 4342.2 | 572 | 563 | 116.6 |
| A | 2 | 79 | 26984 | 226.64 | 572 | 563 | 116.6 |
| A | 13 | 248 | 7782 | 61.93 | 572 | 563 | 116.6 |
| B | 0 | 229 | 238262 | 2164.77 | 568 | 555 | 109.8 |
| B | 3 | 112 | 65776 | 593.96 | 568 | 555 | 109.8 |
| B | 5 | 255 | 30323 | 271.09 | 568 | 555 | 109.8 |
| C | 15 | 214 | 221301 | 1724.81 | 554 | 557 | 128.0 |
| C | 15 | 111 | 50947 | 393.73 | 554 | 557 | 128.0 |
| C | 13 | 61 | 3817 | 25.47 | 554 | 557 | 128.0 |
| D | 2 | 249 | 596316 | 4564.61 | 535 | 520 | 130.5 |
| D | 13 | 249 | 492686 | 3770.67 | 535 | 520 | 130.5 |
| D | 12 | 218 | 230868 | 1764.78 | 535 | 520 | 130.5 |
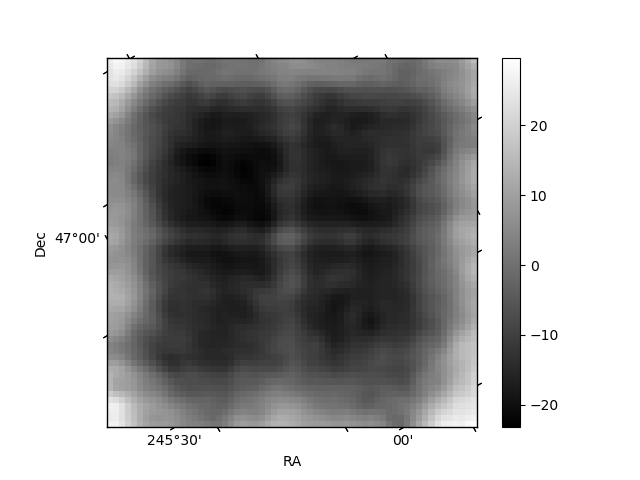
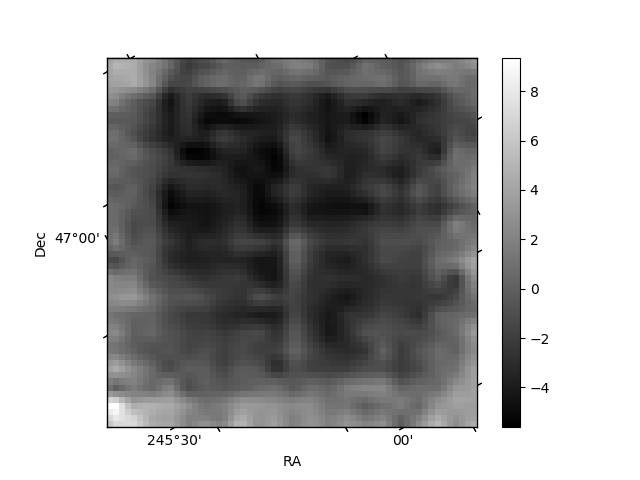
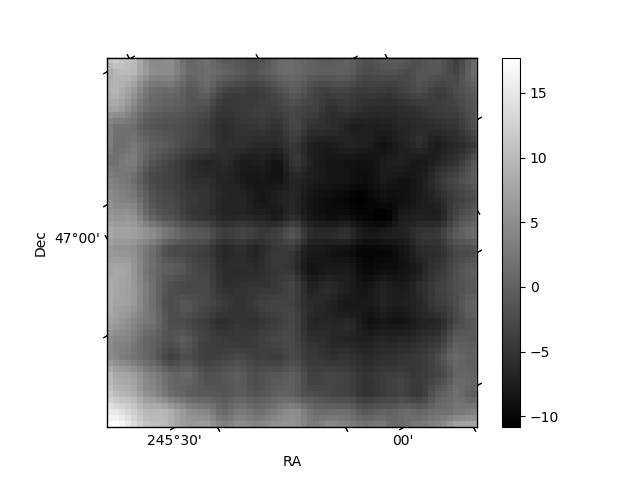
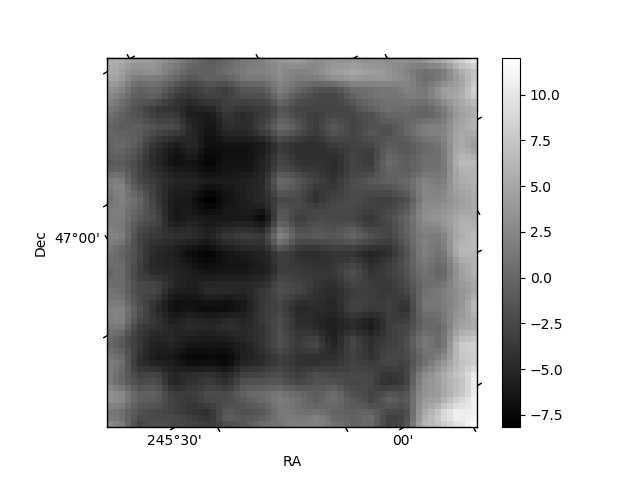
Histogram calculated using DETX and DETY for each event in the final _common_clean file
| Quadrant A | 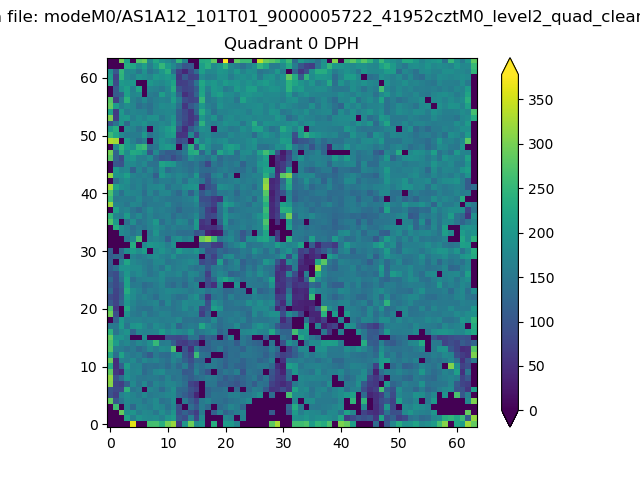 |
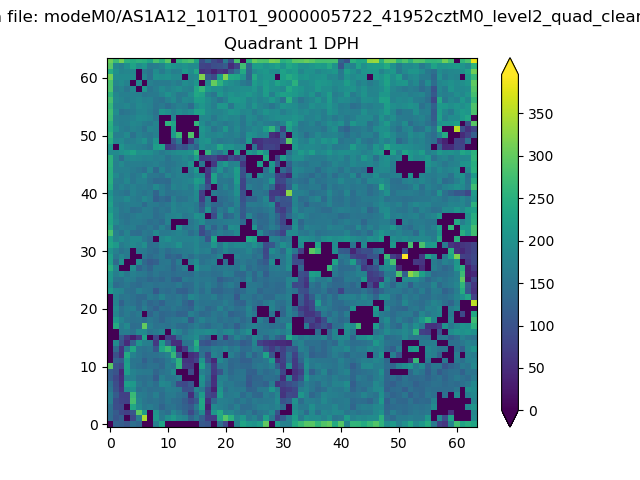 |
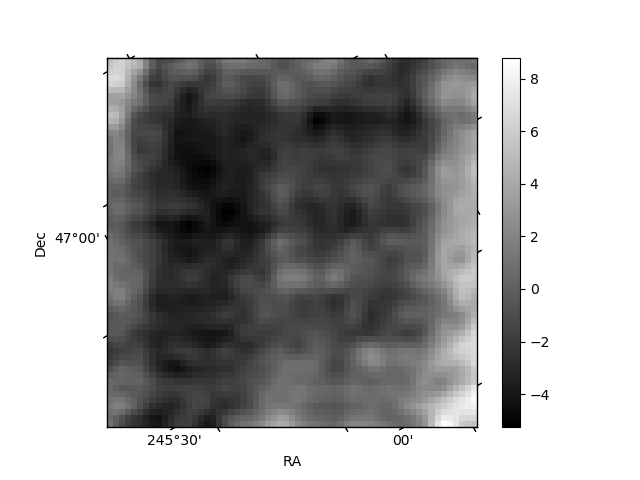
Quadrant B |
|---|---|---|---|
| Quadrant D | 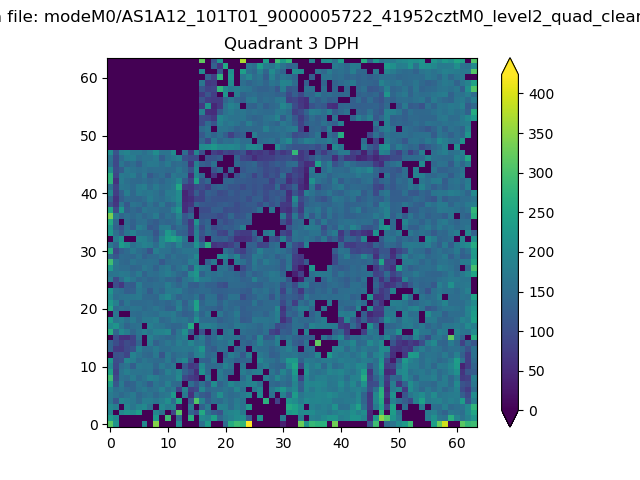 |
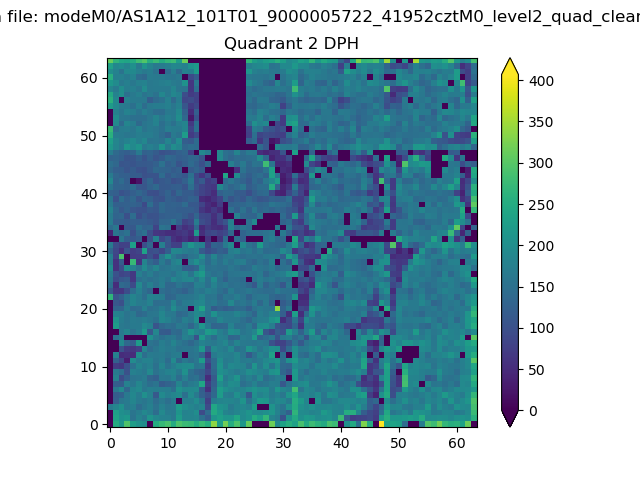 |
Quadrant C |
| Plot type | Count rate plots | Images |
|---|---|---|
| Comparison with Poisson distribution Blue bars denote a histogram of data divided into 1 sec bins. Red curve is a Poisson curve with rate = median count rate of data. |
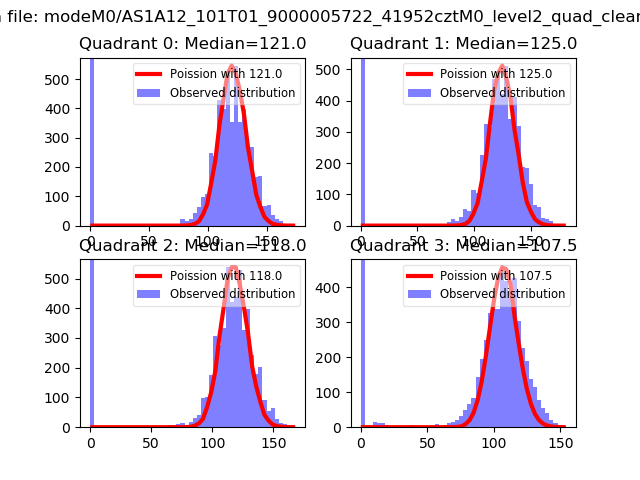 |
 |
| Quadrant-wise count rates Data is divided into 100 sec bins |
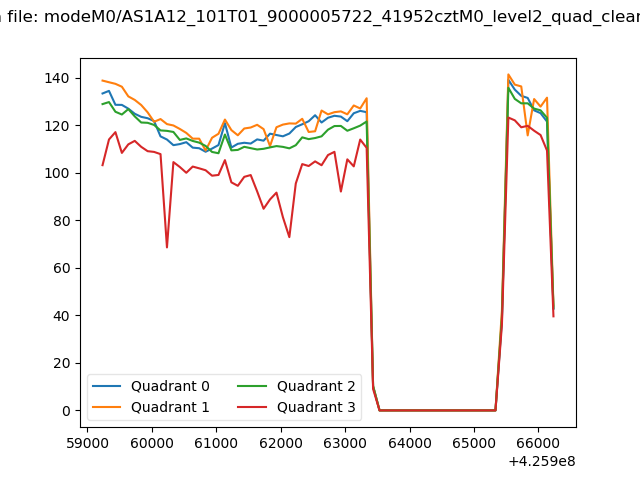 |
|
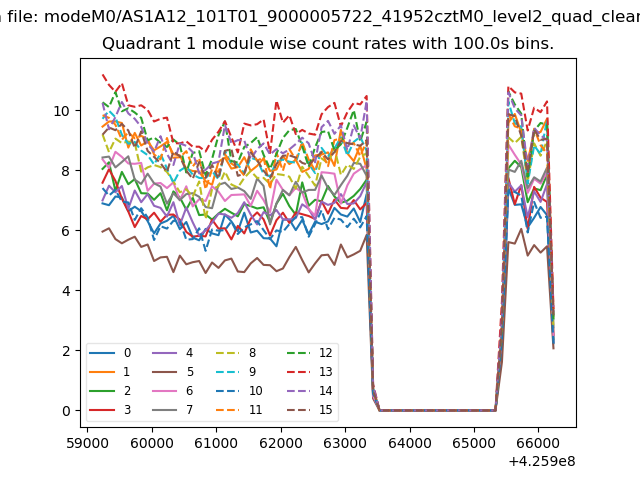
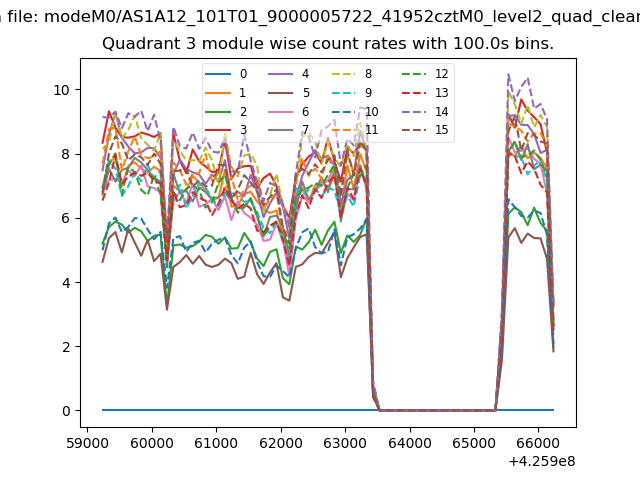
| Module-wise count rates for Quadrant A Data is divided into 100 sec bins |
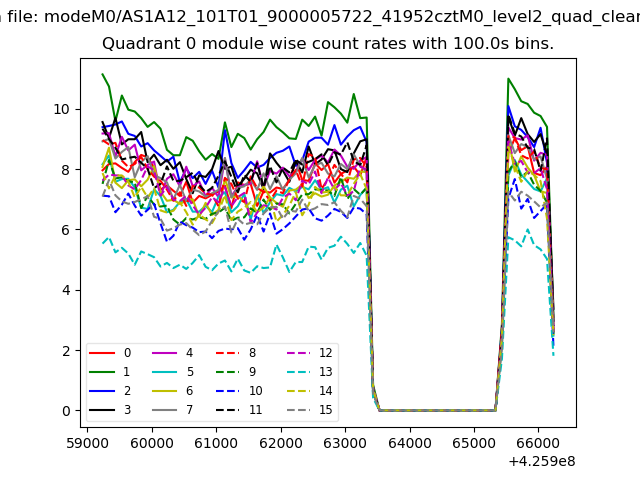 |
 |
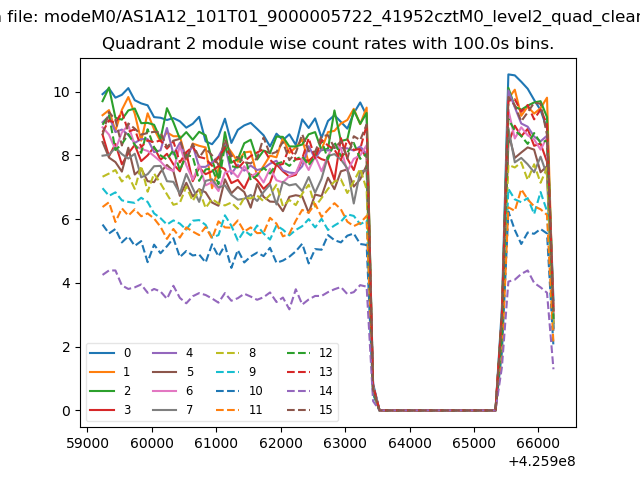
| Module-wise count rates for Quadrant B Data is divided into 100 sec bins |
 |
 |
| Module-wise count rates for Quadrant C Data is divided into 100 sec bins |
 |
 |
| Module-wise count rates for Quadrant D Data is divided into 100 sec bins |
 |
 |
| Parameter | Plot |
|---|---|
| CZT HV Monitor | 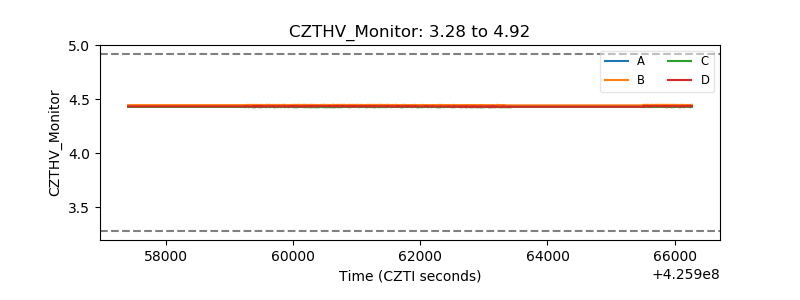 |
| D_VDD | 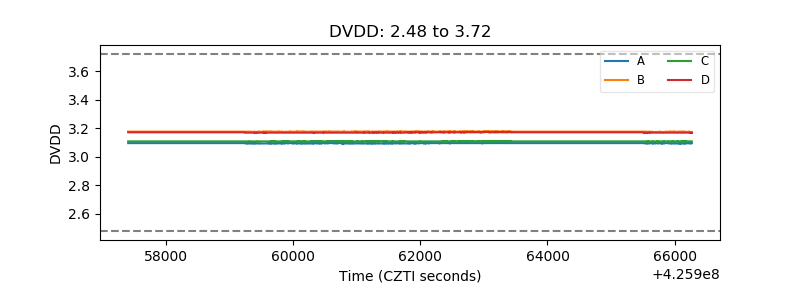 |
| Temperature 1 | 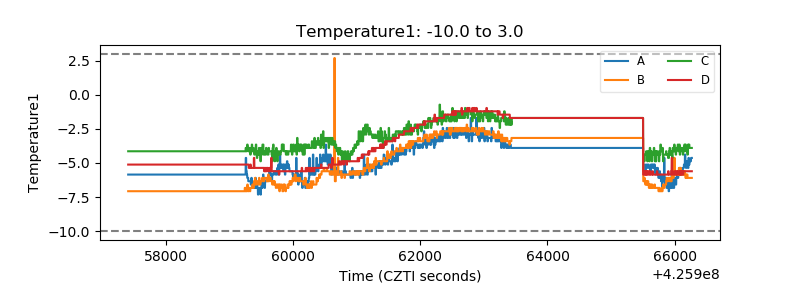 |
| Veto HV Monitor | 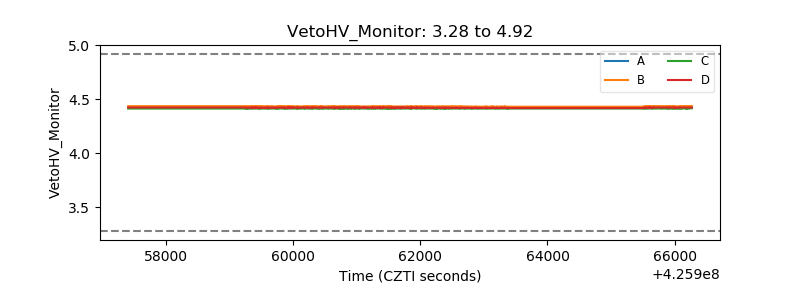 |
| Veto LLD | 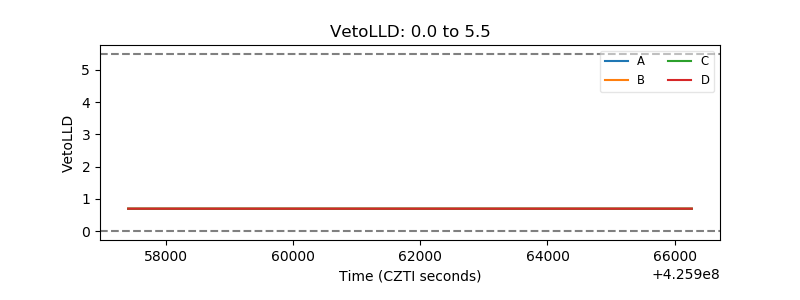 |
| Alpha Counter | 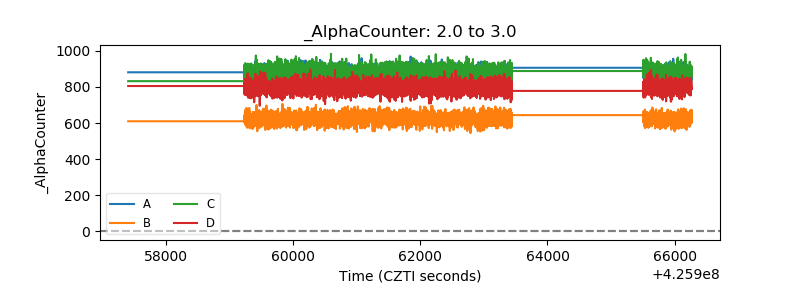 |
| _CPM_Rate | 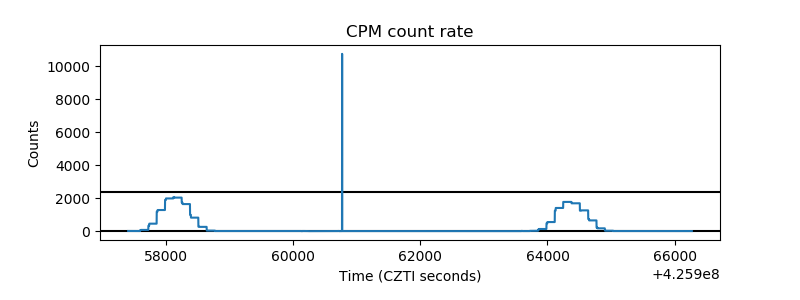 |
| CZT Counter | 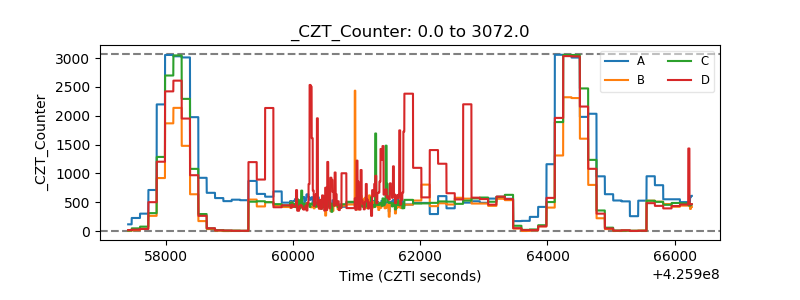 |
| +2.5 Volts monitor | 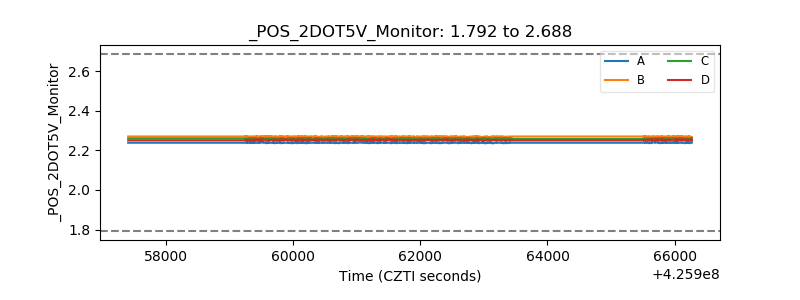 |
| +5 Volts monitor | 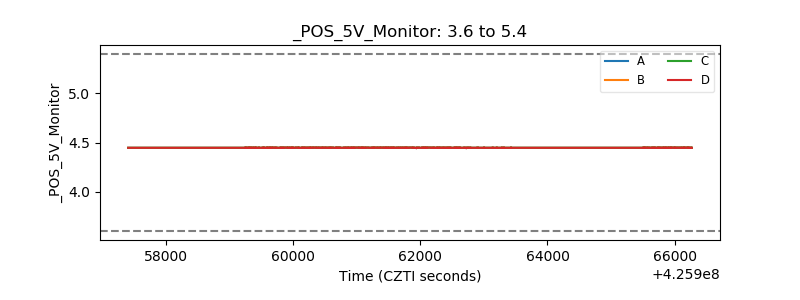 |
| _ROLL_ROT |  |
| _Roll_DEC | 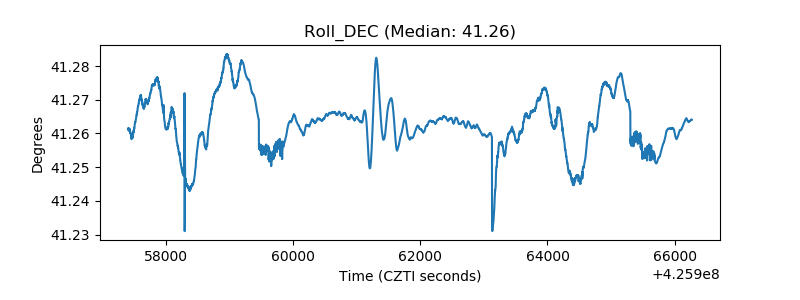 |
| _Roll_RA | 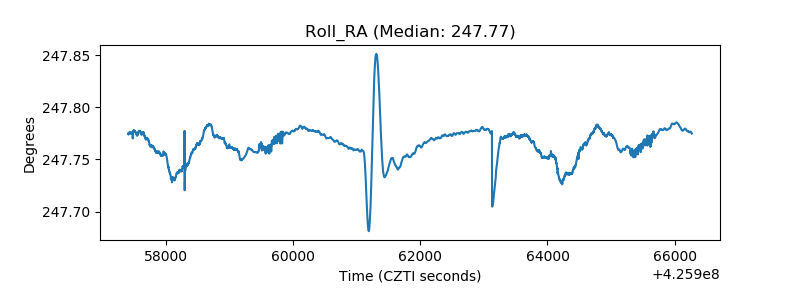 |
| Veto Counter | 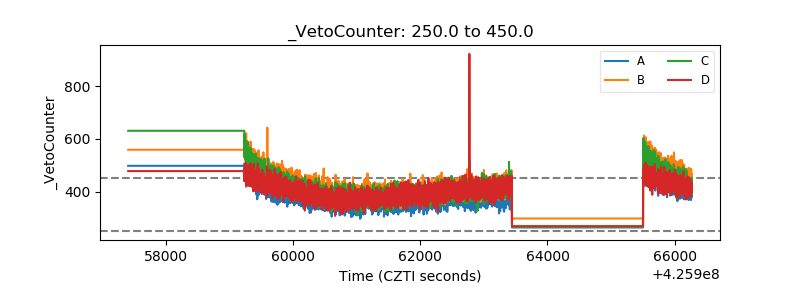 |