| Param | Original file | Final file |
|---|---|---|
| Filename | modeM0/AS1A12_101T01_9000005722_41953cztM0_level2.fits | modeM0/AS1A12_101T01_9000005722_41953cztM0_level2_quad_clean.evt |
| Size (bytes) | 319,265,280 | 89,953,920 |
| Size | 304.5 MB | 85.8 MB |
| Events in quadrant A | 2,965,228 | 610,638 |
| Events in quadrant B | 2,597,434 | 631,615 |
| Events in quadrant C | 2,452,750 | 598,127 |
| Events in quadrant D | 3,408,938 | 529,304 |
| Mode M0 | |||
|---|---|---|---|
| Quadrant | BADHDUFLAG | Total packets | Discarded packets |
| A | 0 | 11719 | 2 |
| B | 0 | 10971 | 4 |
| C | 0 | 10218 | 2 |
| D | 0 | 13475 | 2 |
| Mode M9 | |||
|---|---|---|---|
| Quadrant | BADHDUFLAG | Total packets | Discarded packets |
| A | 0 | 35 | 0 |
| B | 0 | 36 | 0 |
| C | 0 | 36 | 0 |
| D | 0 | 36 | 0 |
| Mode SS | |||
|---|---|---|---|
| Quadrant | BADHDUFLAG | Total packets | Discarded packets |
| A | 0 | 104 | 0 |
| B | 0 | 104 | 0 |
| C | 0 | 104 | 0 |
| D | 0 | 104 | 0 |
| Quadrant | Total seconds | Saturated seconds | Saturation percentage |
|---|---|---|---|
| A | 5054 | 57 | 1.127820% |
| B | 5053 | 69 | 1.365525% |
| C | 5053 | 2 | 0.039580% |
| D | 5053 | 246 | 4.868395% |
Noise dominated data is calculated using 1-second bins in cleaned event files. If a bin has >2000 counts, and if more than 50% of those come from <1% of pixels, then it is considered to be noise-dominated and hence unusable.
| Quadrant | # 1 sec bins | Bins with >0 counts | Bins with >2000 counts | High rate bins dominated by noise | Noise dominated (total time) | Noise dominated (detector-on time) | Marked lightcurve |
|---|---|---|---|---|---|---|---|
| A | 7177 | 5055 | 50 | 50 | 0.70% | 0.99% | 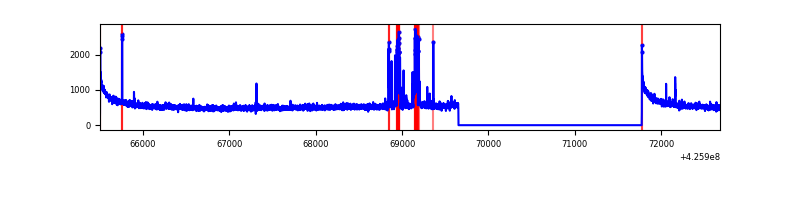 |
| B | 7176 | 5054 | 31 | 31 | 0.43% | 0.61% | 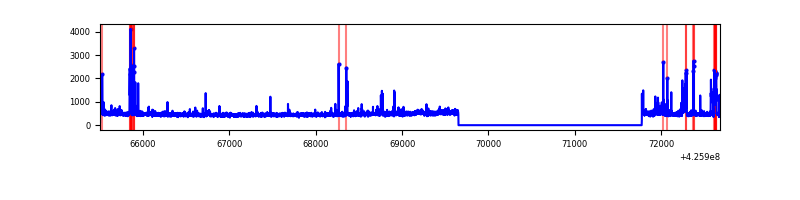 |
| C | 7176 | 5054 | 1 | 1 | 0.01% | 0.02% | 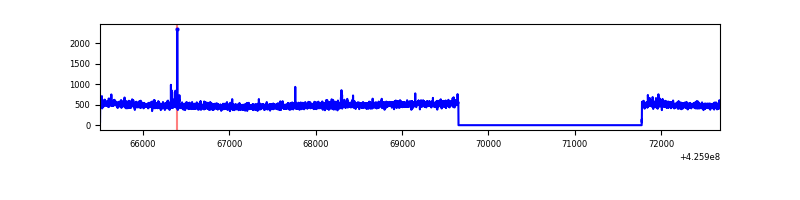 |
| D | 7176 | 5054 | 239 | 239 | 3.33% | 4.73% | 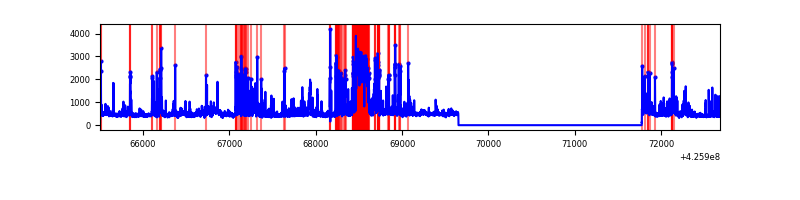 |
Top three noisy pixels from each quadrant. If the there are fewer than three noisy pixels in the level2.evt file, extra rows are filled as -1
| Pixel properties | Quadrant properties | ||||||
|---|---|---|---|---|---|---|---|
| Quadrant | DetID | PixID | Counts | Sigma | Mean | Median | Sigma |
| A | 10 | 83 | 507380 | 4296.82 | 584 | 574 | 117.9 |
| A | 2 | 79 | 191630 | 1619.82 | 584 | 574 | 117.9 |
| A | 13 | 248 | 7032 | 54.75 | 584 | 574 | 117.9 |
| B | 0 | 229 | 136685 | 1220.74 | 581 | 565 | 111.5 |
| B | 5 | 255 | 90440 | 806.01 | 581 | 565 | 111.5 |
| B | 3 | 112 | 50009 | 443.42 | 581 | 565 | 111.5 |
| C | 15 | 214 | 224529 | 1715.04 | 566 | 570 | 130.6 |
| C | 15 | 111 | 15727 | 116.07 | 566 | 570 | 130.6 |
| C | 13 | 61 | 3957 | 25.94 | 566 | 570 | 130.6 |
| D | 12 | 250 | 492884 | 3619.88 | 552 | 534 | 136.0 |
| D | 2 | 249 | 323251 | 2372.69 | 552 | 534 | 136.0 |
| D | 13 | 249 | 201729 | 1479.23 | 552 | 534 | 136.0 |
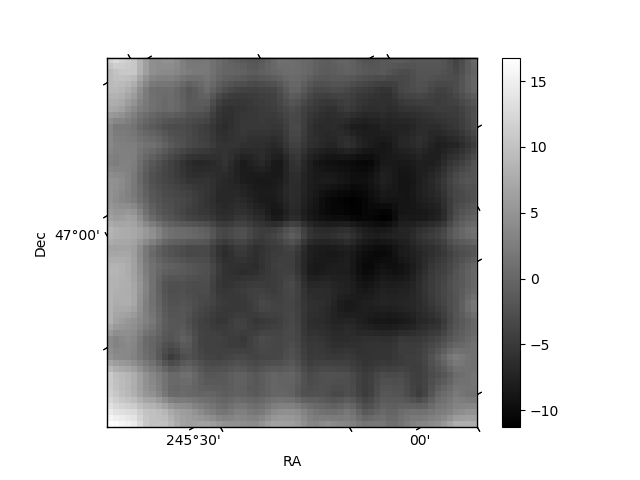
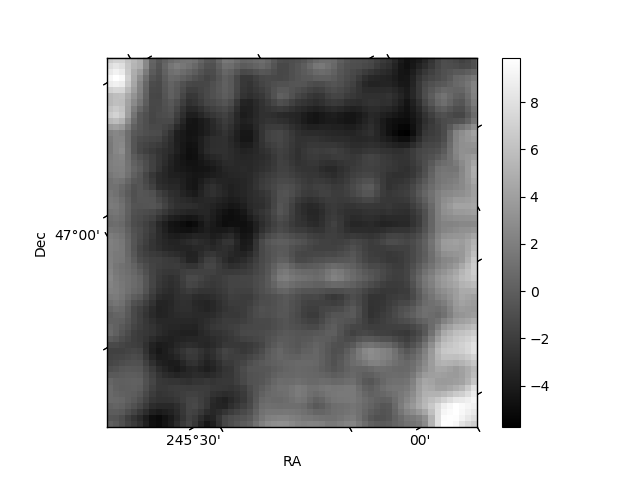
Histogram calculated using DETX and DETY for each event in the final _common_clean file
| Quadrant A | 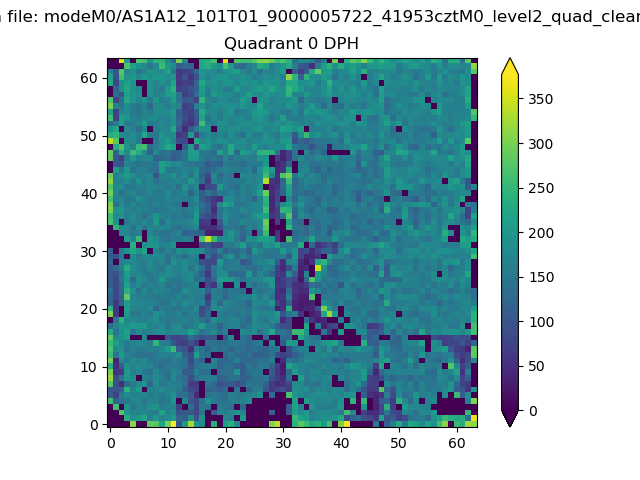 |
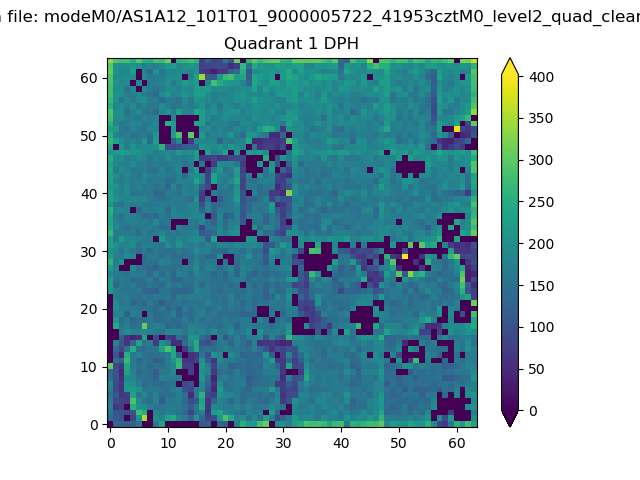 |
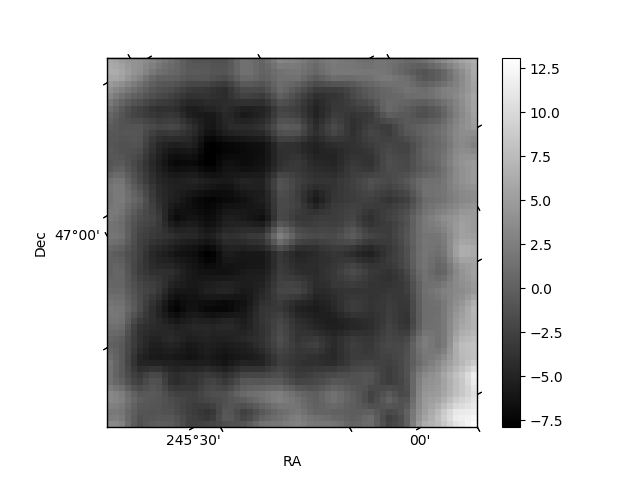
Quadrant B |
|---|---|---|---|
| Quadrant D | 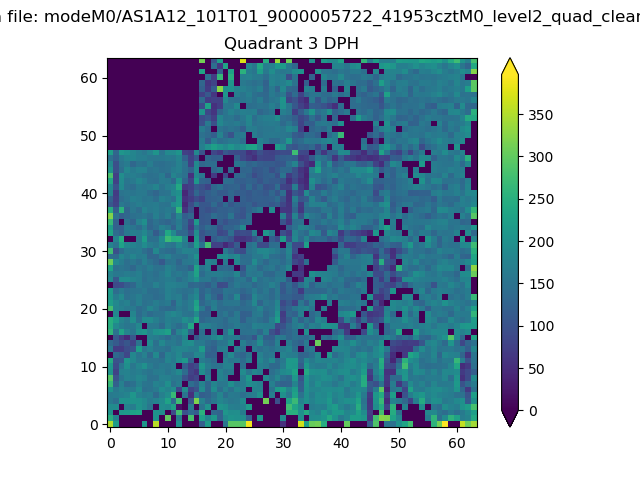 |
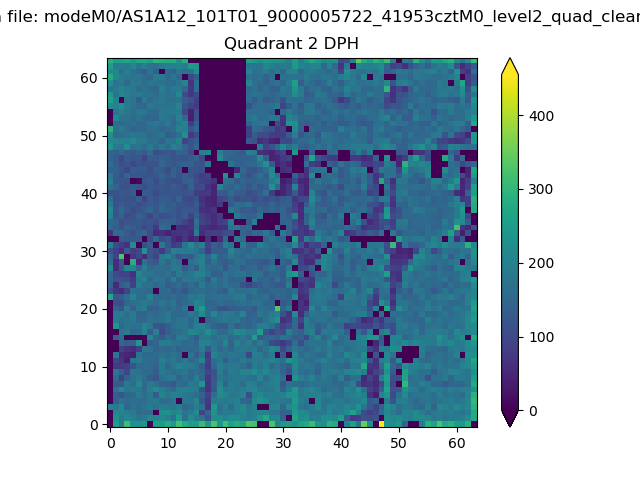 |
Quadrant C |
| Plot type | Count rate plots | Images |
|---|---|---|
| Comparison with Poisson distribution Blue bars denote a histogram of data divided into 1 sec bins. Red curve is a Poisson curve with rate = median count rate of data. |
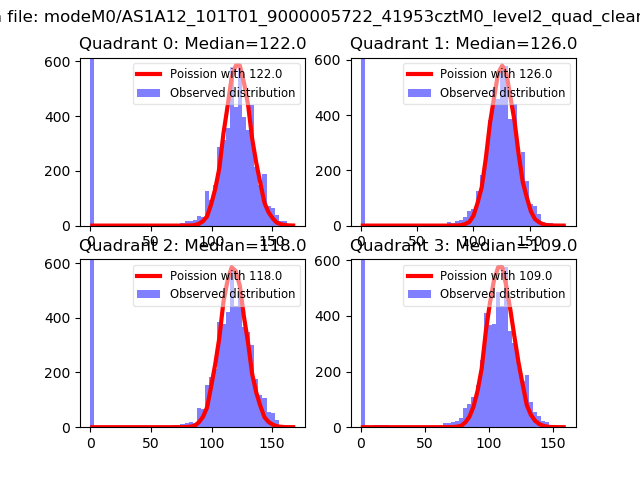 |
 |
| Quadrant-wise count rates Data is divided into 100 sec bins |
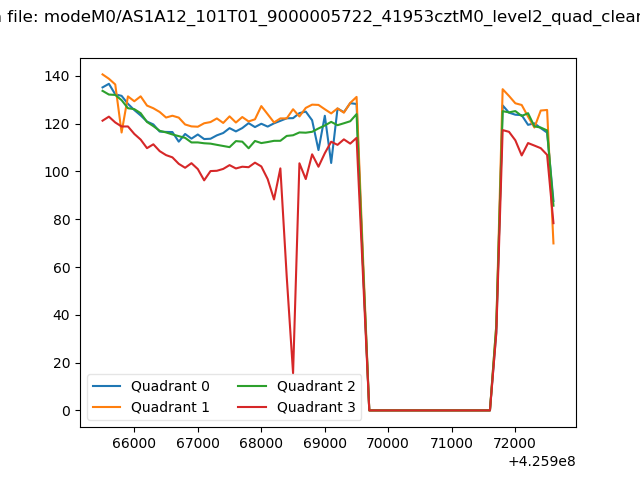 |
|
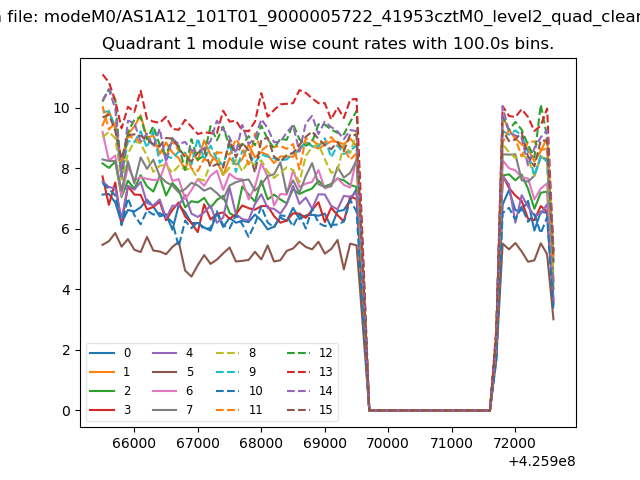
| Module-wise count rates for Quadrant A Data is divided into 100 sec bins |
 |
 |
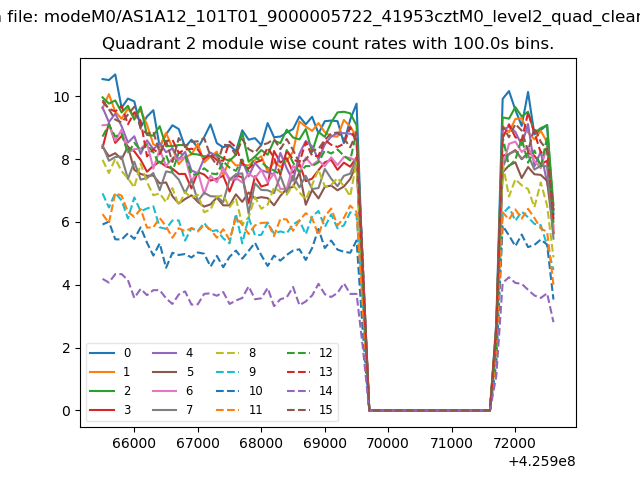
| Module-wise count rates for Quadrant B Data is divided into 100 sec bins |
 |
 |
| Module-wise count rates for Quadrant C Data is divided into 100 sec bins |
 |
 |
| Module-wise count rates for Quadrant D Data is divided into 100 sec bins |
 |
 |
| Parameter | Plot |
|---|---|
| CZT HV Monitor | 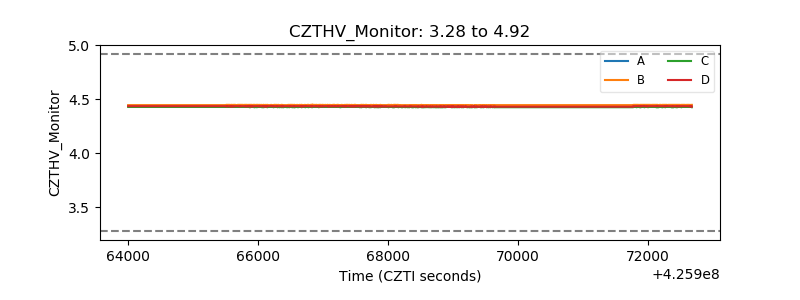 |
| D_VDD | 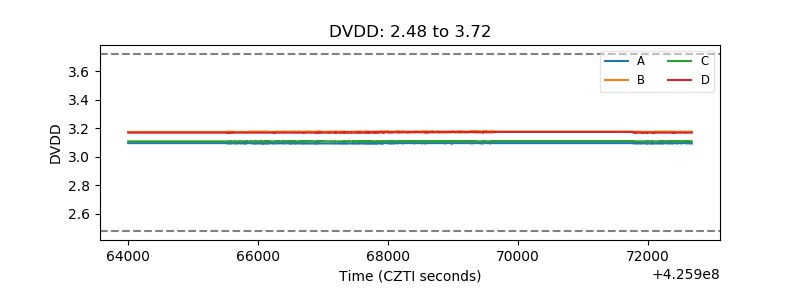 |
| Temperature 1 |  |
| Veto HV Monitor | 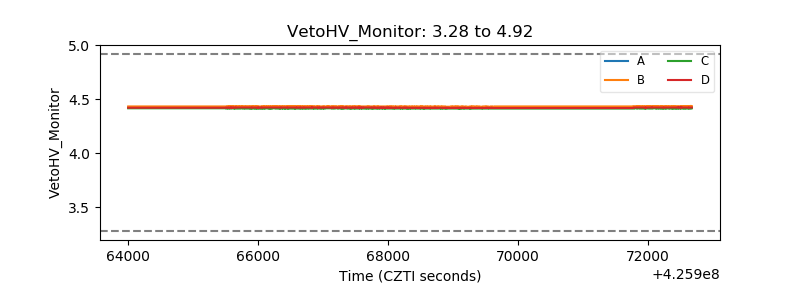 |
| Veto LLD | 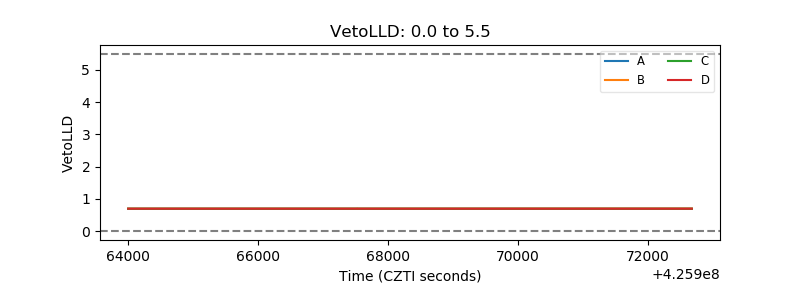 |
| Alpha Counter | 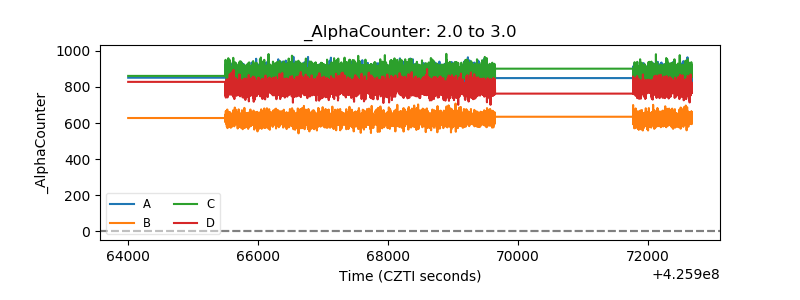 |
| _CPM_Rate | 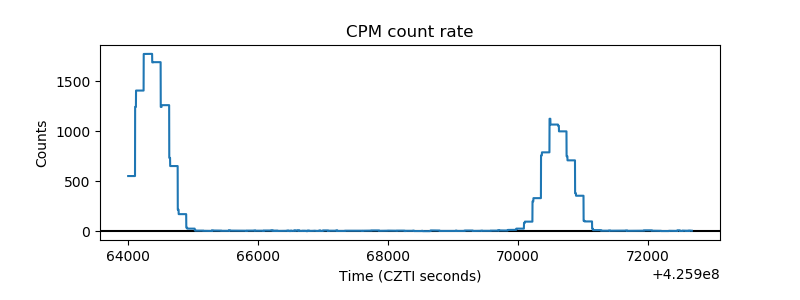 |
| CZT Counter | 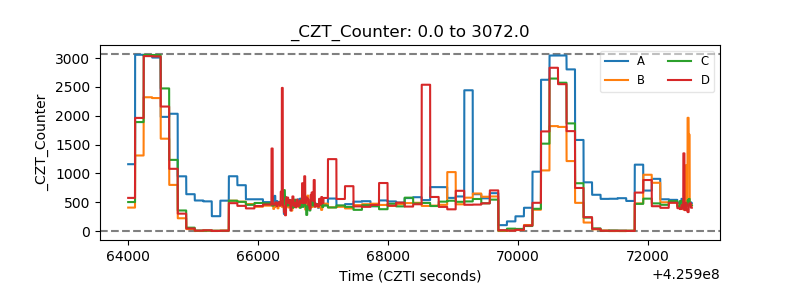 |
| +2.5 Volts monitor | 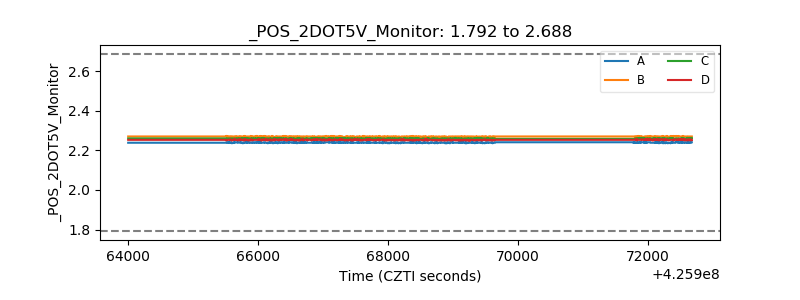 |
| +5 Volts monitor |  |
| _ROLL_ROT |  |
| _Roll_DEC | 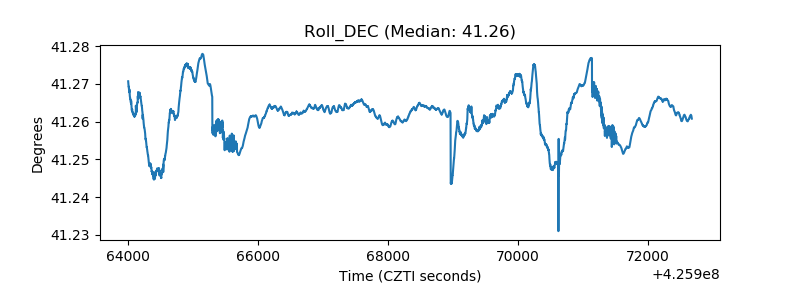 |
| _Roll_RA | 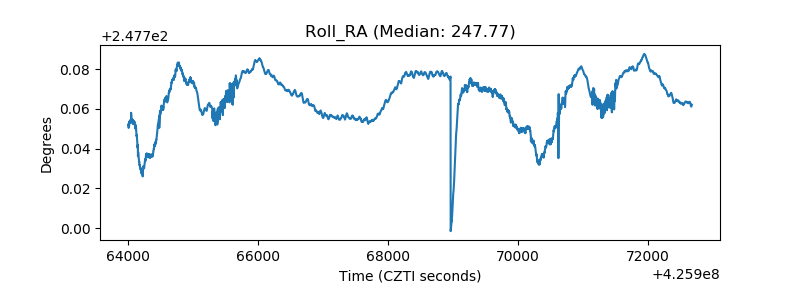 |
| Veto Counter | 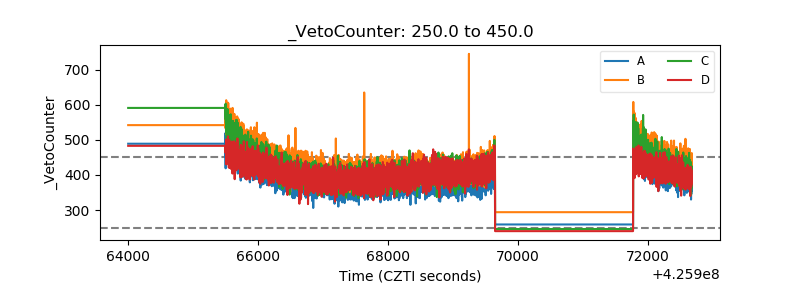 |