| Param | Original file | Final file |
|---|---|---|
| Filename | modeM0/AS1A12_101T01_9000005722_41954cztM0_level2.fits | modeM0/AS1A12_101T01_9000005722_41954cztM0_level2_quad_clean.evt |
| Size (bytes) | 301,086,720 | 87,837,120 |
| Size | 287.1 MB | 83.8 MB |
| Events in quadrant A | 2,760,527 | 595,076 |
| Events in quadrant B | 2,820,606 | 603,688 |
| Events in quadrant C | 2,394,595 | 580,115 |
| Events in quadrant D | 2,776,698 | 528,001 |
| Mode M0 | |||
|---|---|---|---|
| Quadrant | BADHDUFLAG | Total packets | Discarded packets |
| A | 0 | 11006 | 3 |
| B | 0 | 11701 | 2 |
| C | 0 | 10125 | 2 |
| D | 0 | 11712 | 2 |
| Mode M9 | |||
|---|---|---|---|
| Quadrant | BADHDUFLAG | Total packets | Discarded packets |
| A | 0 | 33 | 0 |
| B | 0 | 33 | 0 |
| C | 0 | 33 | 0 |
| D | 0 | 34 | 0 |
| Mode SS | |||
|---|---|---|---|
| Quadrant | BADHDUFLAG | Total packets | Discarded packets |
| A | 0 | 102 | 0 |
| B | 0 | 102 | 0 |
| C | 0 | 102 | 0 |
| D | 0 | 102 | 0 |
| Quadrant | Total seconds | Saturated seconds | Saturation percentage |
|---|---|---|---|
| A | 5037 | 11 | 0.218384% |
| B | 5037 | 138 | 2.739726% |
| C | 5037 | 2 | 0.039706% |
| D | 5037 | 83 | 1.647806% |
Noise dominated data is calculated using 1-second bins in cleaned event files. If a bin has >2000 counts, and if more than 50% of those come from <1% of pixels, then it is considered to be noise-dominated and hence unusable.
| Quadrant | # 1 sec bins | Bins with >0 counts | Bins with >2000 counts | High rate bins dominated by noise | Noise dominated (total time) | Noise dominated (detector-on time) | Marked lightcurve |
|---|---|---|---|---|---|---|---|
| A | 7190 | 5038 | 4 | 4 | 0.06% | 0.08% | 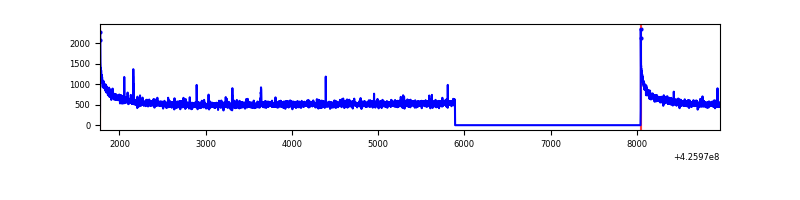 |
| B | 7190 | 5038 | 89 | 89 | 1.24% | 1.77% | 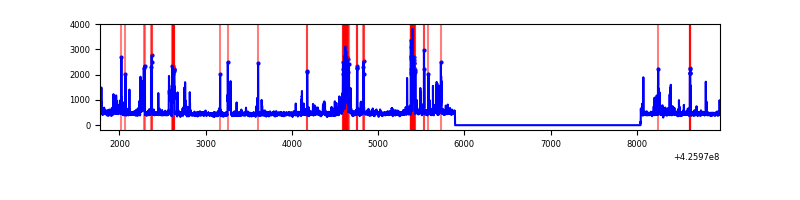 |
| C | 7190 | 5038 | 0 | 0 | 0.00% | 0.00% | 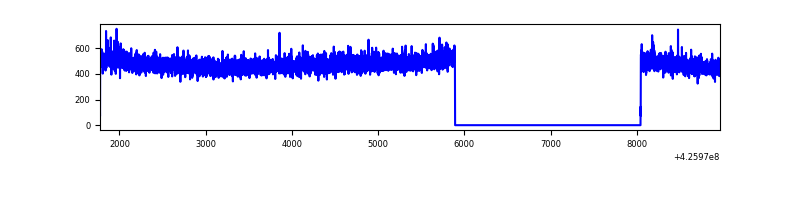 |
| D | 7190 | 5038 | 69 | 69 | 0.96% | 1.37% | 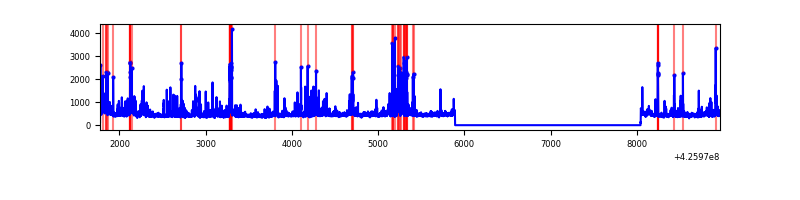 |
Top three noisy pixels from each quadrant. If the there are fewer than three noisy pixels in the level2.evt file, extra rows are filled as -1
| Pixel properties | Quadrant properties | ||||||
|---|---|---|---|---|---|---|---|
| Quadrant | DetID | PixID | Counts | Sigma | Mean | Median | Sigma |
| A | 10 | 83 | 515907 | 4336.06 | 576 | 565 | 118.9 |
| A | 2 | 79 | 14715 | 119.06 | 576 | 565 | 118.9 |
| A | 13 | 6 | 6778 | 52.28 | 576 | 565 | 118.9 |
| B | 0 | 229 | 396882 | 3679.3 | 563 | 548 | 107.7 |
| B | 5 | 255 | 144115 | 1332.78 | 563 | 548 | 107.7 |
| B | 0 | 190 | 37393 | 342.04 | 563 | 548 | 107.7 |
| C | 15 | 214 | 221811 | 1720.0 | 555 | 560 | 128.6 |
| C | 3 | 233 | 6150 | 43.46 | 555 | 560 | 128.6 |
| C | 13 | 61 | 3793 | 25.13 | 555 | 560 | 128.6 |
| D | 5 | 222 | 164143 | 1222.45 | 551 | 535 | 133.8 |
| D | 13 | 249 | 144823 | 1078.09 | 551 | 535 | 133.8 |
| D | 2 | 249 | 143078 | 1065.05 | 551 | 535 | 133.8 |
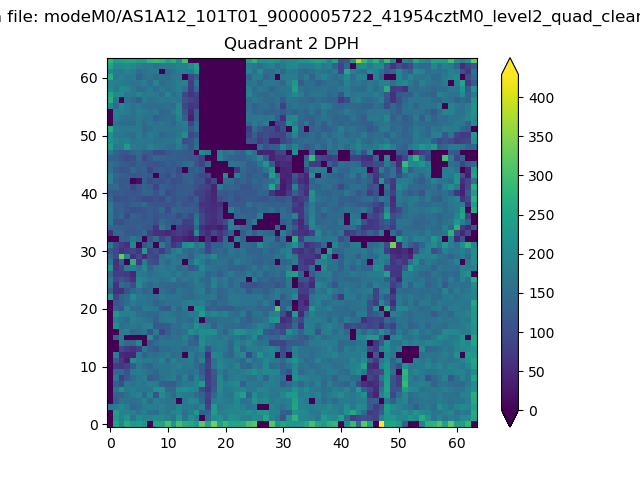
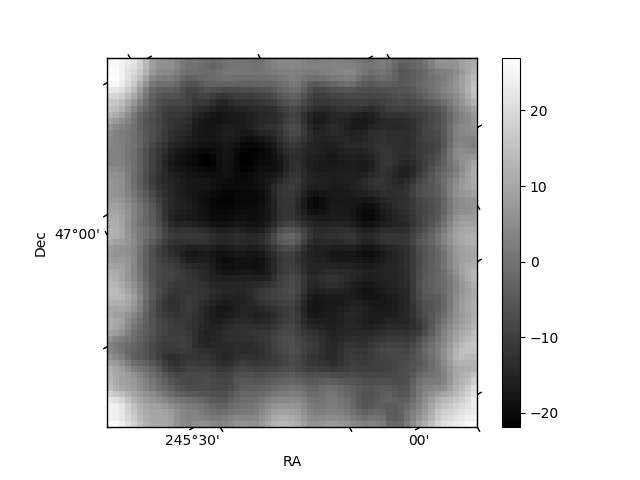
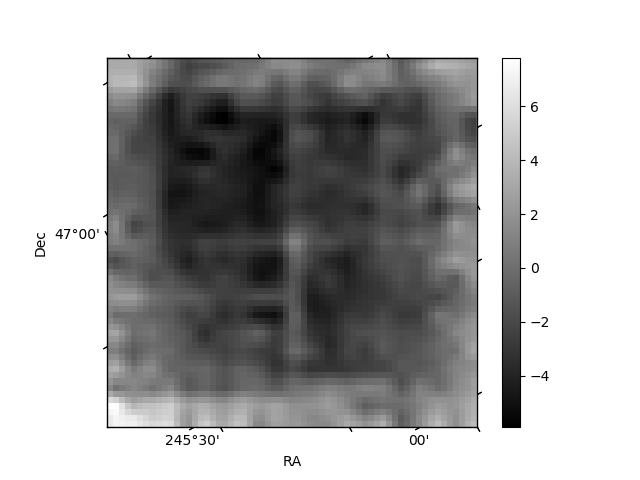
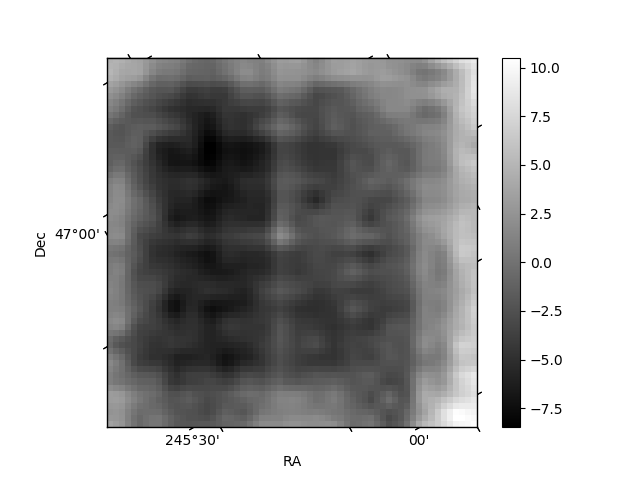
Histogram calculated using DETX and DETY for each event in the final _common_clean file
| Quadrant A | 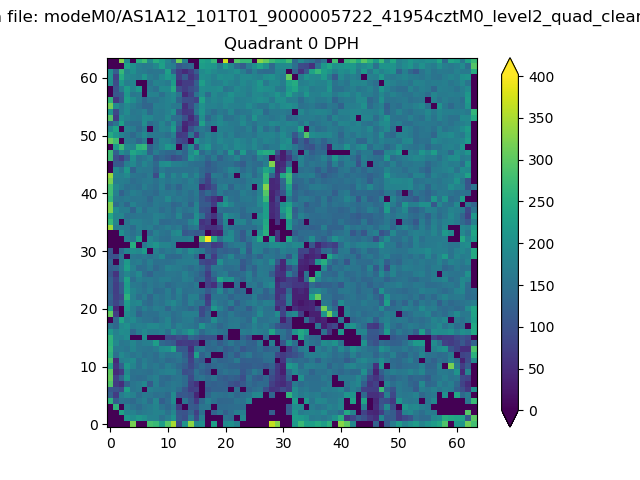 |
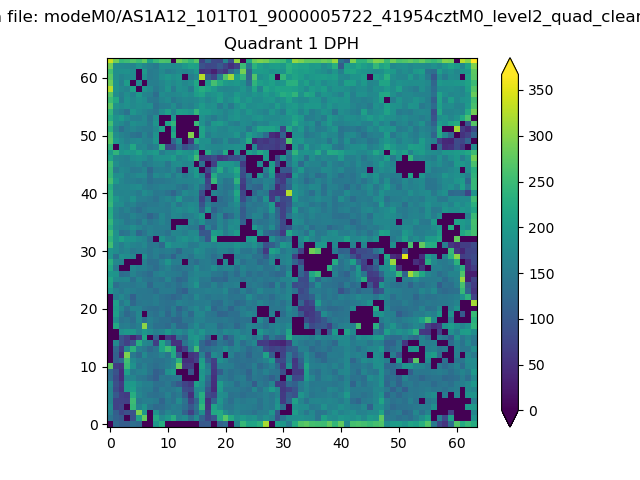 |
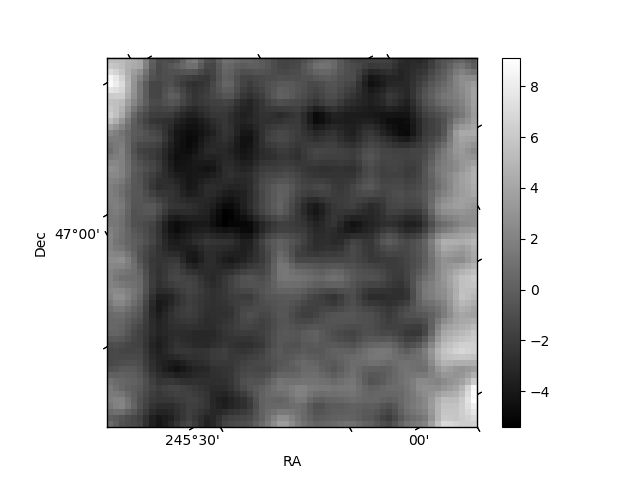
Quadrant B |
|---|---|---|---|
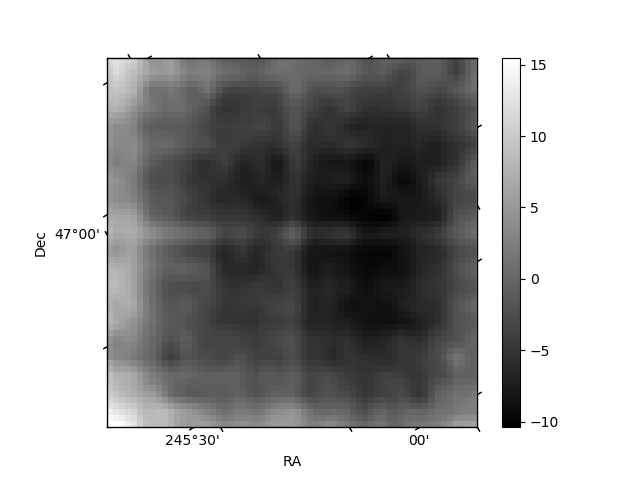
| Quadrant D | 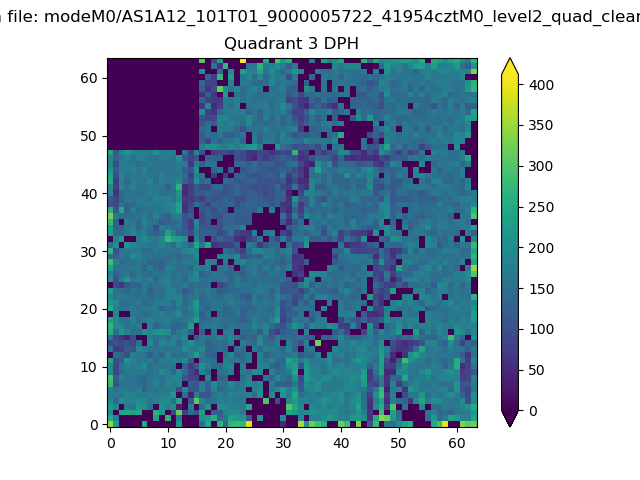 |
 |
Quadrant C |
| Plot type | Count rate plots | Images |
|---|---|---|
| Comparison with Poisson distribution Blue bars denote a histogram of data divided into 1 sec bins. Red curve is a Poisson curve with rate = median count rate of data. |
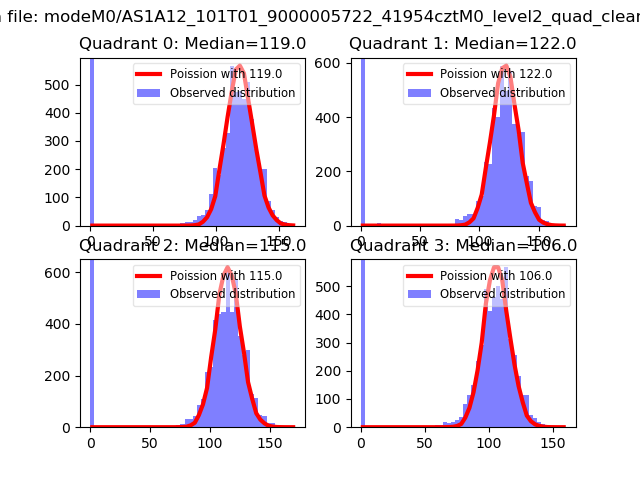 |
 |
| Quadrant-wise count rates Data is divided into 100 sec bins |
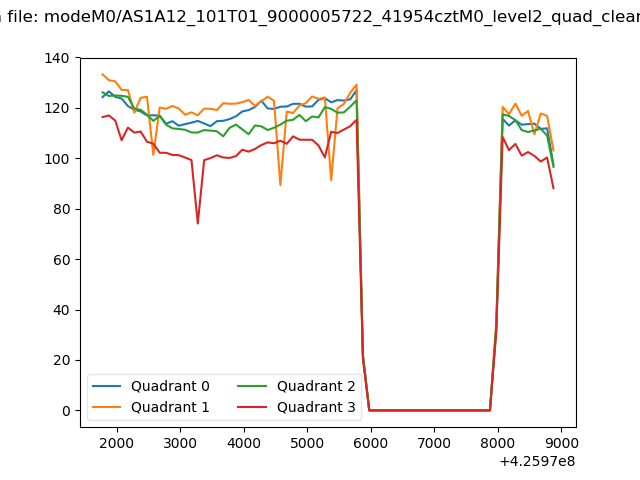 |
|
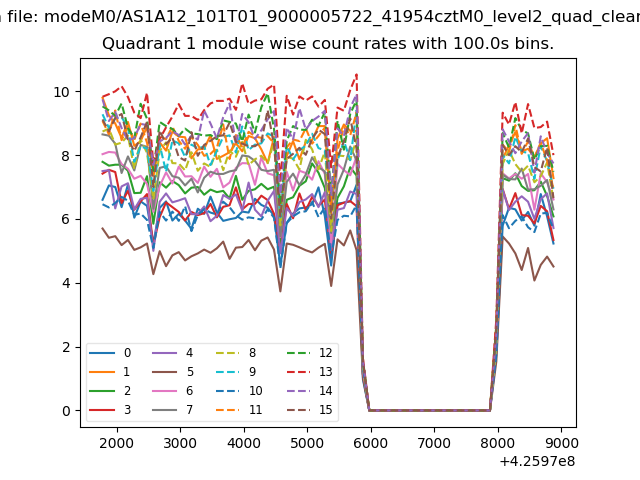
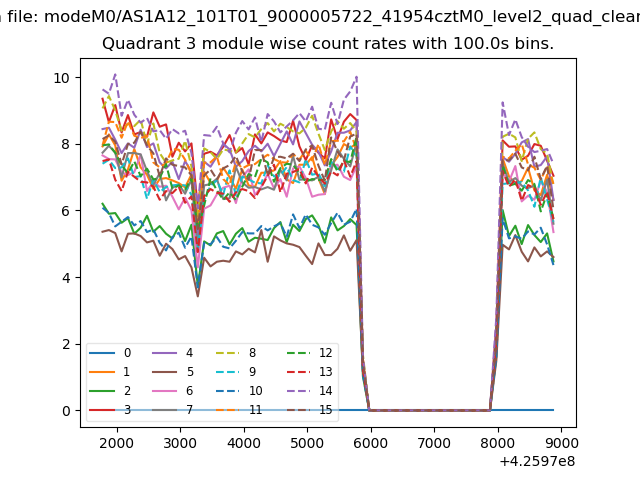
| Module-wise count rates for Quadrant A Data is divided into 100 sec bins |
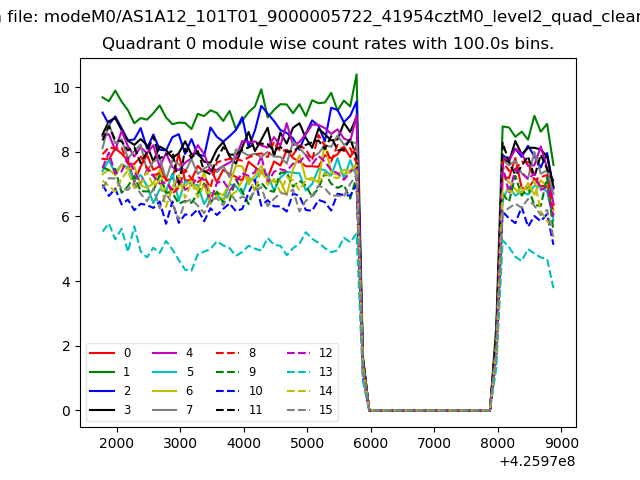 |
 |
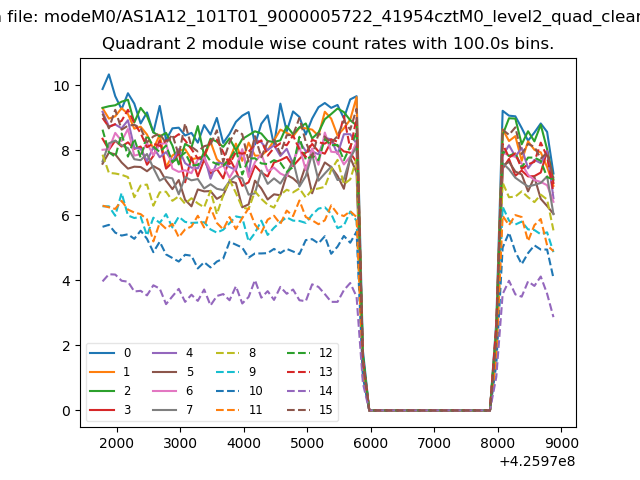
| Module-wise count rates for Quadrant B Data is divided into 100 sec bins |
 |
 |
| Module-wise count rates for Quadrant C Data is divided into 100 sec bins |
 |
 |
| Module-wise count rates for Quadrant D Data is divided into 100 sec bins |
 |
 |
| Parameter | Plot |
|---|---|
| CZT HV Monitor | 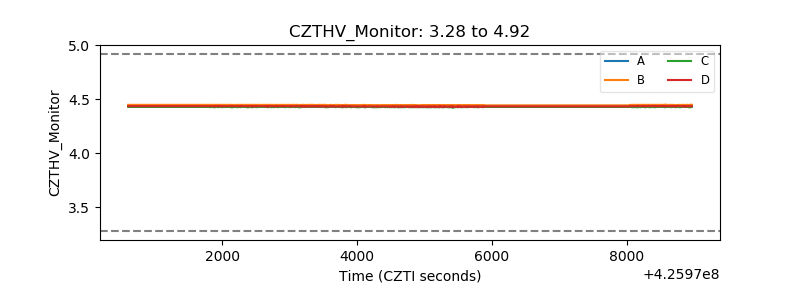 |
| D_VDD | 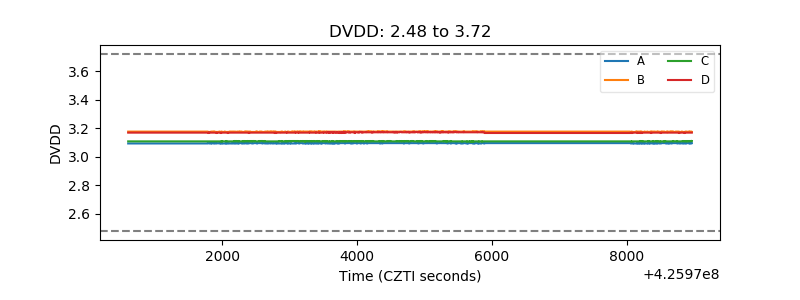 |
| Temperature 1 | 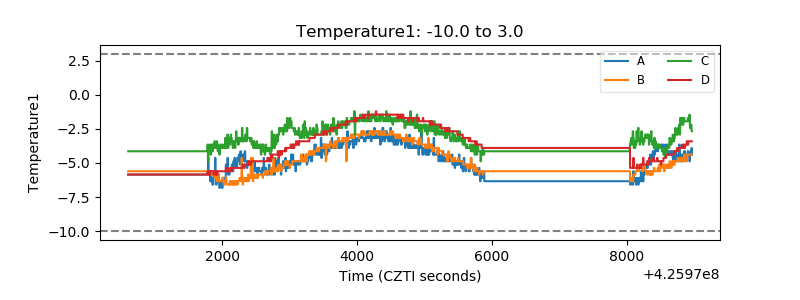 |
| Veto HV Monitor | 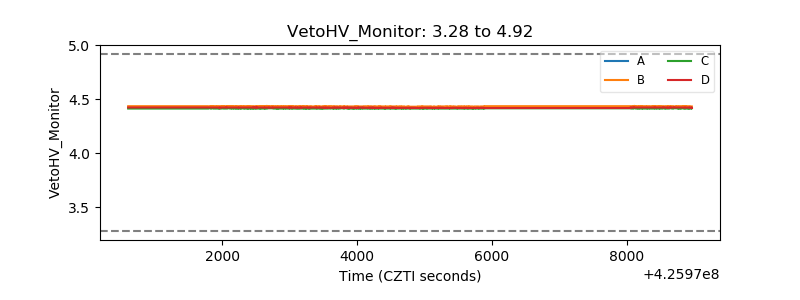 |
| Veto LLD | 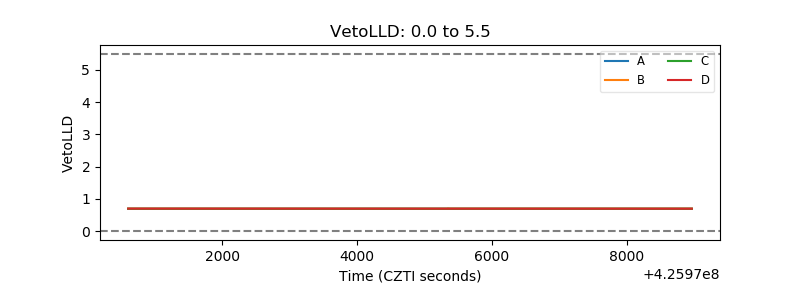 |
| Alpha Counter | 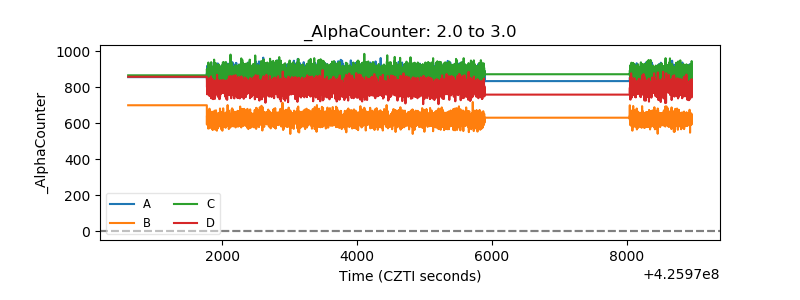 |
| _CPM_Rate | 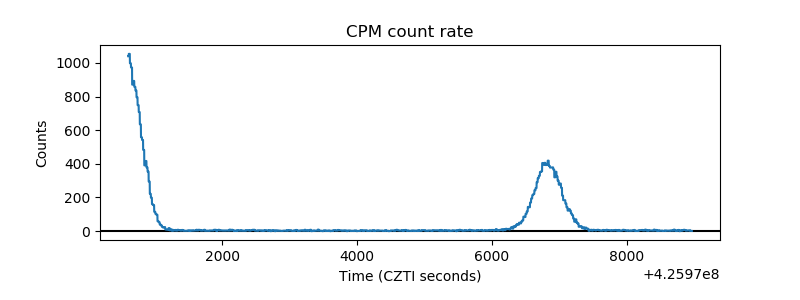 |
| CZT Counter | 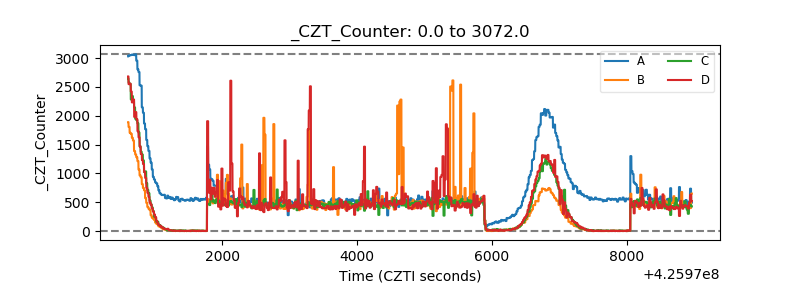 |
| +2.5 Volts monitor |  |
| +5 Volts monitor |  |
| _ROLL_ROT | 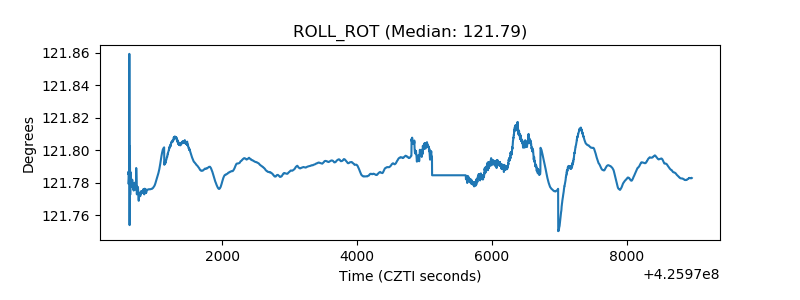 |
| _Roll_DEC | 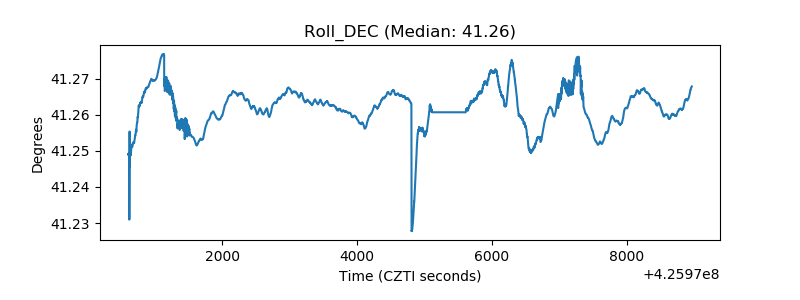 |
| _Roll_RA | 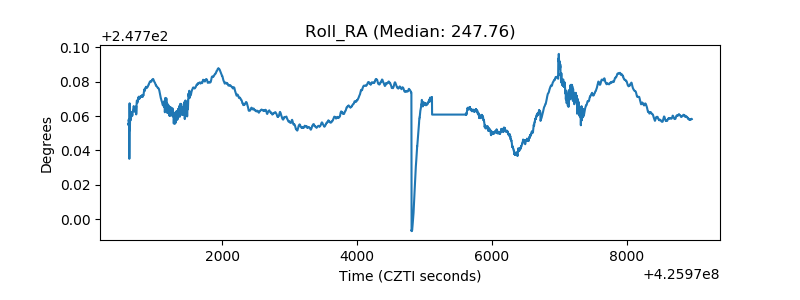 |
| Veto Counter | 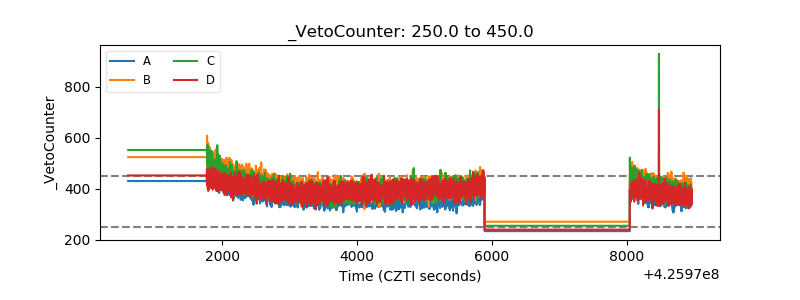 |