| Param | Original file | Final file |
|---|---|---|
| Filename | modeM0/AS1A12_101T01_9000005722_41955cztM0_level2.fits | modeM0/AS1A12_101T01_9000005722_41955cztM0_level2_quad_clean.evt |
| Size (bytes) | 319,976,640 | 94,216,320 |
| Size | 305.2 MB | 89.9 MB |
| Events in quadrant A | 2,987,944 | 634,766 |
| Events in quadrant B | 2,884,570 | 648,480 |
| Events in quadrant C | 2,611,438 | 616,975 |
| Events in quadrant D | 2,926,673 | 563,602 |
| Mode M0 | |||
|---|---|---|---|
| Quadrant | BADHDUFLAG | Total packets | Discarded packets |
| A | 0 | 12018 | 3 |
| B | 0 | 12301 | 2 |
| C | 0 | 11181 | 2 |
| D | 0 | 12521 | 2 |
| Mode M9 | |||
|---|---|---|---|
| Quadrant | BADHDUFLAG | Total packets | Discarded packets |
| A | 0 | 42 | 0 |
| B | 0 | 42 | 0 |
| C | 0 | 42 | 0 |
| D | 0 | 42 | 0 |
| Mode SS | |||
|---|---|---|---|
| Quadrant | BADHDUFLAG | Total packets | Discarded packets |
| A | 0 | 114 | 0 |
| B | 0 | 114 | 0 |
| C | 0 | 114 | 0 |
| D | 0 | 114 | 0 |
| Quadrant | Total seconds | Saturated seconds | Saturation percentage |
|---|---|---|---|
| A | 5567 | 10 | 0.179630% |
| B | 5567 | 90 | 1.616670% |
| C | 5567 | 4 | 0.071852% |
| D | 5567 | 59 | 1.059817% |
Noise dominated data is calculated using 1-second bins in cleaned event files. If a bin has >2000 counts, and if more than 50% of those come from <1% of pixels, then it is considered to be noise-dominated and hence unusable.
| Quadrant | # 1 sec bins | Bins with >0 counts | Bins with >2000 counts | High rate bins dominated by noise | Noise dominated (total time) | Noise dominated (detector-on time) | Marked lightcurve |
|---|---|---|---|---|---|---|---|
| A | 9723 | 5569 | 4 | 4 | 0.04% | 0.07% | 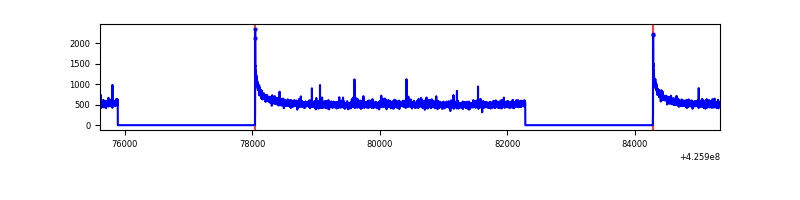 |
| B | 9723 | 5569 | 54 | 54 | 0.56% | 0.97% | 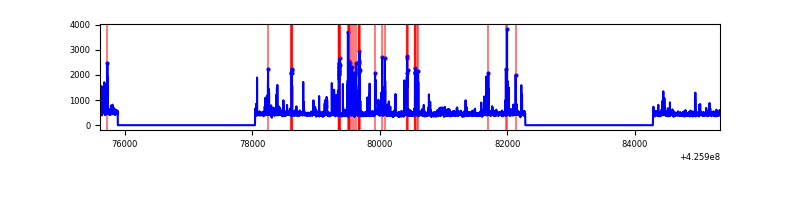 |
| C | 9723 | 5569 | 0 | 0 | 0.00% | 0.00% | 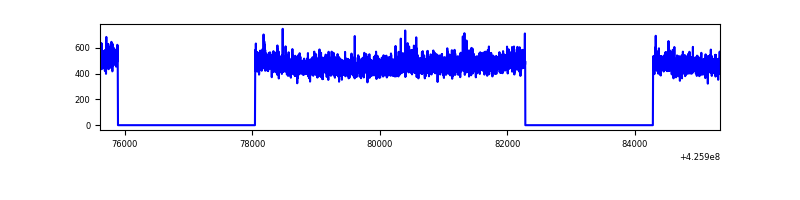 |
| D | 9723 | 5569 | 53 | 53 | 0.55% | 0.95% | 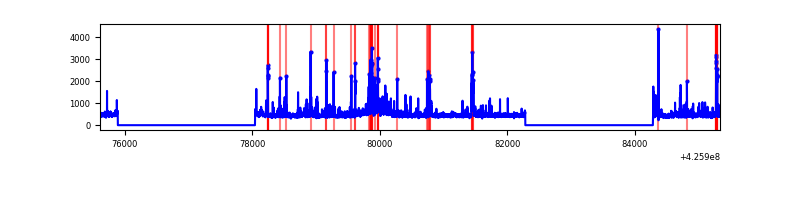 |
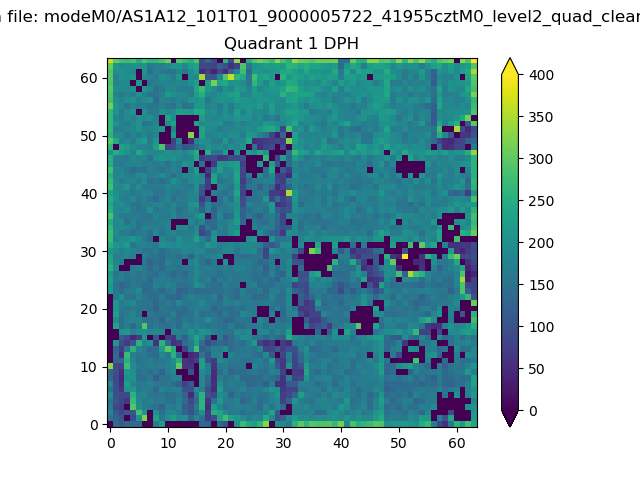
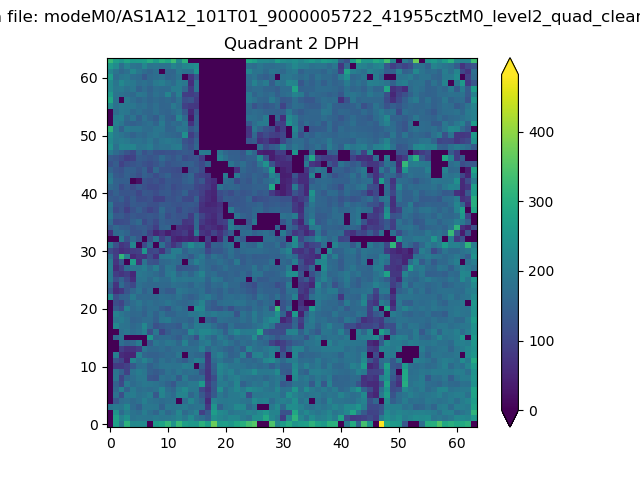
Top three noisy pixels from each quadrant. If the there are fewer than three noisy pixels in the level2.evt file, extra rows are filled as -1
| Pixel properties | Quadrant properties | ||||||
|---|---|---|---|---|---|---|---|
| Quadrant | DetID | PixID | Counts | Sigma | Mean | Median | Sigma |
| A | 10 | 83 | 555449 | 4319.62 | 623 | 611 | 128.4 |
| A | 2 | 79 | 18323 | 137.89 | 623 | 611 | 128.4 |
| A | 13 | 6 | 8253 | 59.5 | 623 | 611 | 128.4 |
| B | 0 | 229 | 274285 | 2320.37 | 615 | 598 | 117.9 |
| B | 5 | 255 | 142260 | 1201.04 | 615 | 598 | 117.9 |
| B | 0 | 190 | 51123 | 428.36 | 615 | 598 | 117.9 |
| C | 15 | 214 | 245162 | 1739.95 | 605 | 608 | 140.6 |
| C | 3 | 233 | 4786 | 29.73 | 605 | 608 | 140.6 |
| C | 13 | 61 | 4009 | 24.2 | 605 | 608 | 140.6 |
| D | 13 | 249 | 159637 | 1083.39 | 604 | 588 | 146.8 |
| D | 12 | 6 | 73681 | 497.89 | 604 | 588 | 146.8 |
| D | 2 | 249 | 67772 | 457.63 | 604 | 588 | 146.8 |
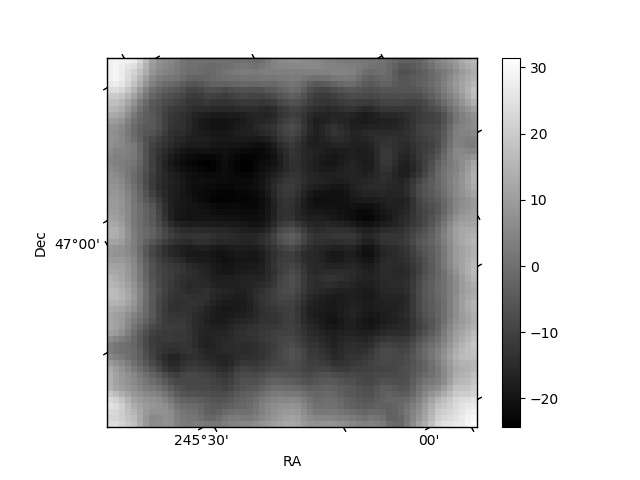
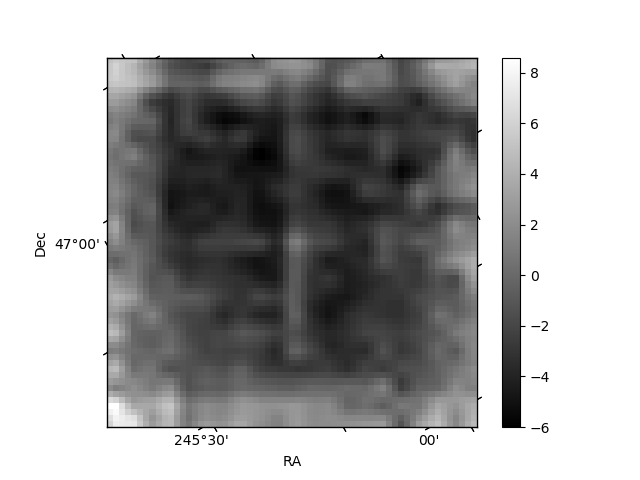
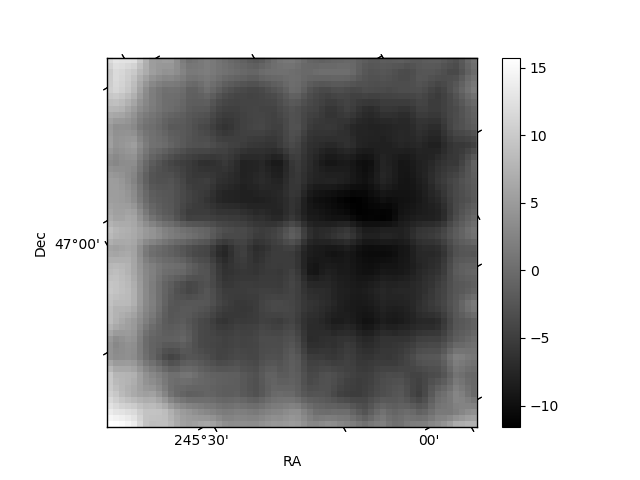
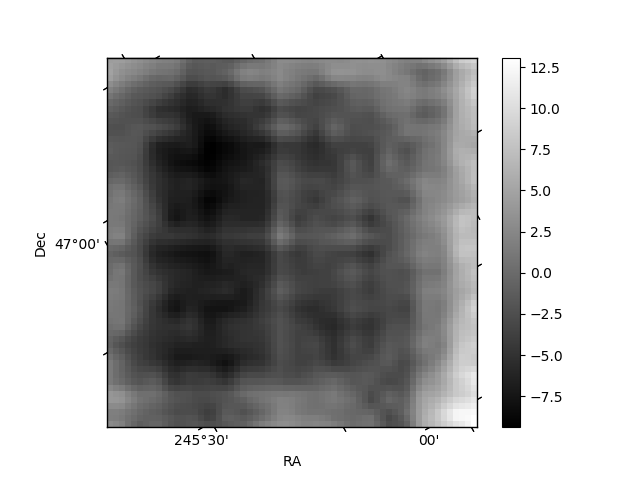
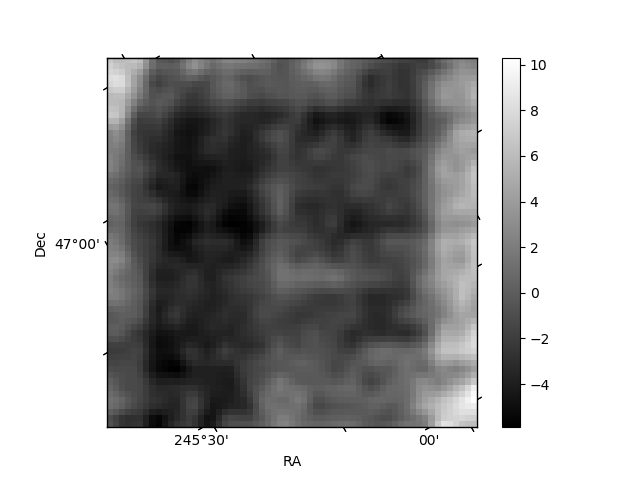
Histogram calculated using DETX and DETY for each event in the final _common_clean file
| Quadrant A | 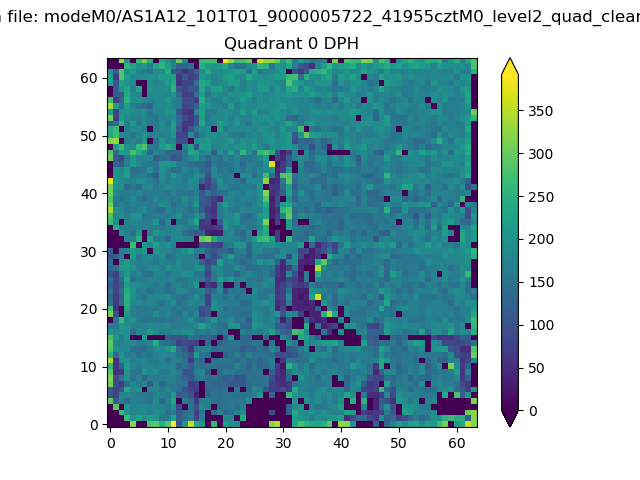 |
 |
Quadrant B |
|---|---|---|---|
| Quadrant D | 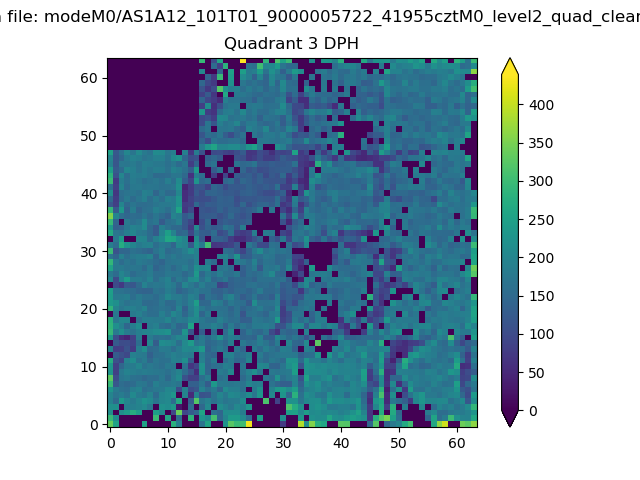 |
 |
Quadrant C |
| Plot type | Count rate plots | Images |
|---|---|---|
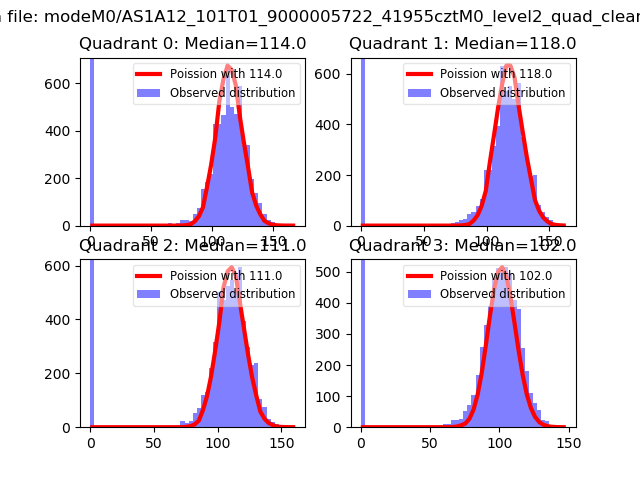
| Comparison with Poisson distribution Blue bars denote a histogram of data divided into 1 sec bins. Red curve is a Poisson curve with rate = median count rate of data. |
 |
 |
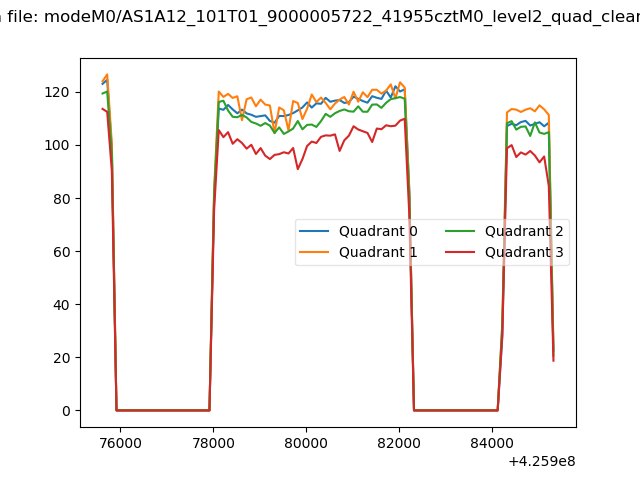
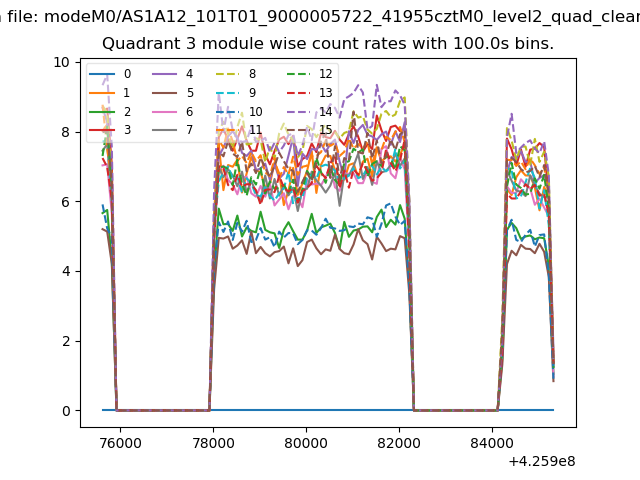
| Quadrant-wise count rates Data is divided into 100 sec bins |
 |
|
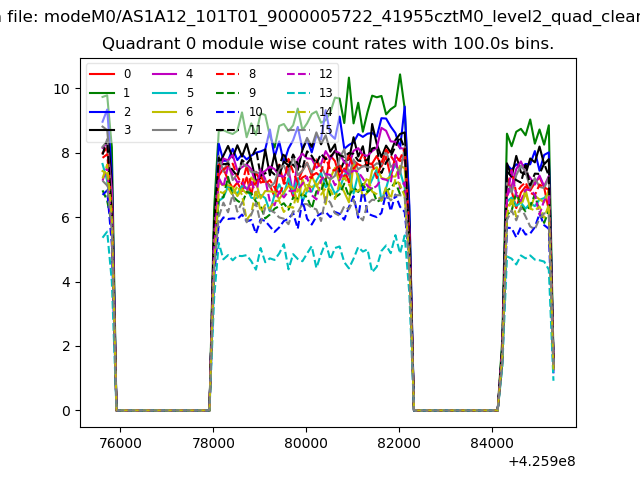
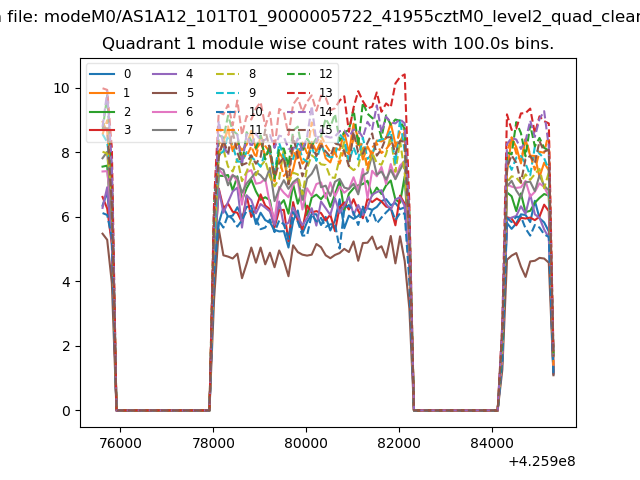
| Module-wise count rates for Quadrant A Data is divided into 100 sec bins |
 |
 |
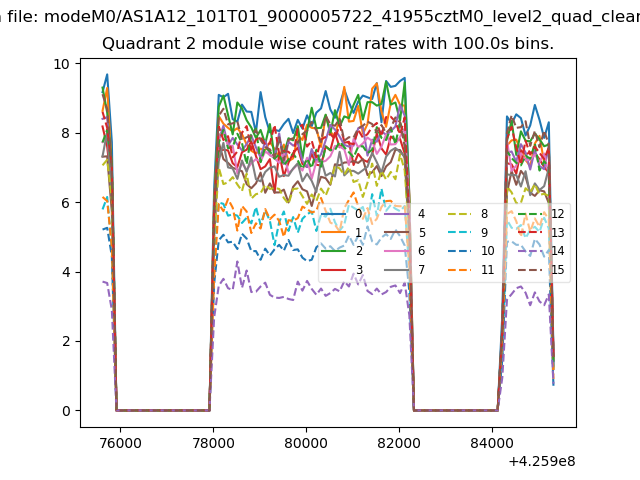
| Module-wise count rates for Quadrant B Data is divided into 100 sec bins |
 |
 |
| Module-wise count rates for Quadrant C Data is divided into 100 sec bins |
 |
 |
| Module-wise count rates for Quadrant D Data is divided into 100 sec bins |
 |
 |
| Parameter | Plot |
|---|---|
| CZT HV Monitor |  |
| D_VDD | 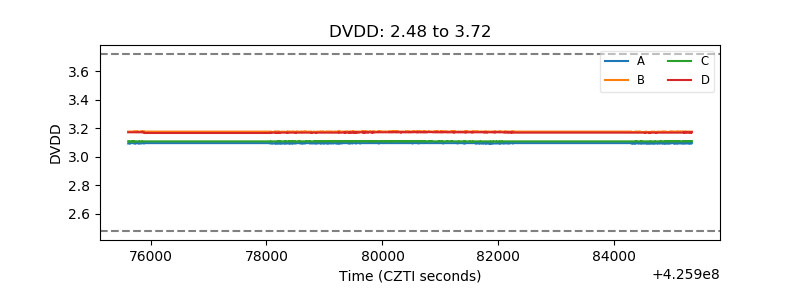 |
| Temperature 1 | 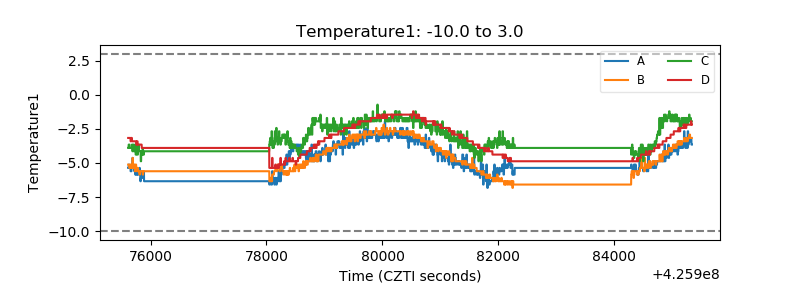 |
| Veto HV Monitor | 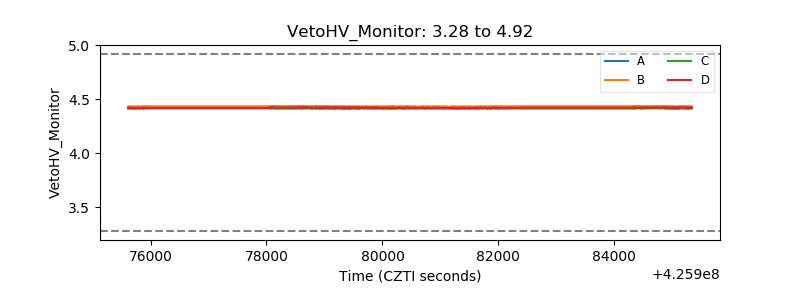 |
| Veto LLD | 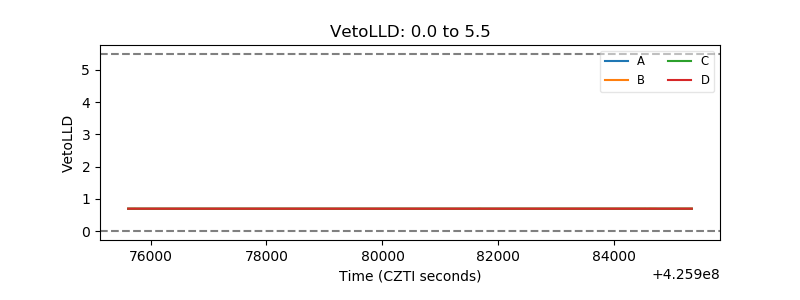 |
| Alpha Counter | 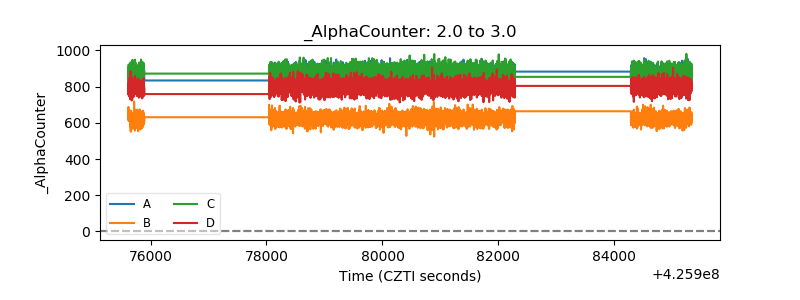 |
| _CPM_Rate | 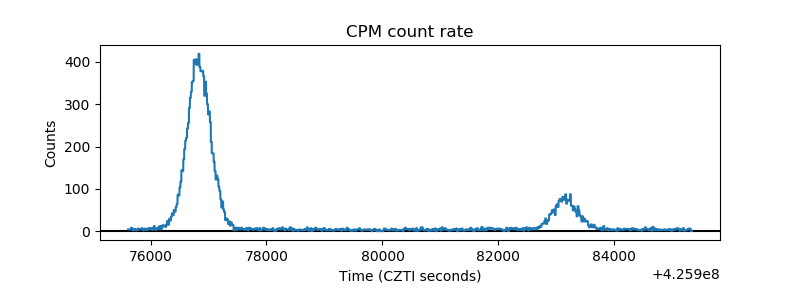 |
| CZT Counter | 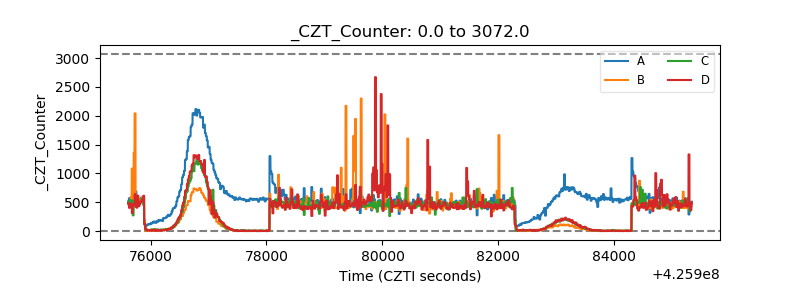 |
| +2.5 Volts monitor | 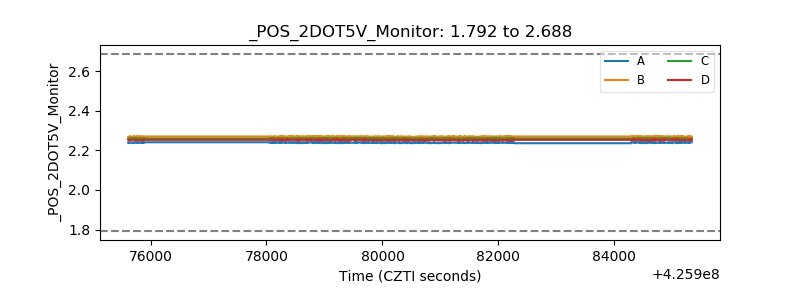 |
| +5 Volts monitor | 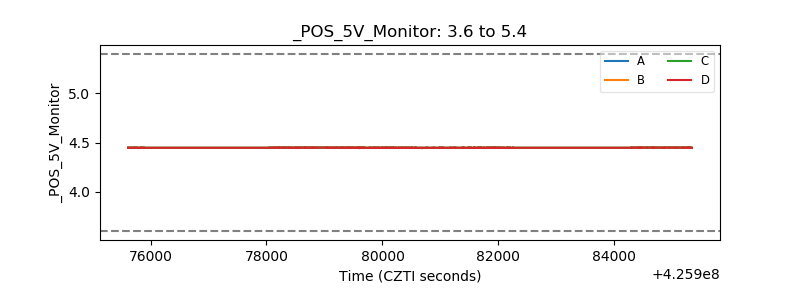 |
| _ROLL_ROT | 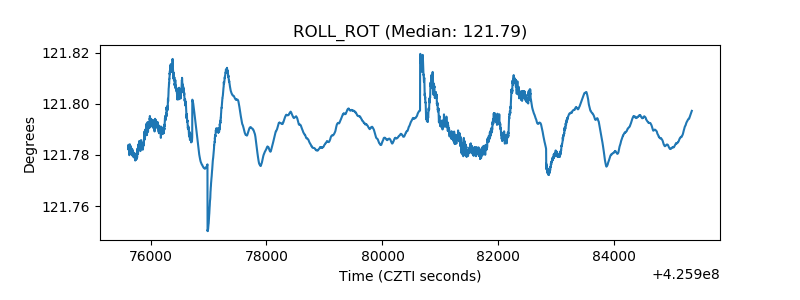 |
| _Roll_DEC | 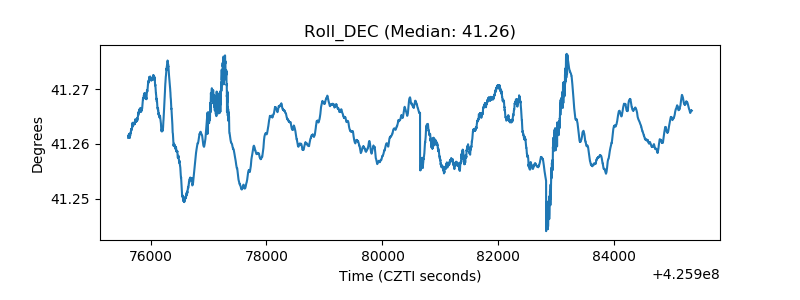 |
| _Roll_RA | 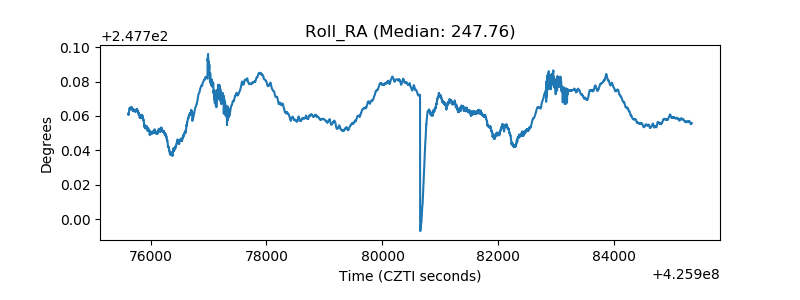 |
| Veto Counter | 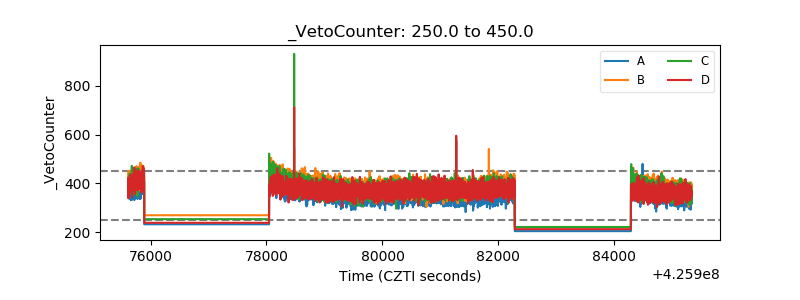 |