| Param | Original file | Final file |
|---|---|---|
| Filename | modeM0/AS1A12_101T01_9000005722_41956cztM0_level2.fits | modeM0/AS1A12_101T01_9000005722_41956cztM0_level2_quad_clean.evt |
| Size (bytes) | 305,205,120 | 91,298,880 |
| Size | 291.1 MB | 87.1 MB |
| Events in quadrant A | 2,923,244 | 614,019 |
| Events in quadrant B | 2,521,882 | 627,859 |
| Events in quadrant C | 2,545,347 | 592,934 |
| Events in quadrant D | 2,875,991 | 542,457 |
| Mode M0 | |||
|---|---|---|---|
| Quadrant | BADHDUFLAG | Total packets | Discarded packets |
| A | 0 | 11959 | 2 |
| B | 0 | 11347 | 2 |
| C | 0 | 11085 | 2 |
| D | 0 | 12595 | 2 |
| Mode M9 | |||
|---|---|---|---|
| Quadrant | BADHDUFLAG | Total packets | Discarded packets |
| A | 0 | 26 | 0 |
| B | 0 | 27 | 0 |
| C | 0 | 27 | 0 |
| D | 0 | 27 | 0 |
| Mode SS | |||
|---|---|---|---|
| Quadrant | BADHDUFLAG | Total packets | Discarded packets |
| A | 0 | 114 | 0 |
| B | 0 | 114 | 0 |
| C | 0 | 114 | 0 |
| D | 0 | 114 | 0 |
| Quadrant | Total seconds | Saturated seconds | Saturation percentage |
|---|---|---|---|
| A | 5531 | 14 | 0.253119% |
| B | 5531 | 11 | 0.198879% |
| C | 5531 | 4 | 0.072320% |
| D | 5531 | 79 | 1.428313% |
Noise dominated data is calculated using 1-second bins in cleaned event files. If a bin has >2000 counts, and if more than 50% of those come from <1% of pixels, then it is considered to be noise-dominated and hence unusable.
| Quadrant | # 1 sec bins | Bins with >0 counts | Bins with >2000 counts | High rate bins dominated by noise | Noise dominated (total time) | Noise dominated (detector-on time) | Marked lightcurve |
|---|---|---|---|---|---|---|---|
| A | 7234 | 5532 | 3 | 3 | 0.04% | 0.05% | 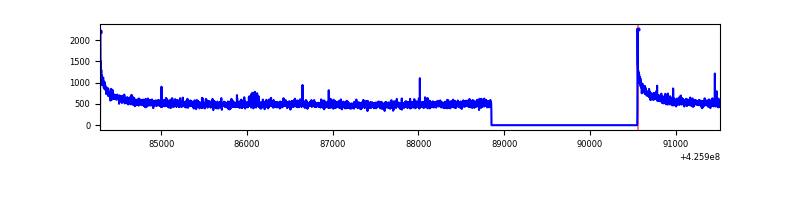 |
| B | 7234 | 5532 | 3 | 3 | 0.04% | 0.05% | 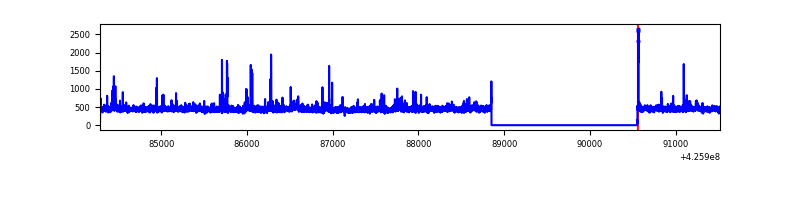 |
| C | 7234 | 5532 | 0 | 0 | 0.00% | 0.00% | 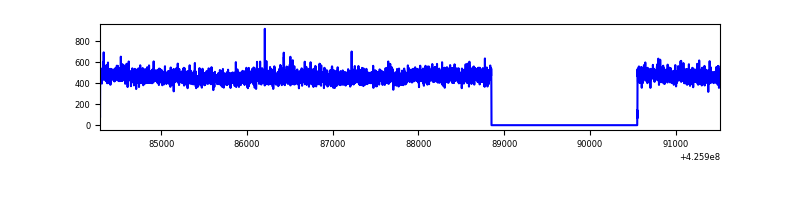 |
| D | 7234 | 5532 | 71 | 71 | 0.98% | 1.28% | 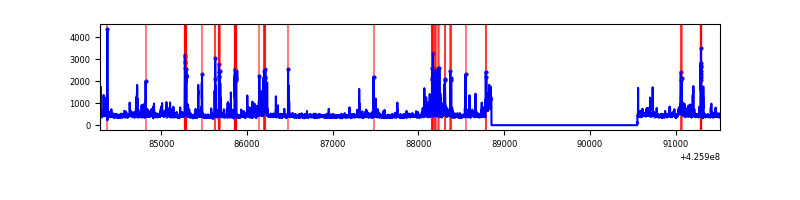 |
Top three noisy pixels from each quadrant. If the there are fewer than three noisy pixels in the level2.evt file, extra rows are filled as -1
| Pixel properties | Quadrant properties | ||||||
|---|---|---|---|---|---|---|---|
| Quadrant | DetID | PixID | Counts | Sigma | Mean | Median | Sigma |
| A | 10 | 83 | 544759 | 4338.64 | 607 | 594 | 125.4 |
| A | 2 | 79 | 24906 | 193.84 | 607 | 594 | 125.4 |
| A | 13 | 6 | 9976 | 74.8 | 607 | 594 | 125.4 |
| B | 0 | 229 | 63731 | 537.37 | 599 | 583 | 117.5 |
| B | 5 | 255 | 52283 | 439.95 | 599 | 583 | 117.5 |
| B | 0 | 190 | 45216 | 379.81 | 599 | 583 | 117.5 |
| C | 15 | 214 | 245841 | 1795.57 | 588 | 590 | 136.6 |
| C | 15 | 111 | 4159 | 26.13 | 588 | 590 | 136.6 |
| C | 13 | 61 | 3812 | 23.59 | 588 | 590 | 136.6 |
| D | 13 | 249 | 299667 | 2070.4 | 587 | 569 | 144.5 |
| D | 12 | 218 | 89941 | 618.65 | 587 | 569 | 144.5 |
| D | 2 | 249 | 59699 | 409.31 | 587 | 569 | 144.5 |
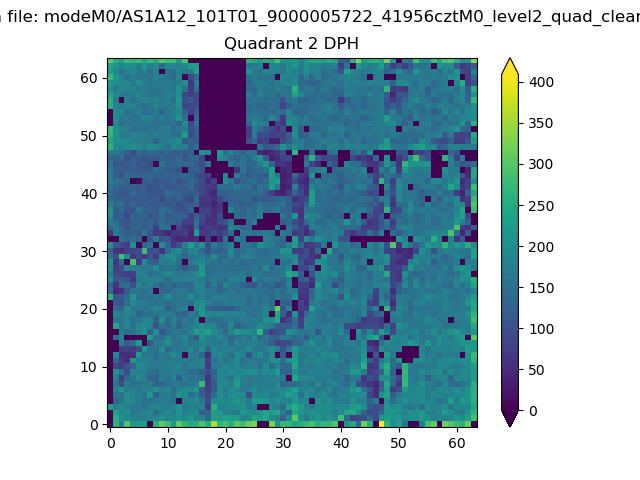
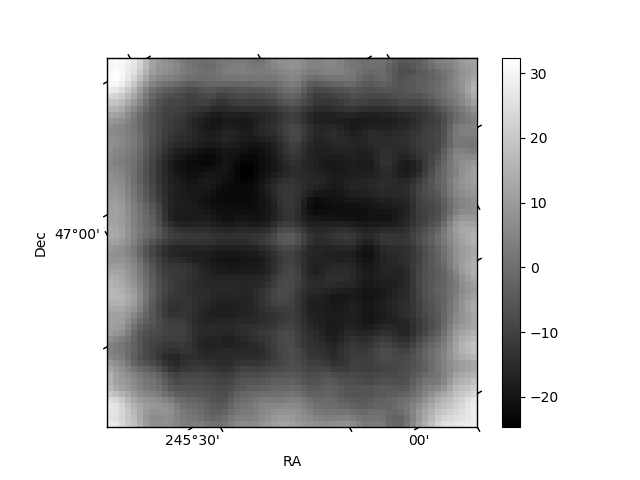
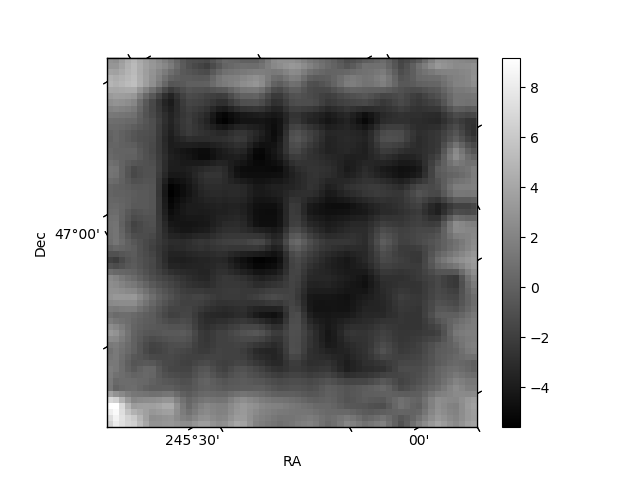
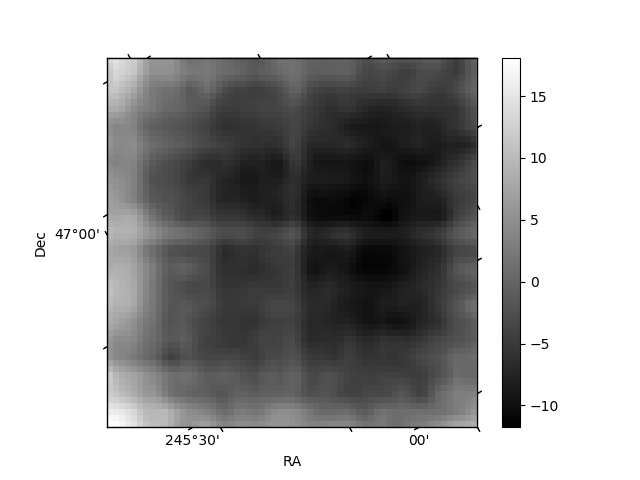
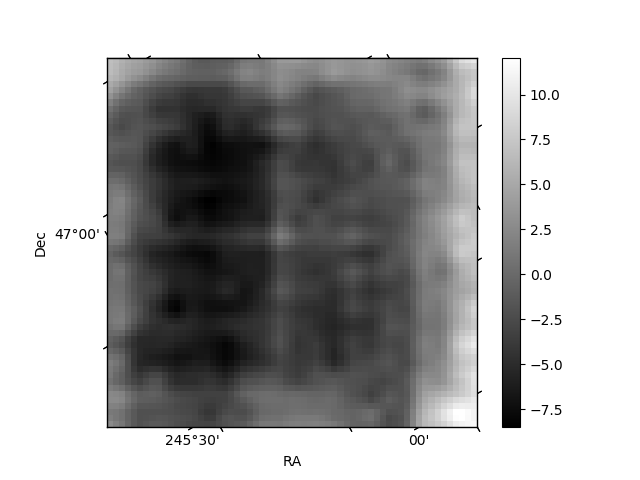
Histogram calculated using DETX and DETY for each event in the final _common_clean file
| Quadrant A | 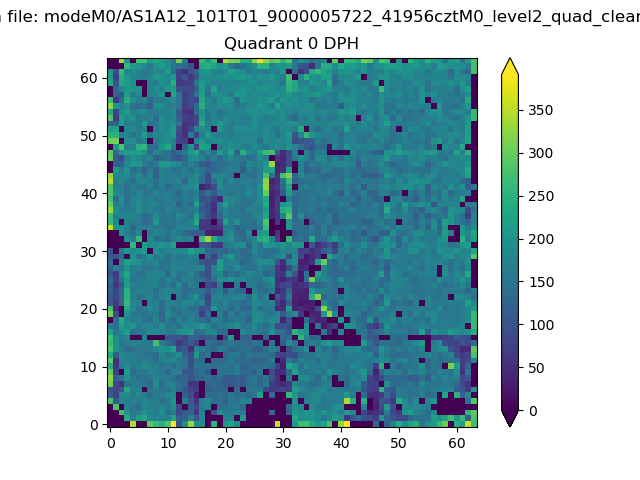 |
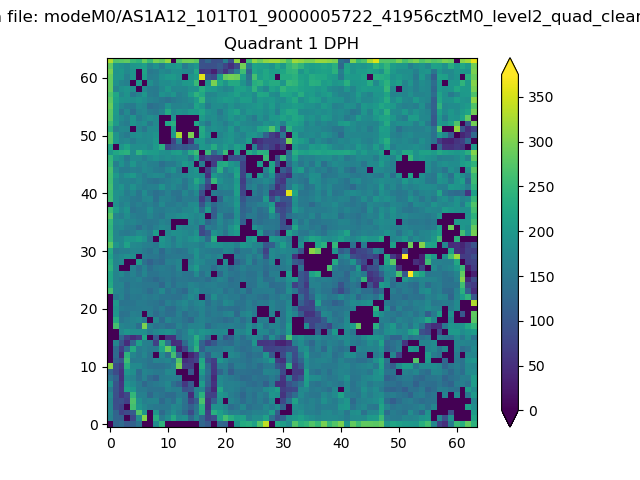 |
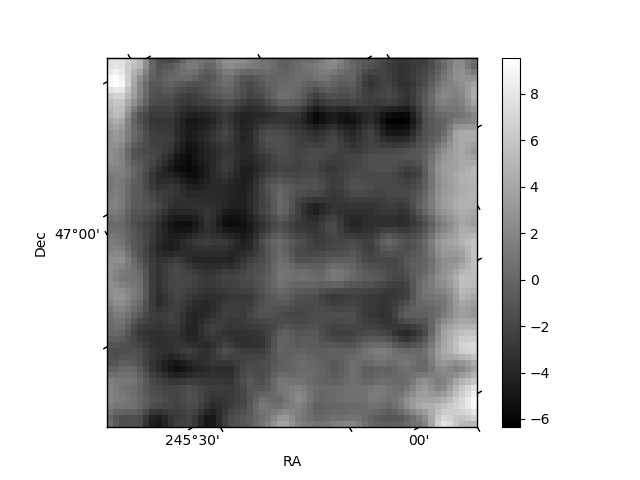
Quadrant B |
|---|---|---|---|
| Quadrant D | 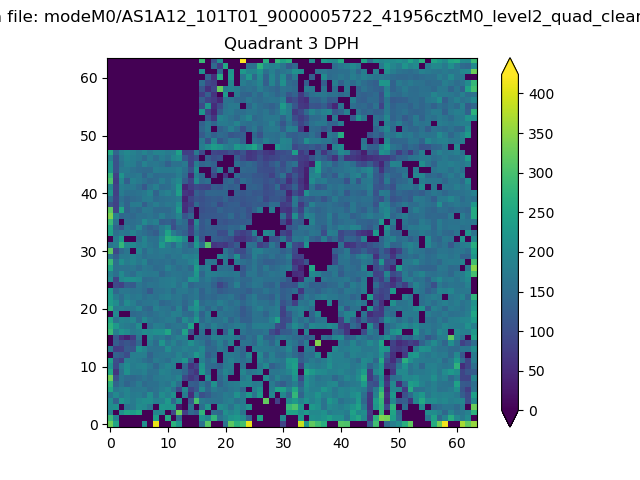 |
 |
Quadrant C |
| Plot type | Count rate plots | Images |
|---|---|---|
| Comparison with Poisson distribution Blue bars denote a histogram of data divided into 1 sec bins. Red curve is a Poisson curve with rate = median count rate of data. |
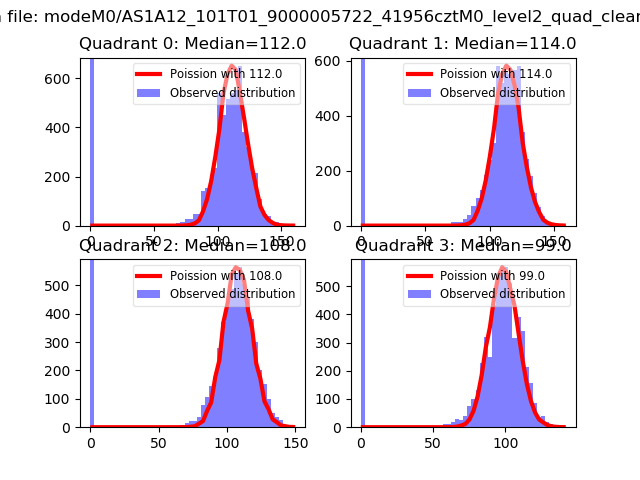 |
 |
| Quadrant-wise count rates Data is divided into 100 sec bins |
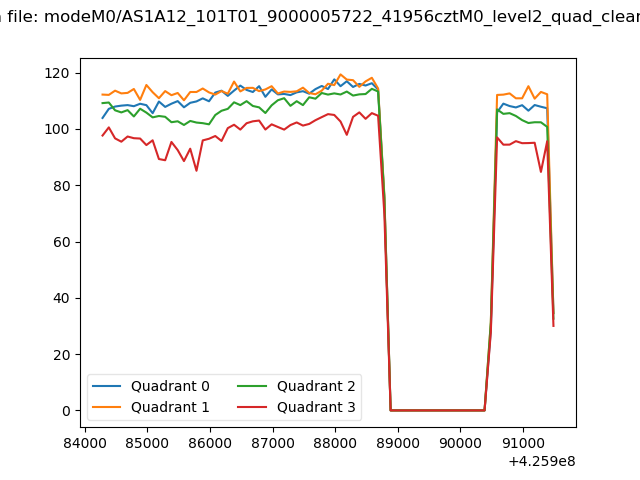 |
|
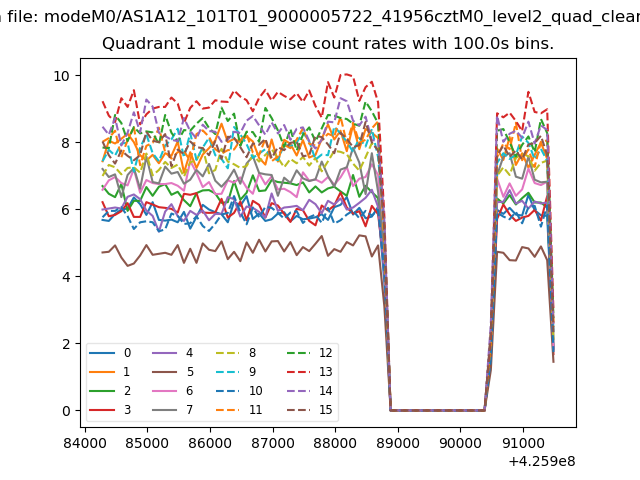
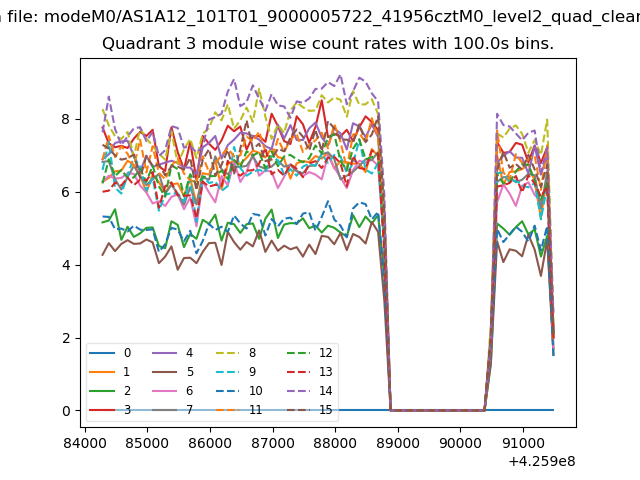
| Module-wise count rates for Quadrant A Data is divided into 100 sec bins |
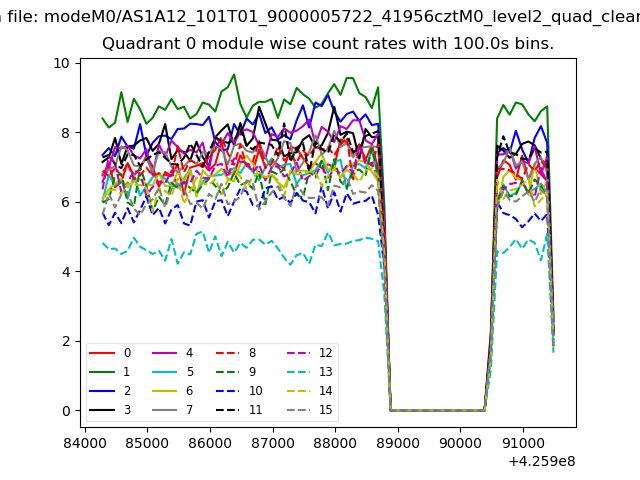 |
 |
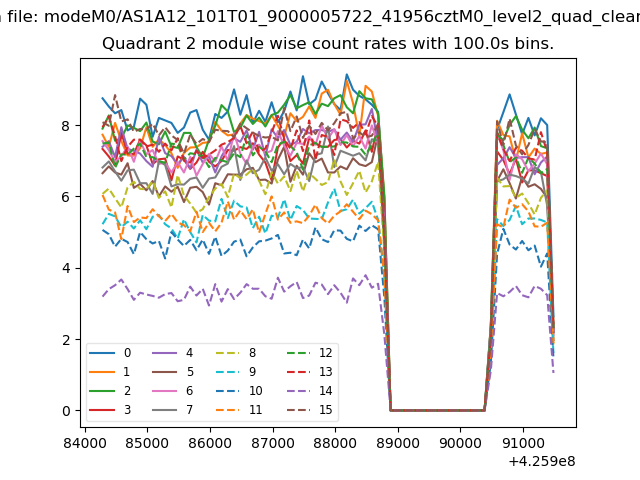
| Module-wise count rates for Quadrant B Data is divided into 100 sec bins |
 |
 |
| Module-wise count rates for Quadrant C Data is divided into 100 sec bins |
 |
 |
| Module-wise count rates for Quadrant D Data is divided into 100 sec bins |
 |
 |
| Parameter | Plot |
|---|---|
| CZT HV Monitor | 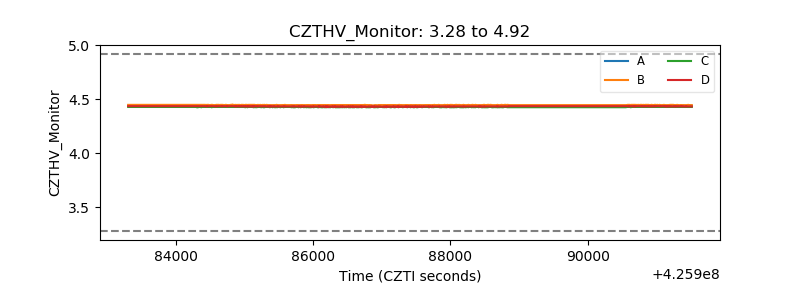 |
| D_VDD | 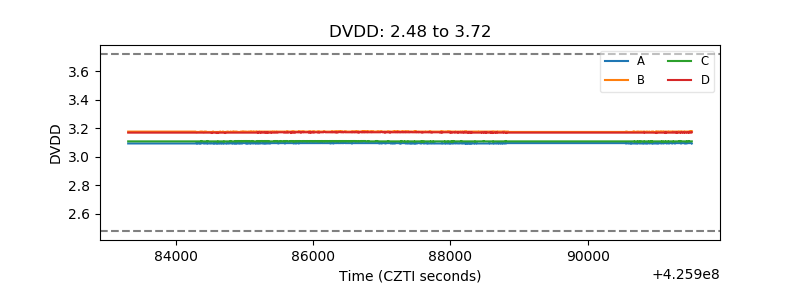 |
| Temperature 1 |  |
| Veto HV Monitor | 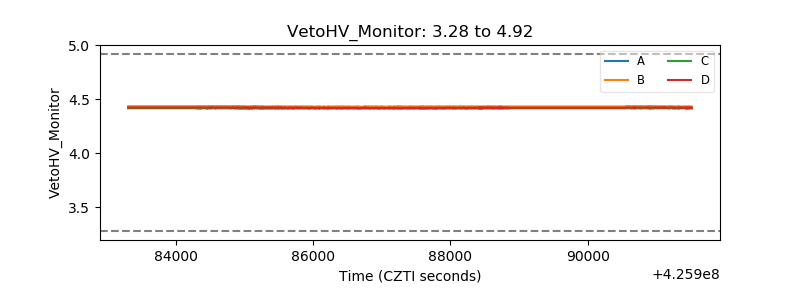 |
| Veto LLD | 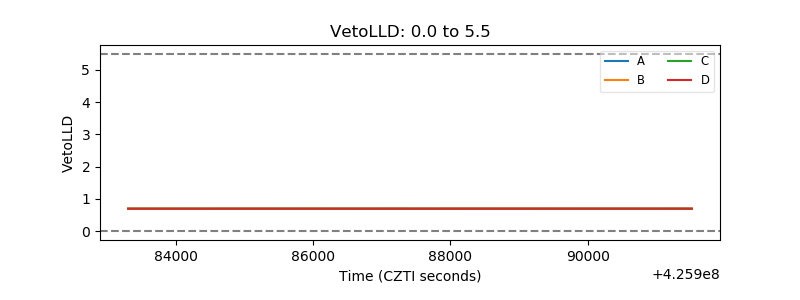 |
| Alpha Counter | 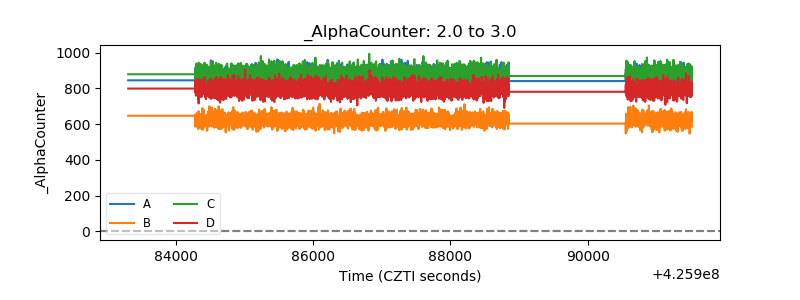 |
| _CPM_Rate | 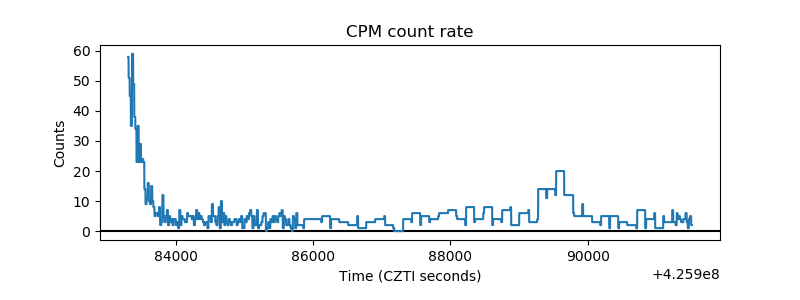 |
| CZT Counter | 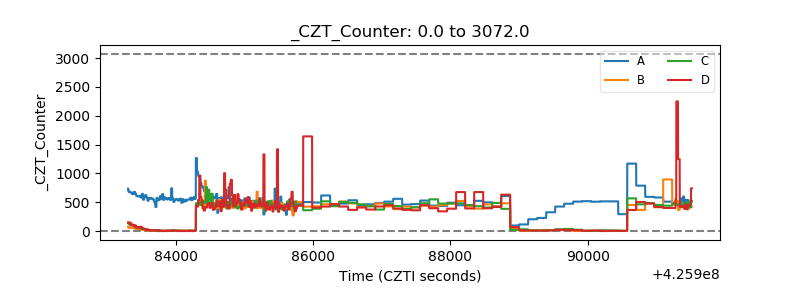 |
| +2.5 Volts monitor | 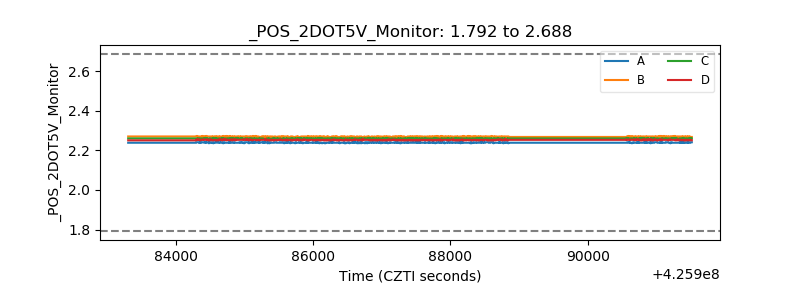 |
| +5 Volts monitor | 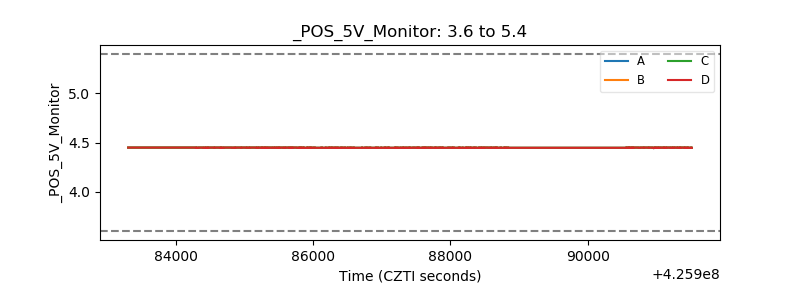 |
| _ROLL_ROT |  |
| _Roll_DEC | 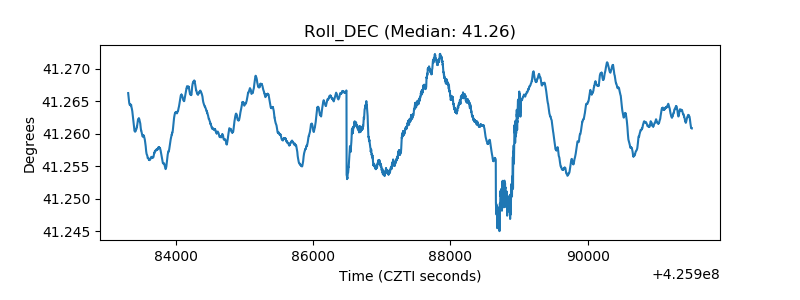 |
| _Roll_RA | 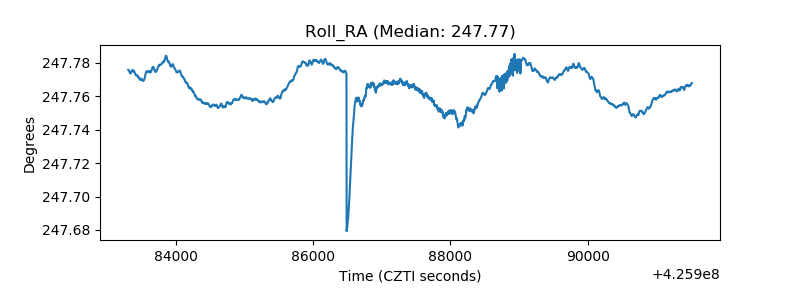 |
| Veto Counter | 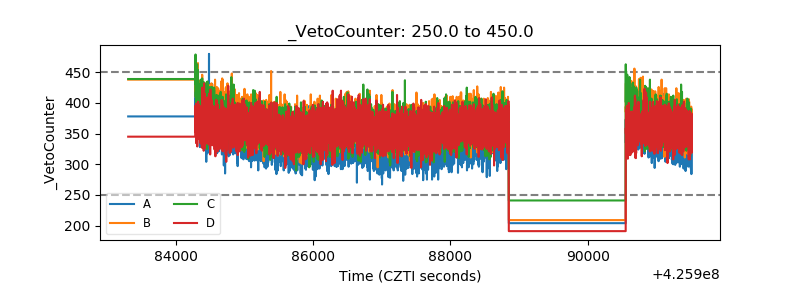 |