| Param | Original file | Final file |
|---|---|---|
| Filename | modeM0/AS1A12_101T01_9000005722_41957cztM0_level2.fits | modeM0/AS1A12_101T01_9000005722_41957cztM0_level2_quad_clean.evt |
| Size (bytes) | 195,071,040 | 58,636,800 |
| Size | 186.0 MB | 55.9 MB |
| Events in quadrant A | 1,841,326 | 394,089 |
| Events in quadrant B | 1,722,171 | 397,384 |
| Events in quadrant C | 1,623,390 | 378,724 |
| Events in quadrant D | 1,752,185 | 350,800 |
| Mode M0 | |||
|---|---|---|---|
| Quadrant | BADHDUFLAG | Total packets | Discarded packets |
| A | 0 | 7634 | 1 |
| B | 0 | 7685 | 1 |
| C | 0 | 7203 | 1 |
| D | 0 | 7888 | 1 |
| Mode M9 | |||
|---|---|---|---|
| Quadrant | BADHDUFLAG | Total packets | Discarded packets |
| A | 0 | 17 | 0 |
| B | 0 | 17 | 0 |
| C | 0 | 17 | 0 |
| D | 0 | 17 | 0 |
| Mode SS | |||
|---|---|---|---|
| Quadrant | BADHDUFLAG | Total packets | Discarded packets |
| A | 0 | 74 | 0 |
| B | 0 | 74 | 0 |
| C | 0 | 74 | 0 |
| D | 0 | 74 | 0 |
| Quadrant | Total seconds | Saturated seconds | Saturation percentage |
|---|---|---|---|
| A | 3595 | 7 | 0.194715% |
| B | 3595 | 40 | 1.112656% |
| C | 3595 | 1 | 0.027816% |
| D | 3596 | 18 | 0.500556% |
Noise dominated data is calculated using 1-second bins in cleaned event files. If a bin has >2000 counts, and if more than 50% of those come from <1% of pixels, then it is considered to be noise-dominated and hence unusable.
| Quadrant | # 1 sec bins | Bins with >0 counts | Bins with >2000 counts | High rate bins dominated by noise | Noise dominated (total time) | Noise dominated (detector-on time) | Marked lightcurve |
|---|---|---|---|---|---|---|---|
| A | 5298 | 3596 | 1 | 1 | 0.02% | 0.03% | 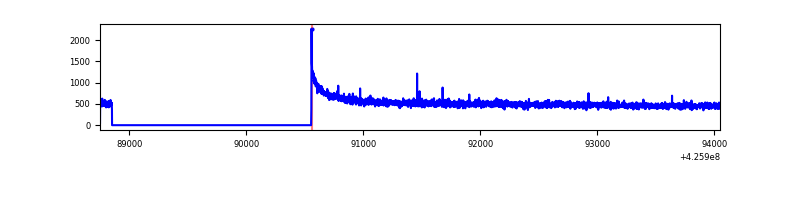 |
| B | 5298 | 3596 | 35 | 35 | 0.66% | 0.97% | 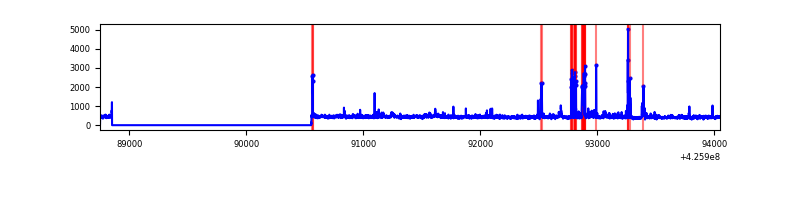 |
| C | 5298 | 3596 | 0 | 0 | 0.00% | 0.00% | 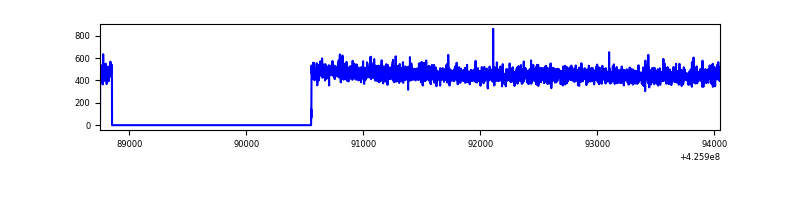 |
| D | 5299 | 3597 | 16 | 16 | 0.30% | 0.44% | 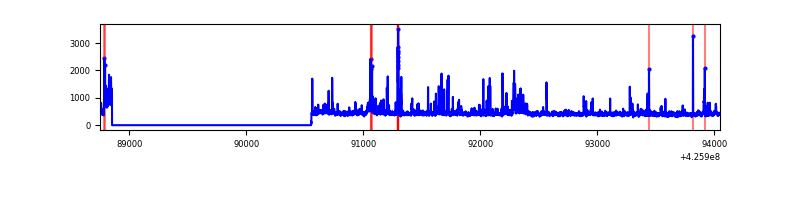 |
Top three noisy pixels from each quadrant. If the there are fewer than three noisy pixels in the level2.evt file, extra rows are filled as -1
| Pixel properties | Quadrant properties | ||||||
|---|---|---|---|---|---|---|---|
| Quadrant | DetID | PixID | Counts | Sigma | Mean | Median | Sigma |
| A | 10 | 83 | 334473 | 4193.01 | 385 | 377 | 79.7 |
| A | 2 | 79 | 10692 | 129.46 | 385 | 377 | 79.7 |
| A | 13 | 6 | 8045 | 96.24 | 385 | 377 | 79.7 |
| B | 5 | 255 | 166725 | 2240.53 | 378 | 369 | 74.2 |
| B | 0 | 190 | 38159 | 508.97 | 378 | 369 | 74.2 |
| B | 3 | 112 | 13159 | 172.26 | 378 | 369 | 74.2 |
| C | 15 | 214 | 156799 | 1762.74 | 376 | 378 | 88.7 |
| C | 13 | 61 | 2468 | 23.55 | 376 | 378 | 88.7 |
| C | 14 | 67 | 1385 | 11.35 | 376 | 378 | 88.7 |
| D | 13 | 249 | 107835 | 1159.43 | 378 | 366 | 92.7 |
| D | 12 | 218 | 53214 | 570.15 | 378 | 366 | 92.7 |
| D | 2 | 120 | 50539 | 541.29 | 378 | 366 | 92.7 |
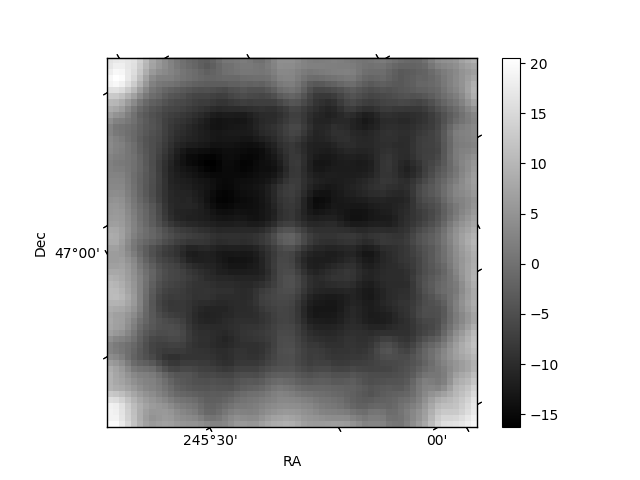
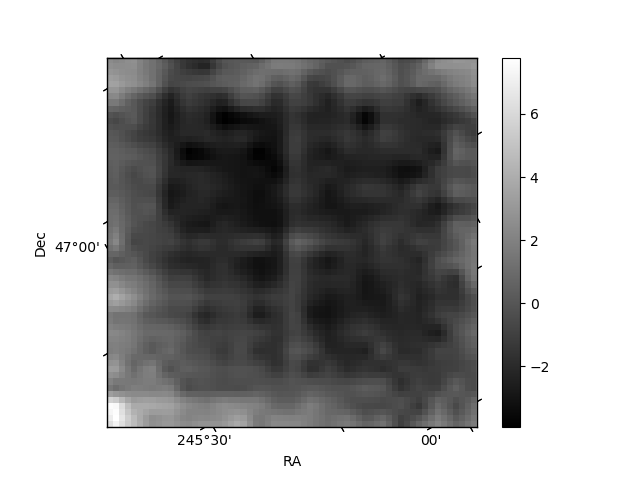
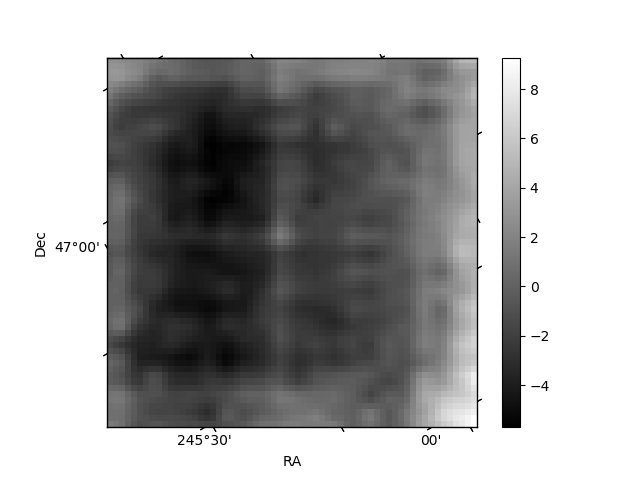
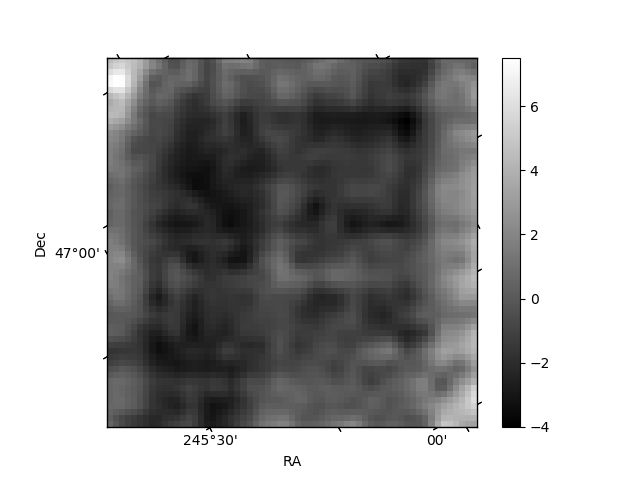
Histogram calculated using DETX and DETY for each event in the final _common_clean file
| Quadrant A | 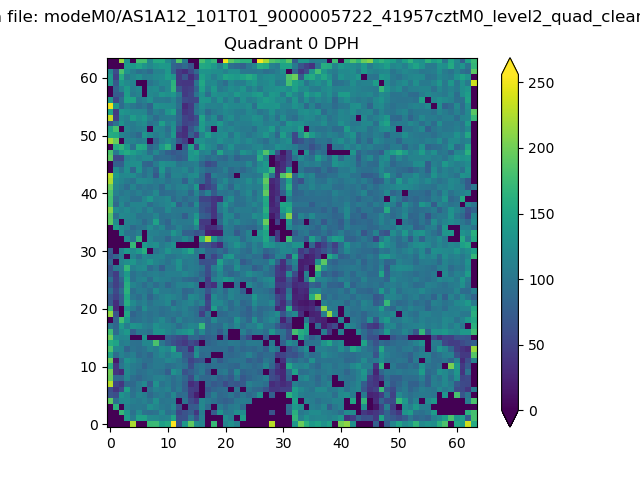 |
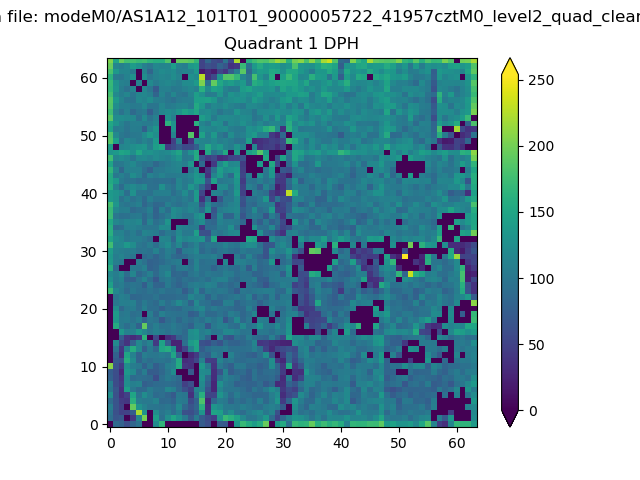 |
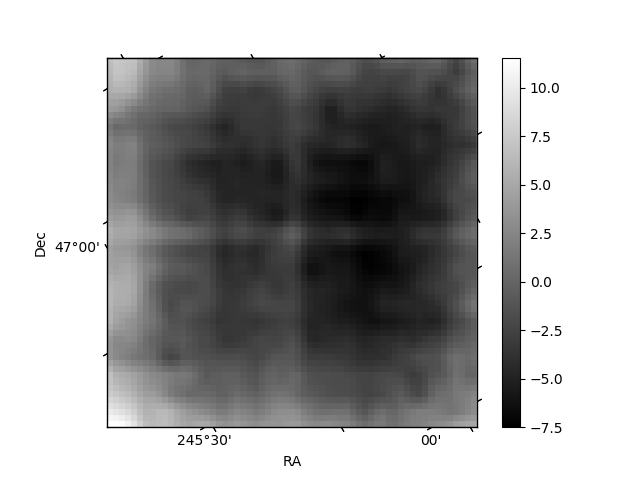
Quadrant B |
|---|---|---|---|
| Quadrant D | 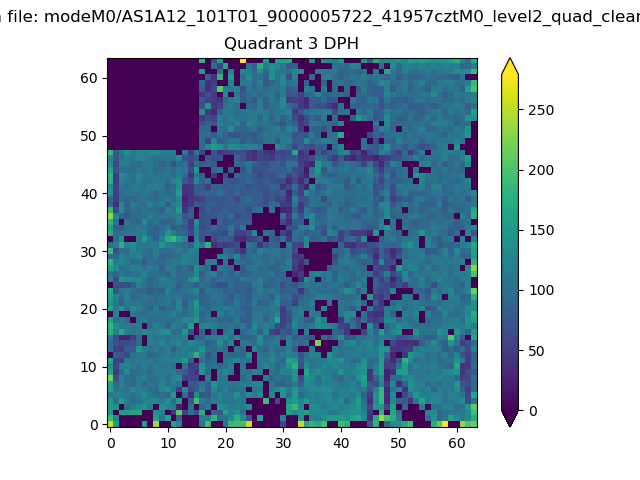 |
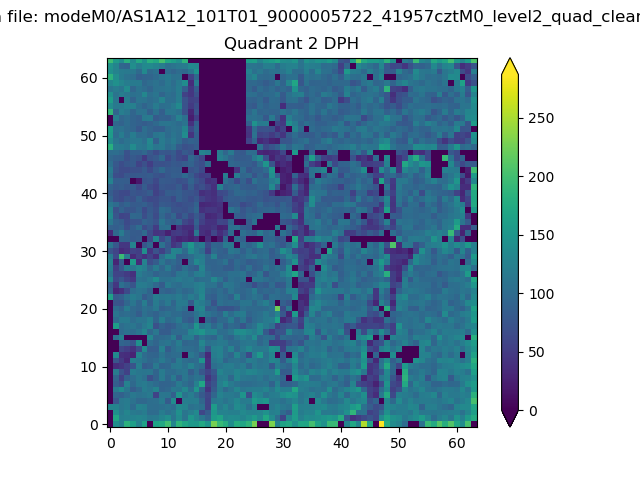 |
Quadrant C |
| Plot type | Count rate plots | Images |
|---|---|---|
| Comparison with Poisson distribution Blue bars denote a histogram of data divided into 1 sec bins. Red curve is a Poisson curve with rate = median count rate of data. |
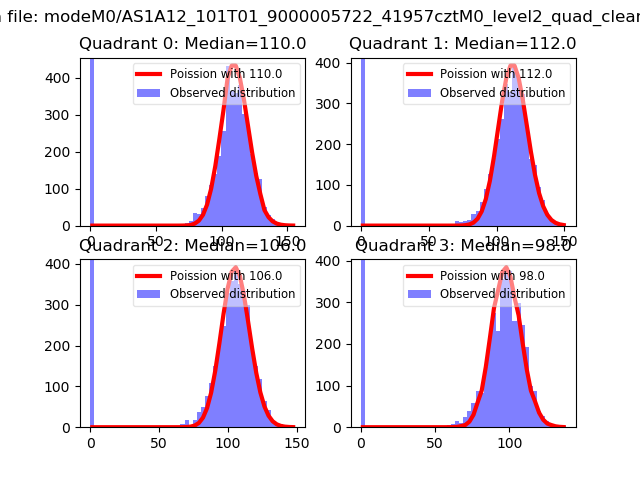 |
 |
| Quadrant-wise count rates Data is divided into 100 sec bins |
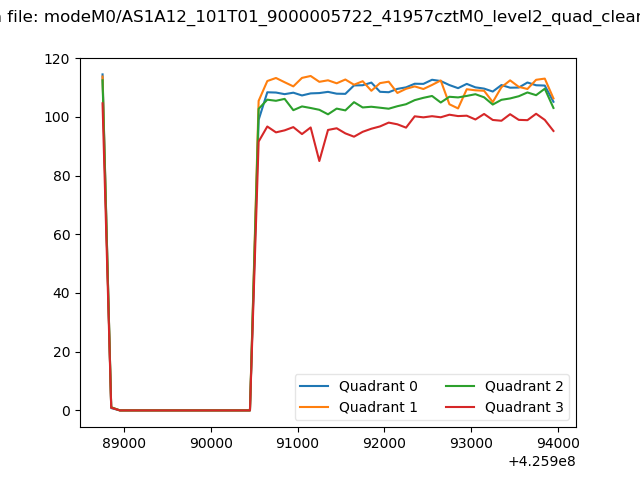 |
|
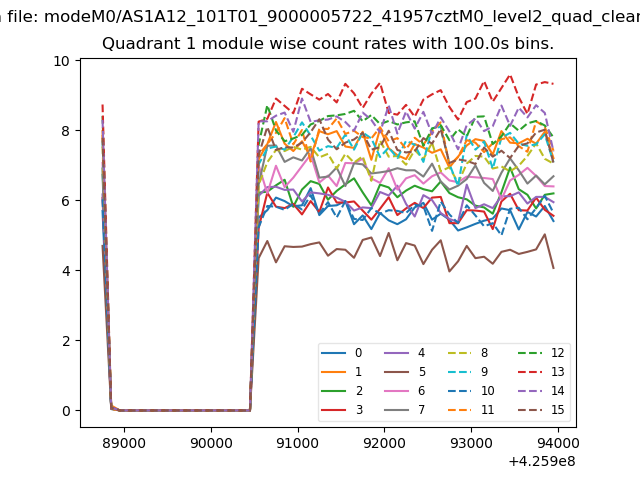
| Module-wise count rates for Quadrant A Data is divided into 100 sec bins |
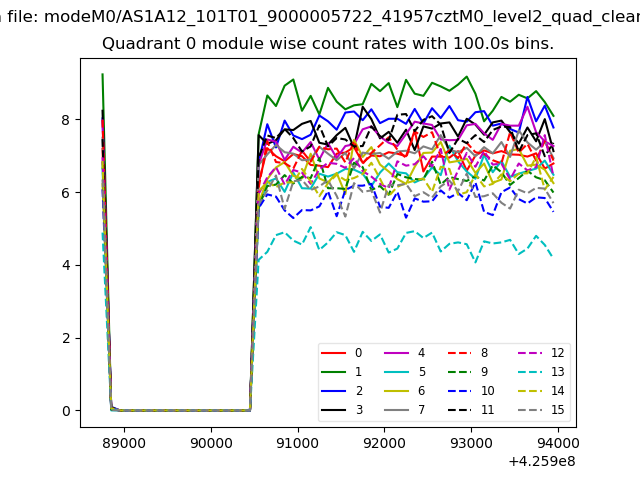 |
 |
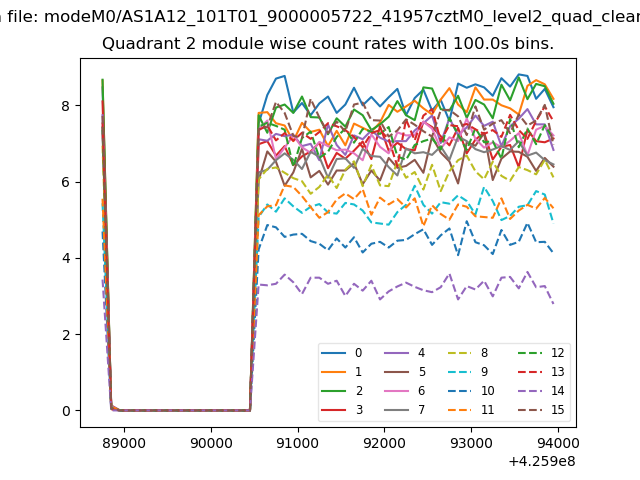
| Module-wise count rates for Quadrant B Data is divided into 100 sec bins |
 |
 |
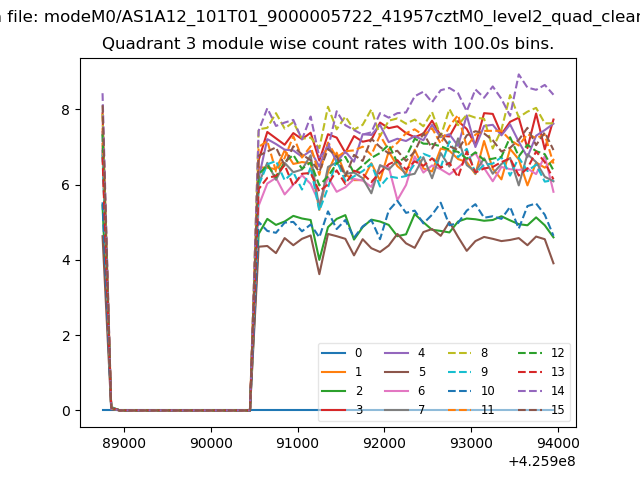
| Module-wise count rates for Quadrant C Data is divided into 100 sec bins |
 |
 |
| Module-wise count rates for Quadrant D Data is divided into 100 sec bins |
 |
 |
| Parameter | Plot |
|---|---|
| CZT HV Monitor | 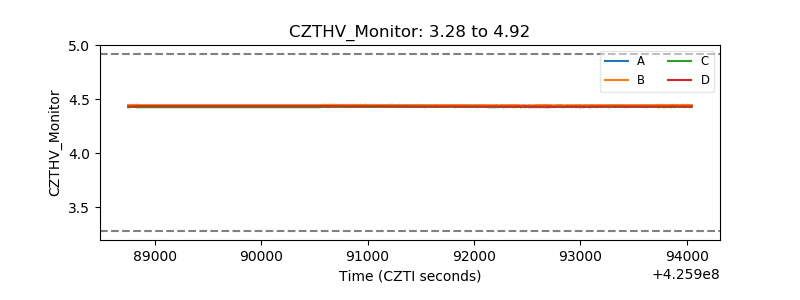 |
| D_VDD |  |
| Temperature 1 | 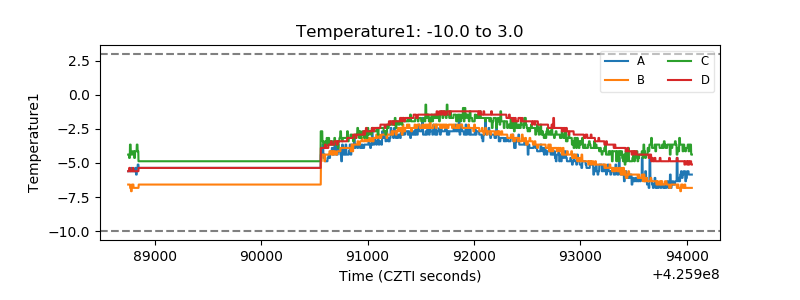 |
| Veto HV Monitor | 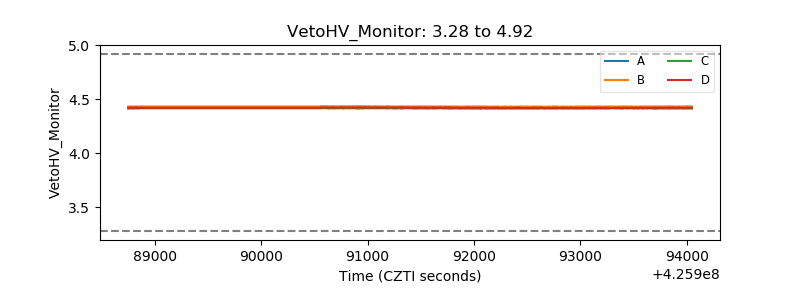 |
| Veto LLD | 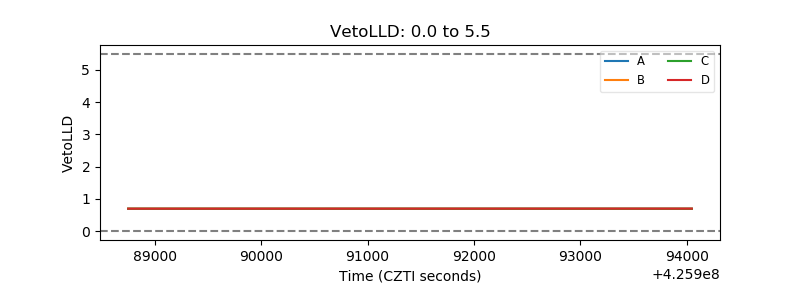 |
| Alpha Counter | 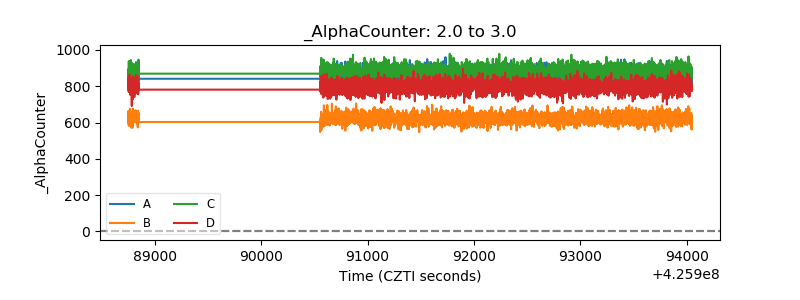 |
| _CPM_Rate | 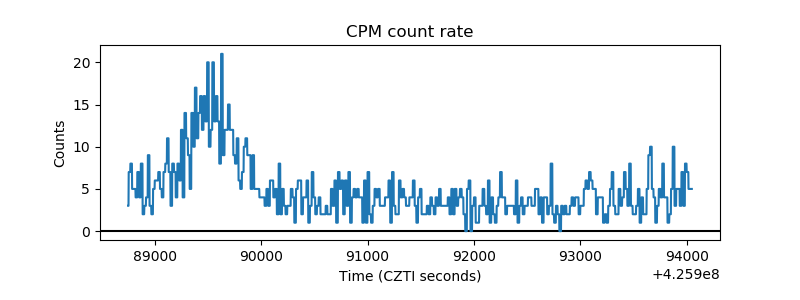 |
| CZT Counter | 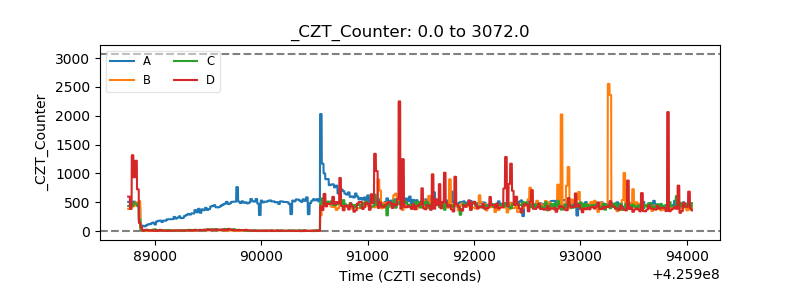 |
| +2.5 Volts monitor | 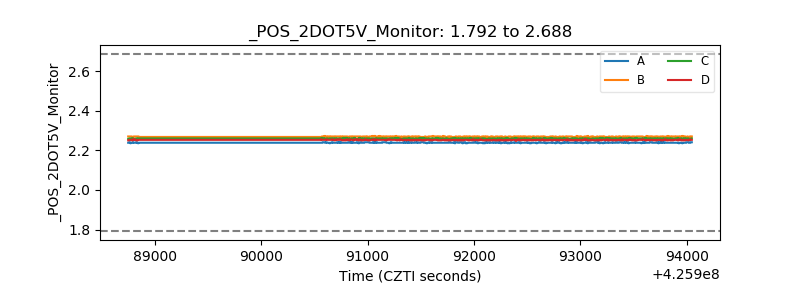 |
| +5 Volts monitor |  |
| _ROLL_ROT | 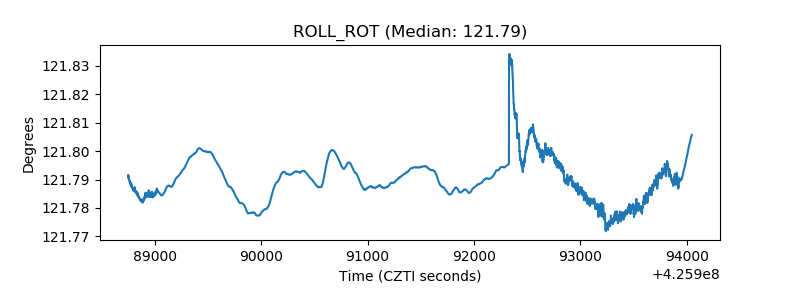 |
| _Roll_DEC | 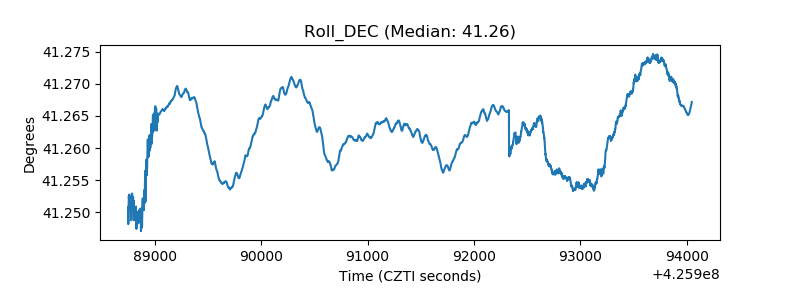 |
| _Roll_RA | 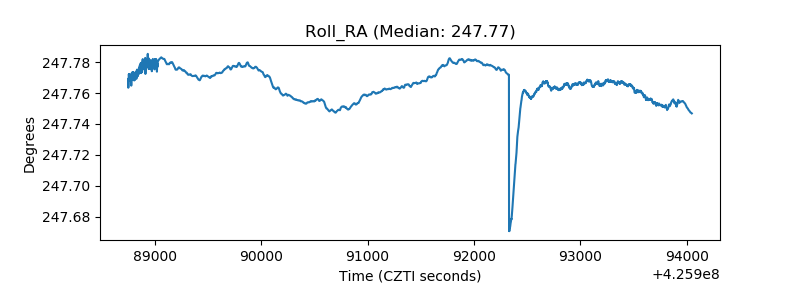 |
| Veto Counter | 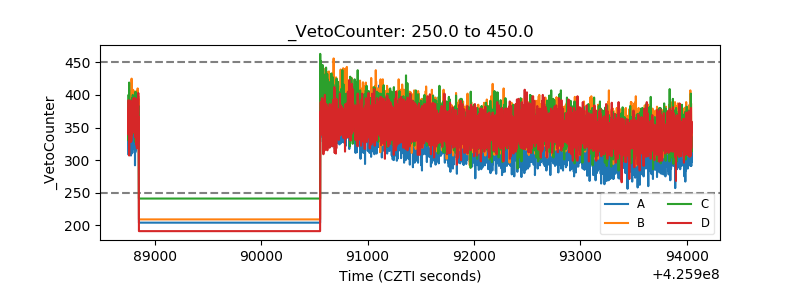 |