| Param | Original file | Final file |
|---|---|---|
| Filename | modeM0/AS1A12_025T15_9000005726_41961cztM0_level2.fits | modeM0/AS1A12_025T15_9000005726_41961cztM0_level2_quad_clean.evt |
| Size (bytes) | 270,164,160 | 69,793,920 |
| Size | 257.6 MB | 66.6 MB |
| Events in quadrant A | 2,600,287 | 466,699 |
| Events in quadrant B | 2,067,089 | 478,997 |
| Events in quadrant C | 2,009,890 | 456,541 |
| Events in quadrant D | 2,984,281 | 405,483 |
| Mode SS | |||
|---|---|---|---|
| Quadrant | BADHDUFLAG | Total packets | Discarded packets |
| A | 0 | 88 | 0 |
| B | 0 | 88 | 0 |
| C | 0 | 88 | 0 |
| D | 0 | 88 | 0 |
| Mode M9 | |||
|---|---|---|---|
| Quadrant | BADHDUFLAG | Total packets | Discarded packets |
| A | 0 | 15 | 0 |
| B | 0 | 15 | 0 |
| C | 0 | 15 | 0 |
| D | 0 | 15 | 0 |
| Mode M0 | |||
|---|---|---|---|
| Quadrant | BADHDUFLAG | Total packets | Discarded packets |
| A | 0 | 10562 | 1 |
| B | 0 | 9185 | 1 |
| C | 0 | 8748 | 1 |
| D | 0 | 12033 | 1 |
| Quadrant | Total seconds | Saturated seconds | Saturation percentage |
|---|---|---|---|
| A | 4344 | 13 | 0.299263% |
| B | 4344 | 16 | 0.368324% |
| C | 4344 | 1 | 0.023020% |
| D | 4344 | 223 | 5.133517% |
Noise dominated data is calculated using 1-second bins in cleaned event files. If a bin has >2000 counts, and if more than 50% of those come from <1% of pixels, then it is considered to be noise-dominated and hence unusable.
| Quadrant | # 1 sec bins | Bins with >0 counts | Bins with >2000 counts | High rate bins dominated by noise | Noise dominated (total time) | Noise dominated (detector-on time) | Marked lightcurve |
|---|---|---|---|---|---|---|---|
| A | 5837 | 4345 | 3 | 3 | 0.05% | 0.07% | 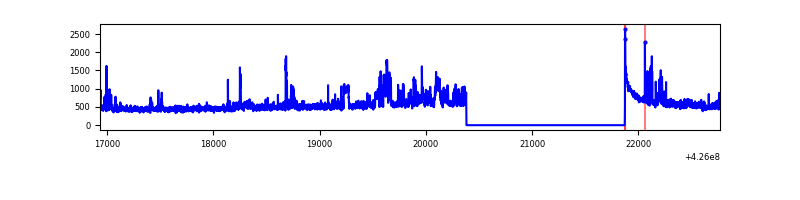 |
| B | 5837 | 4345 | 13 | 13 | 0.22% | 0.30% | 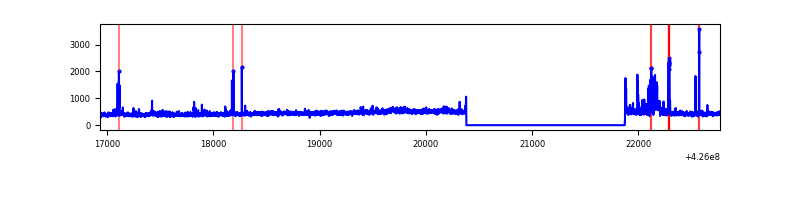 |
| C | 5837 | 4345 | 0 | 0 | 0.00% | 0.00% | 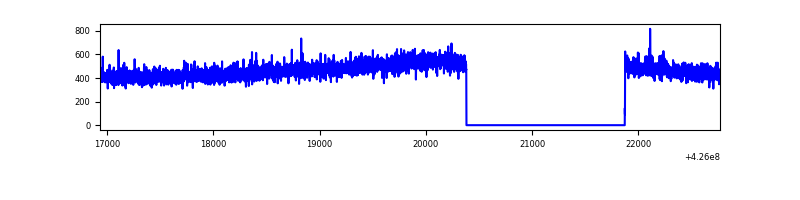 |
| D | 5837 | 4345 | 164 | 164 | 2.81% | 3.77% | 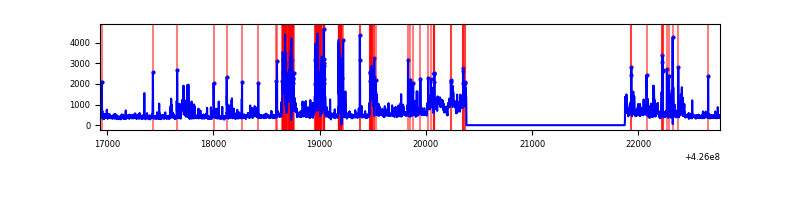 |
Top three noisy pixels from each quadrant. If the there are fewer than three noisy pixels in the level2.evt file, extra rows are filled as -1
| Pixel properties | Quadrant properties | ||||||
|---|---|---|---|---|---|---|---|
| Quadrant | DetID | PixID | Counts | Sigma | Mean | Median | Sigma |
| A | 10 | 83 | 385002 | 3878.24 | 478 | 468 | 99.2 |
| A | 2 | 79 | 348817 | 3513.29 | 478 | 468 | 99.2 |
| A | 13 | 6 | 14315 | 139.65 | 478 | 468 | 99.2 |
| B | 5 | 255 | 115767 | 1218.52 | 475 | 461 | 94.6 |
| B | 0 | 190 | 51439 | 538.72 | 475 | 461 | 94.6 |
| B | 0 | 156 | 14109 | 144.23 | 475 | 461 | 94.6 |
| C | 15 | 214 | 186212 | 1670.86 | 466 | 468 | 111.2 |
| C | 13 | 61 | 3061 | 23.33 | 466 | 468 | 111.2 |
| C | 8 | 79 | 2947 | 22.3 | 466 | 468 | 111.2 |
| D | 13 | 249 | 666334 | 5910.95 | 451 | 436 | 112.7 |
| D | 5 | 222 | 362915 | 3217.6 | 451 | 436 | 112.7 |
| D | 12 | 6 | 64427 | 568.03 | 451 | 436 | 112.7 |
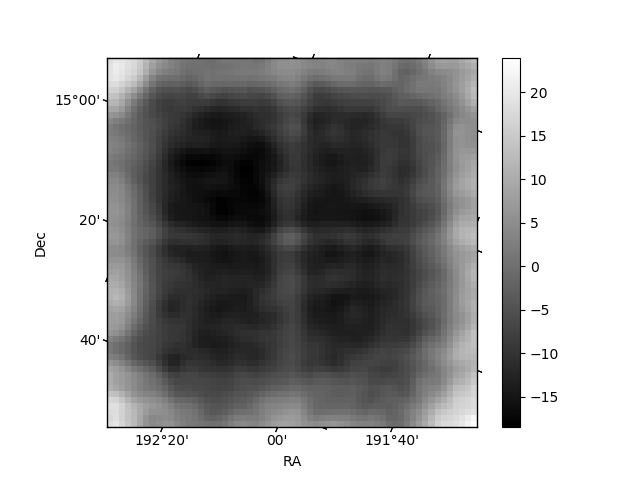
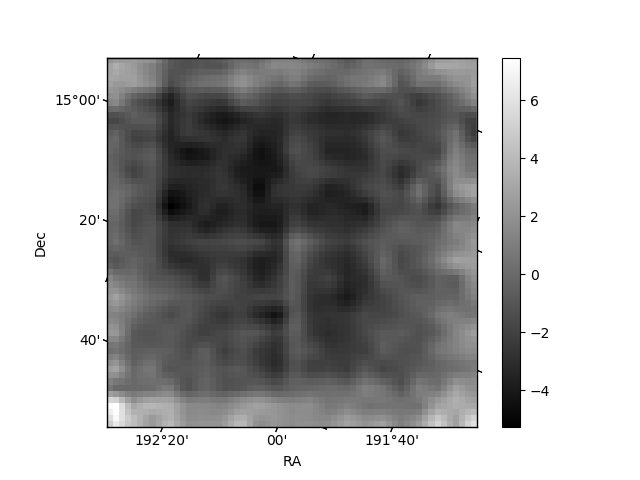
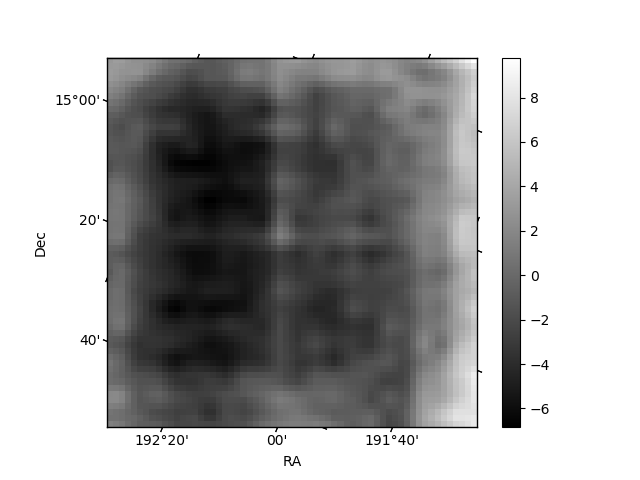
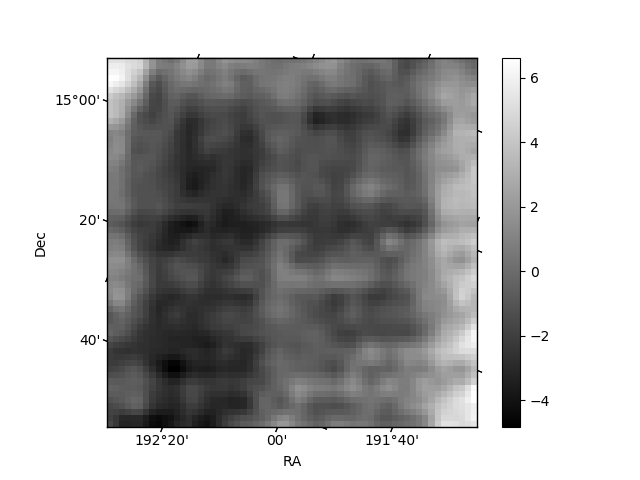
Histogram calculated using DETX and DETY for each event in the final _common_clean file
| Quadrant A | 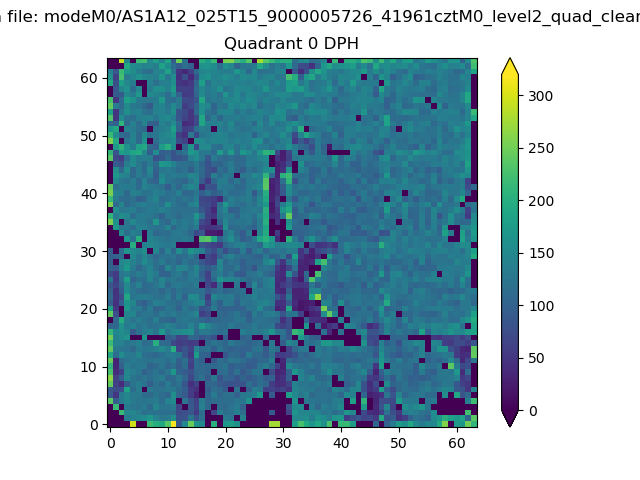 |
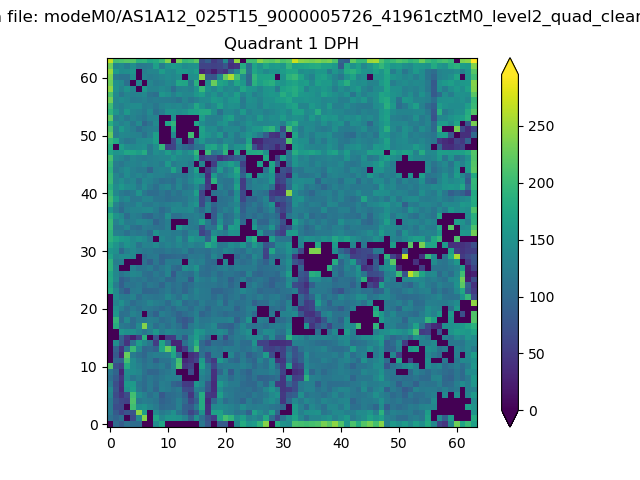 |
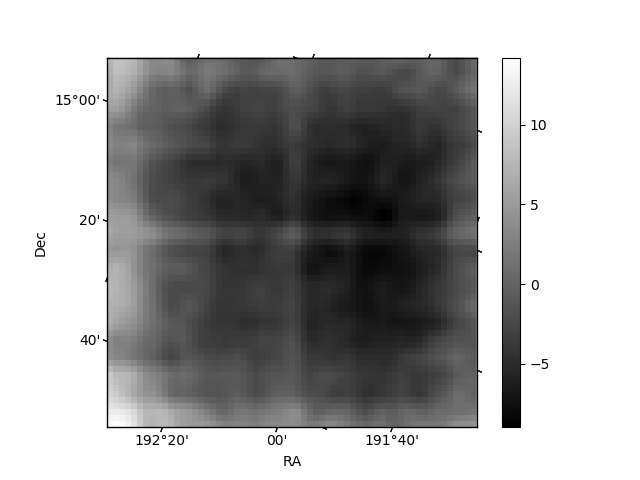
Quadrant B |
|---|---|---|---|
| Quadrant D | 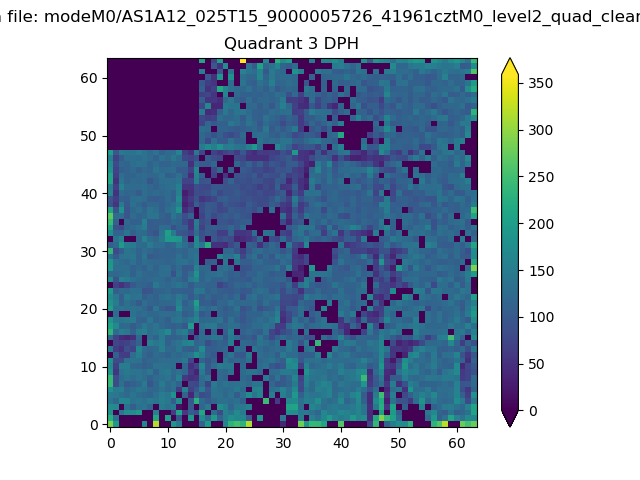 |
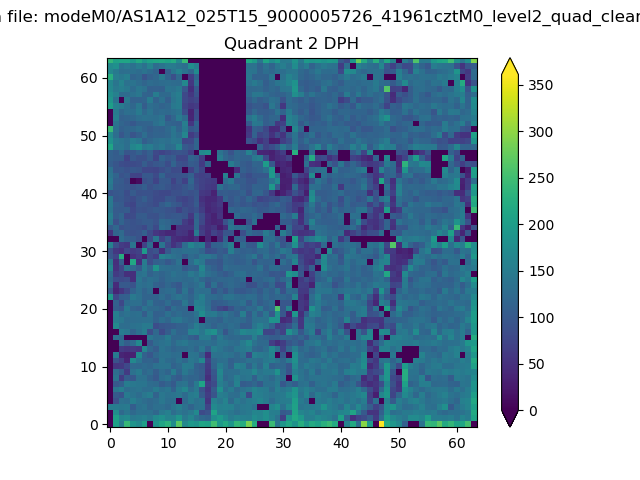 |
Quadrant C |
| Plot type | Count rate plots | Images |
|---|---|---|
| Comparison with Poisson distribution Blue bars denote a histogram of data divided into 1 sec bins. Red curve is a Poisson curve with rate = median count rate of data. |
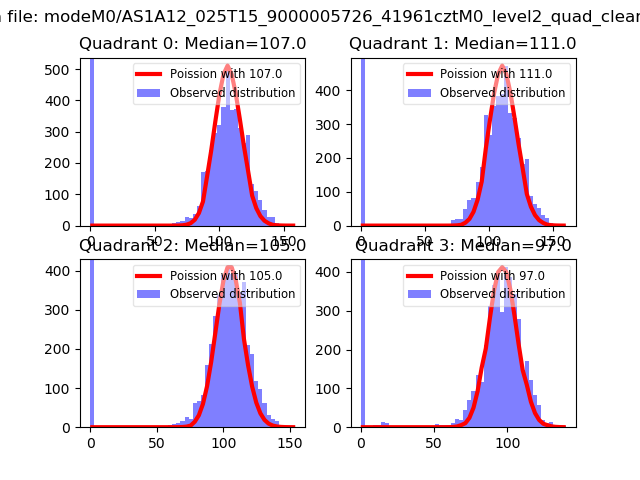 |
 |
| Quadrant-wise count rates Data is divided into 100 sec bins |
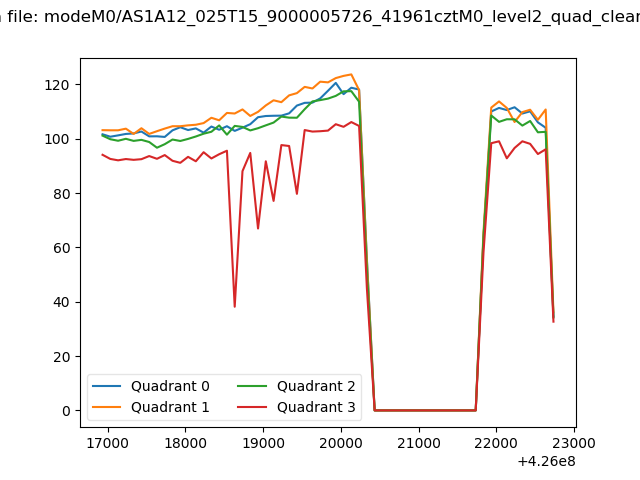 |
|
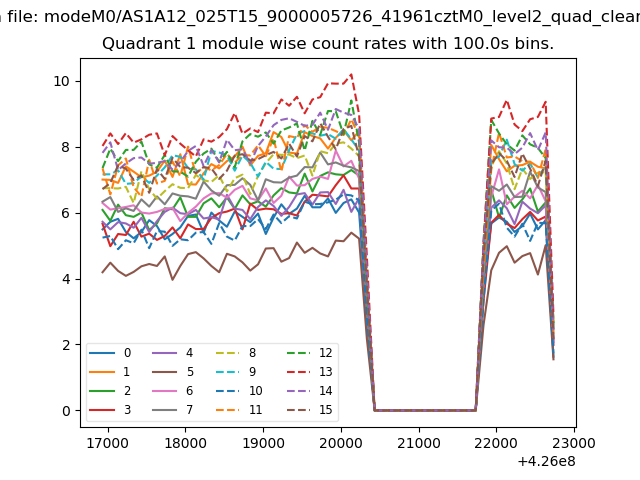
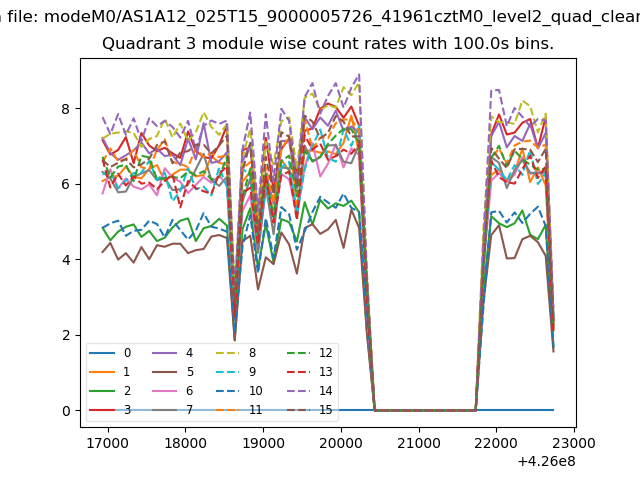
| Module-wise count rates for Quadrant A Data is divided into 100 sec bins |
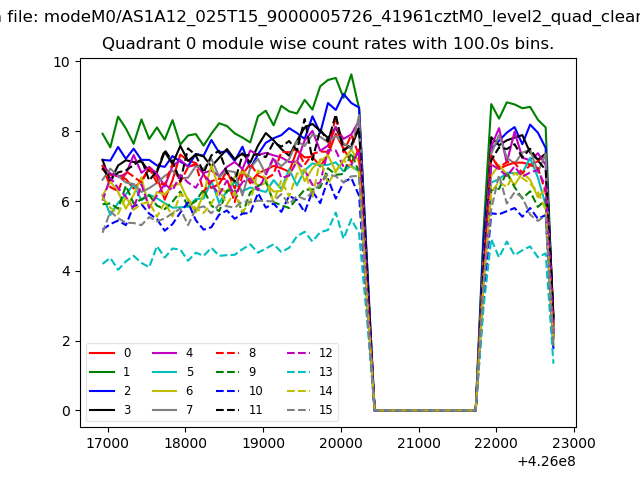 |
 |
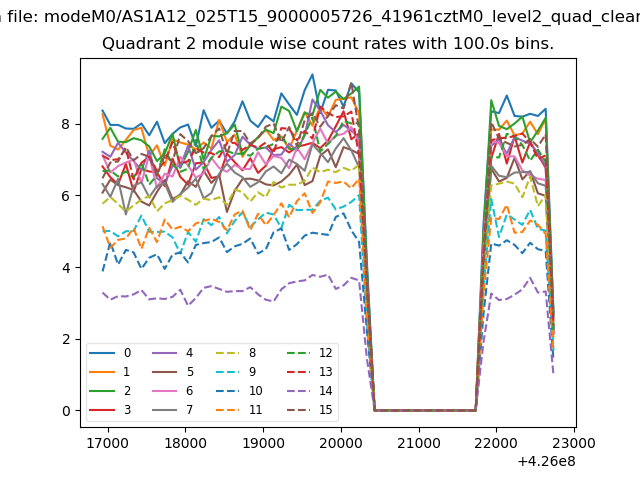
| Module-wise count rates for Quadrant B Data is divided into 100 sec bins |
 |
 |
| Module-wise count rates for Quadrant C Data is divided into 100 sec bins |
 |
 |
| Module-wise count rates for Quadrant D Data is divided into 100 sec bins |
 |
 |
| Parameter | Plot |
|---|---|
| CZT HV Monitor | 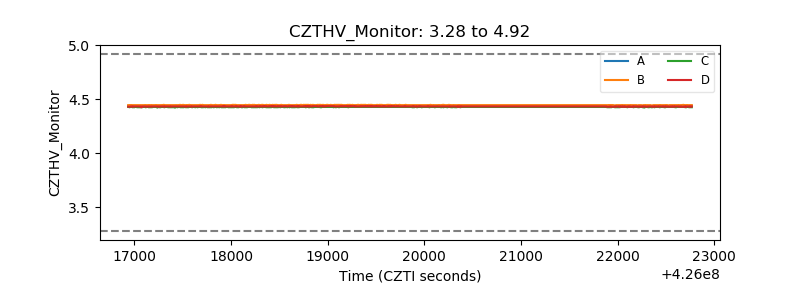 |
| D_VDD | 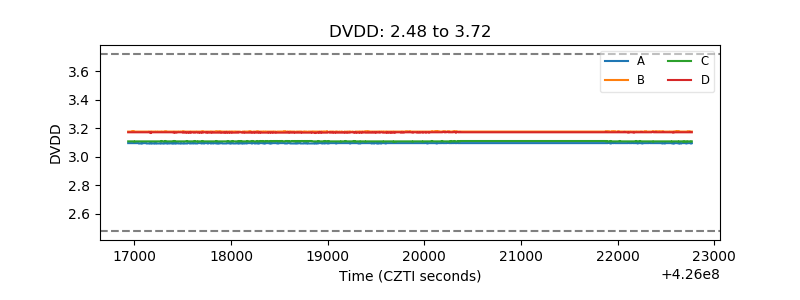 |
| Temperature 1 | 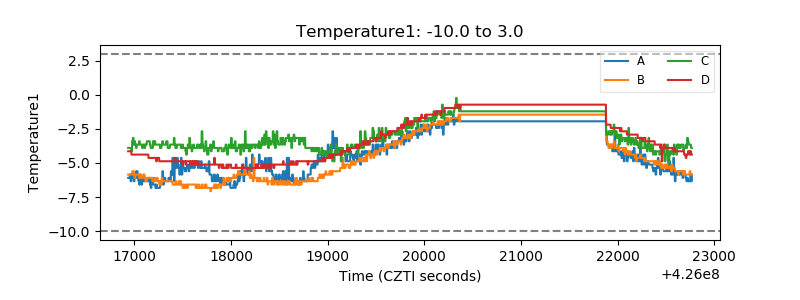 |
| Veto HV Monitor | 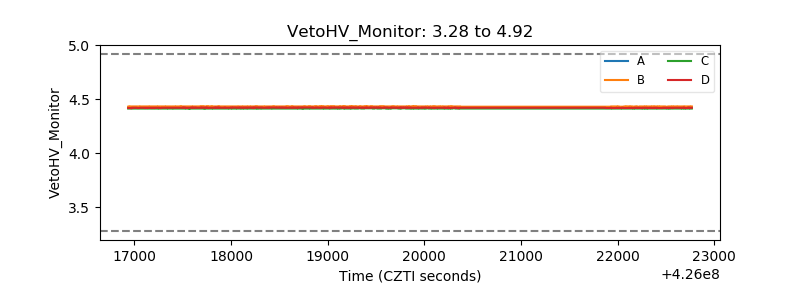 |
| Veto LLD | 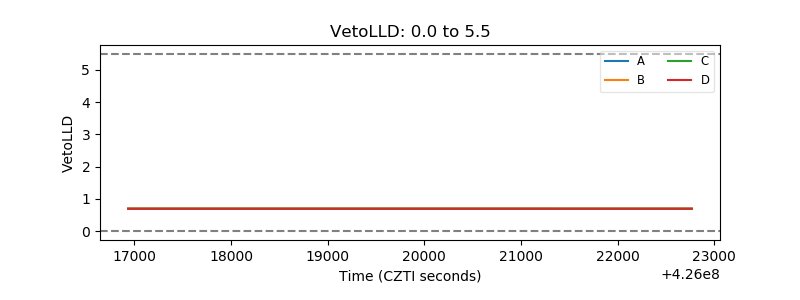 |
| Alpha Counter | 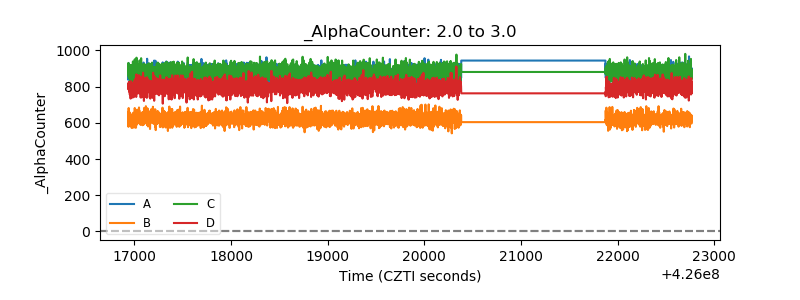 |
| _CPM_Rate | 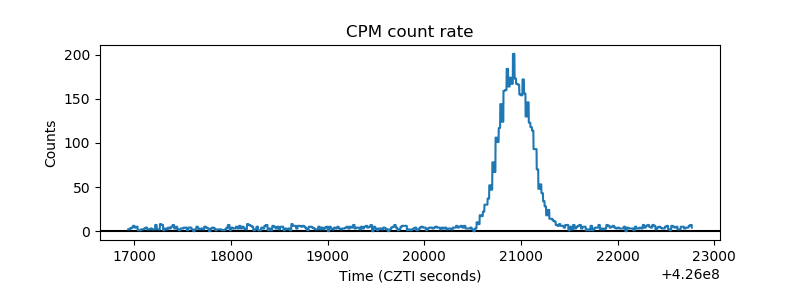 |
| CZT Counter | 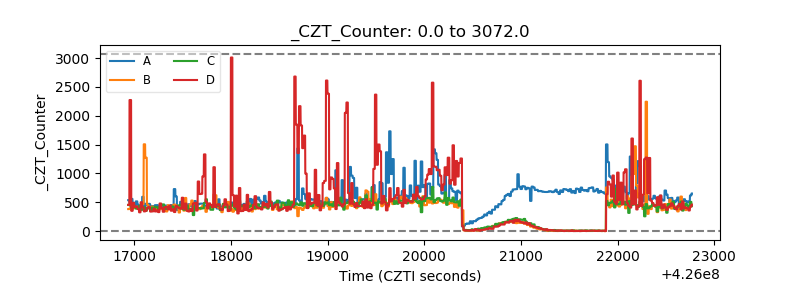 |
| +2.5 Volts monitor | 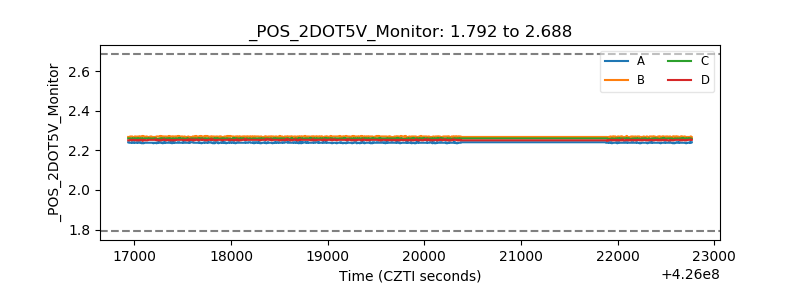 |
| +5 Volts monitor | 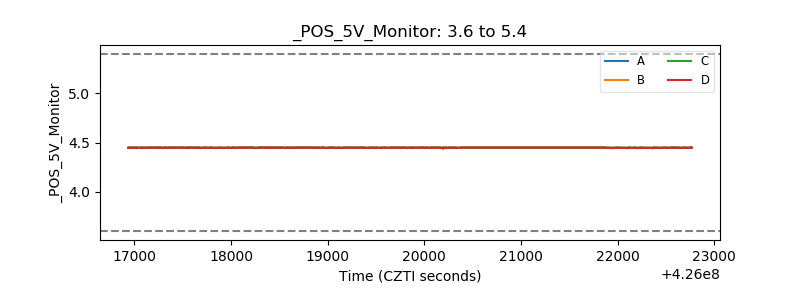 |
| _ROLL_ROT | 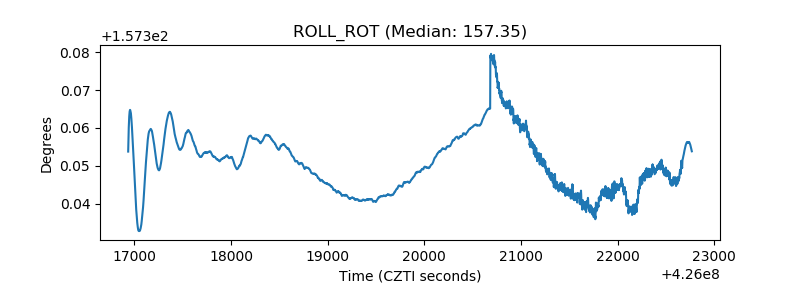 |
| _Roll_DEC | 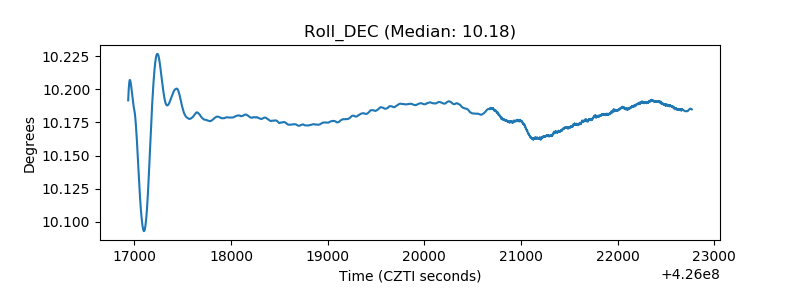 |
| _Roll_RA | 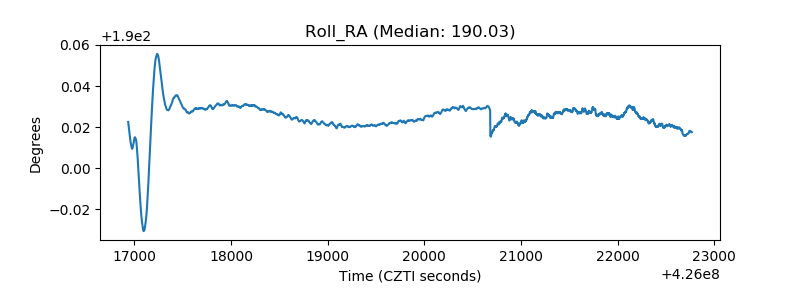 |
| Veto Counter | 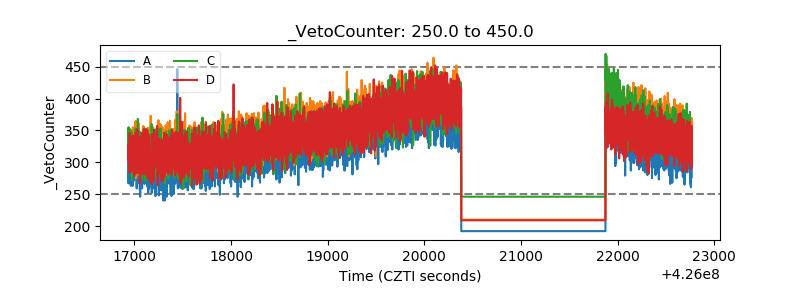 |