| Param | Original file | Final file |
|---|---|---|
| Filename | modeM0/AS1A12_025T15_9000005726_41962cztM0_level2.fits | modeM0/AS1A12_025T15_9000005726_41962cztM0_level2_quad_clean.evt |
| Size (bytes) | 335,373,120 | 91,042,560 |
| Size | 319.8 MB | 86.8 MB |
| Events in quadrant A | 3,463,601 | 605,071 |
| Events in quadrant B | 2,678,962 | 621,547 |
| Events in quadrant C | 2,593,095 | 592,806 |
| Events in quadrant D | 3,239,813 | 542,855 |
| Mode SS | |||
|---|---|---|---|
| Quadrant | BADHDUFLAG | Total packets | Discarded packets |
| A | 0 | 116 | 0 |
| B | 0 | 116 | 0 |
| C | 0 | 116 | 0 |
| D | 0 | 116 | 0 |
| Mode M9 | |||
|---|---|---|---|
| Quadrant | BADHDUFLAG | Total packets | Discarded packets |
| A | 0 | 27 | 0 |
| B | 0 | 27 | 0 |
| C | 0 | 28 | 0 |
| D | 0 | 28 | 0 |
| Mode M0 | |||
|---|---|---|---|
| Quadrant | BADHDUFLAG | Total packets | Discarded packets |
| A | 0 | 13990 | 2 |
| B | 0 | 11943 | 2 |
| C | 0 | 11326 | 3 |
| D | 0 | 13707 | 2 |
| Quadrant | Total seconds | Saturated seconds | Saturation percentage |
|---|---|---|---|
| A | 5635 | 16 | 0.283940% |
| B | 5635 | 27 | 0.479148% |
| C | 5634 | 4 | 0.070998% |
| D | 5634 | 98 | 1.739439% |
Noise dominated data is calculated using 1-second bins in cleaned event files. If a bin has >2000 counts, and if more than 50% of those come from <1% of pixels, then it is considered to be noise-dominated and hence unusable.
| Quadrant | # 1 sec bins | Bins with >0 counts | Bins with >2000 counts | High rate bins dominated by noise | Noise dominated (total time) | Noise dominated (detector-on time) | Marked lightcurve |
|---|---|---|---|---|---|---|---|
| A | 7248 | 5636 | 6 | 6 | 0.08% | 0.11% | 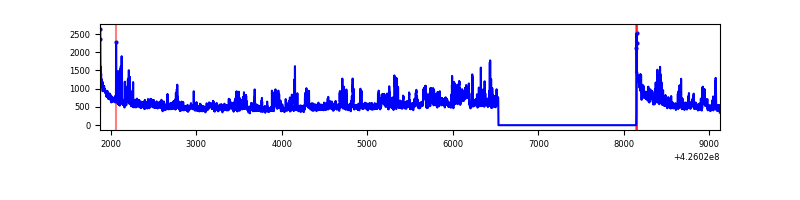 |
| B | 7248 | 5636 | 16 | 16 | 0.22% | 0.28% | 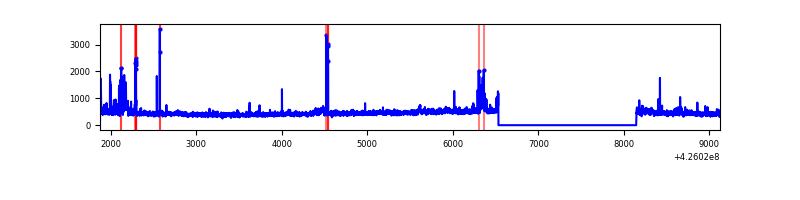 |
| C | 7247 | 5635 | 0 | 0 | 0.00% | 0.00% | 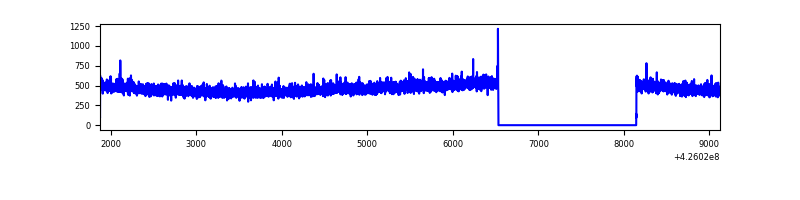 |
| D | 7247 | 5635 | 82 | 82 | 1.13% | 1.46% | 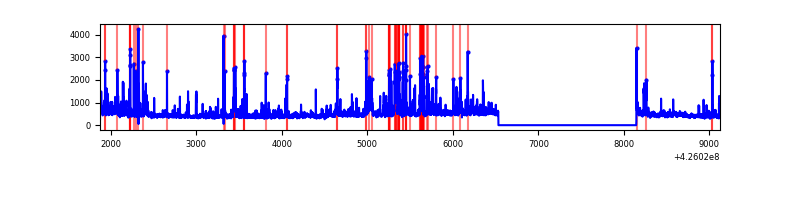 |
Top three noisy pixels from each quadrant. If the there are fewer than three noisy pixels in the level2.evt file, extra rows are filled as -1
| Pixel properties | Quadrant properties | ||||||
|---|---|---|---|---|---|---|---|
| Quadrant | DetID | PixID | Counts | Sigma | Mean | Median | Sigma |
| A | 10 | 83 | 571354 | 4538.71 | 612 | 597 | 125.8 |
| A | 2 | 79 | 500554 | 3975.71 | 612 | 597 | 125.8 |
| A | 13 | 6 | 18003 | 138.41 | 612 | 597 | 125.8 |
| B | 5 | 255 | 157141 | 1305.57 | 611 | 595 | 119.9 |
| B | 0 | 190 | 55082 | 454.41 | 611 | 595 | 119.9 |
| B | 0 | 156 | 42895 | 352.78 | 611 | 595 | 119.9 |
| C | 15 | 214 | 246856 | 1728.2 | 599 | 602 | 142.5 |
| C | 8 | 79 | 4579 | 27.91 | 599 | 602 | 142.5 |
| C | 3 | 233 | 4099 | 24.54 | 599 | 602 | 142.5 |
| D | 13 | 249 | 474802 | 3221.32 | 591 | 573 | 147.2 |
| D | 5 | 222 | 107864 | 728.8 | 591 | 573 | 147.2 |
| D | 1 | 52 | 95203 | 642.8 | 591 | 573 | 147.2 |
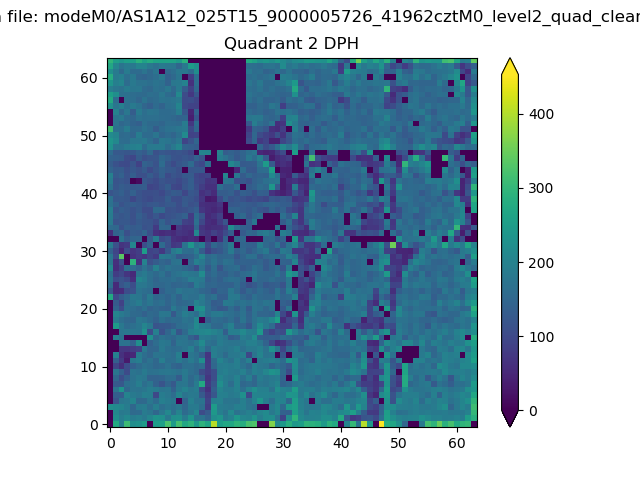
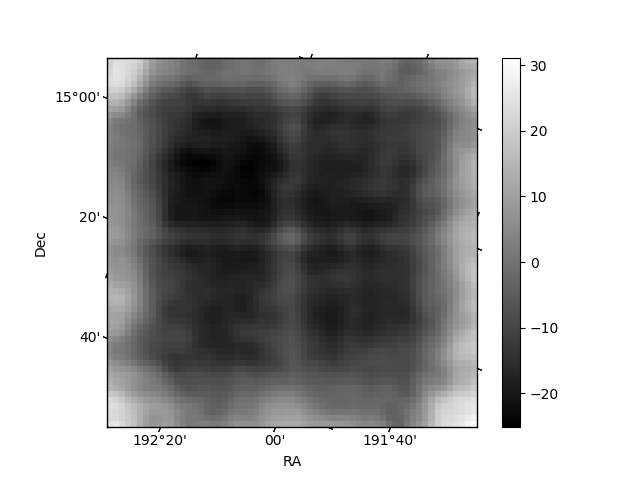
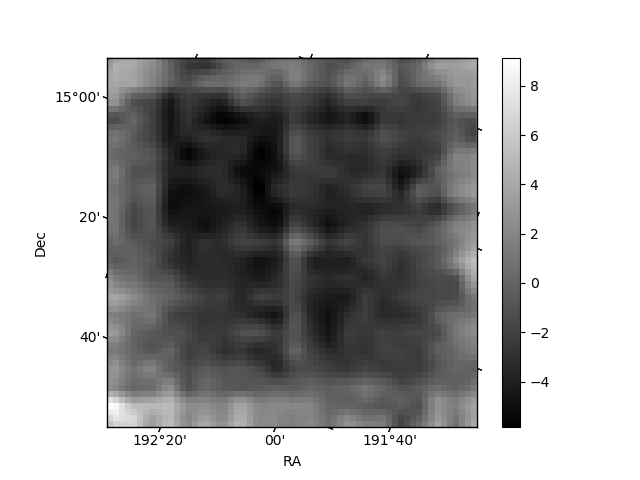
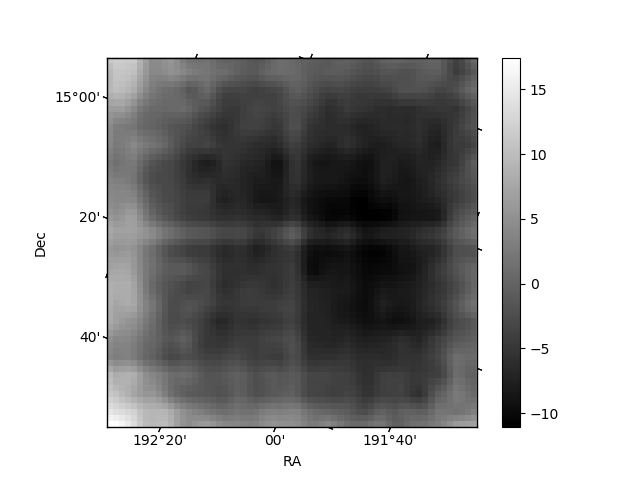
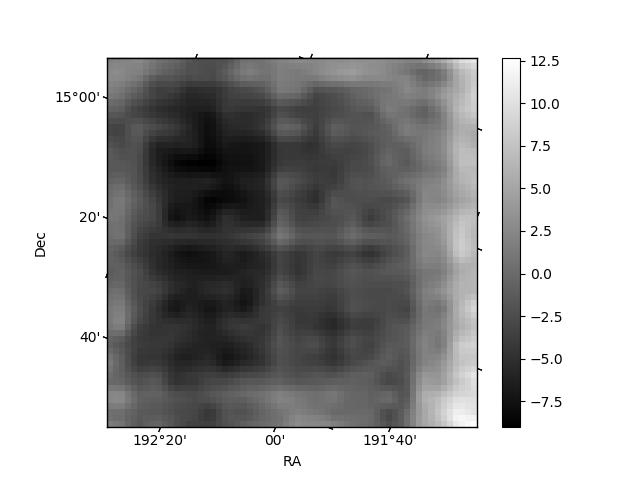
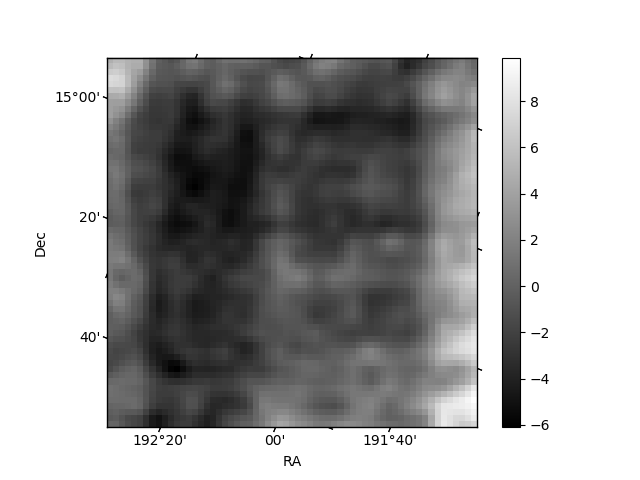
Histogram calculated using DETX and DETY for each event in the final _common_clean file
| Quadrant A | 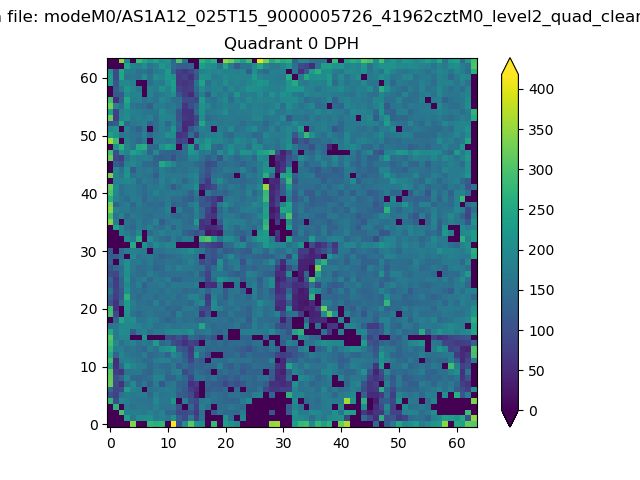 |
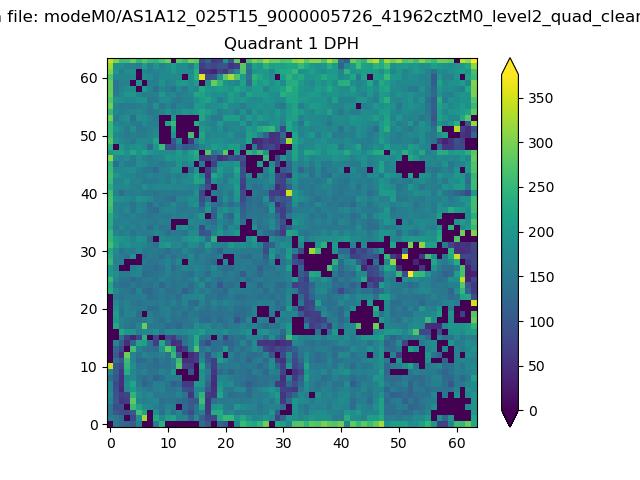 |
Quadrant B |
|---|---|---|---|
| Quadrant D | 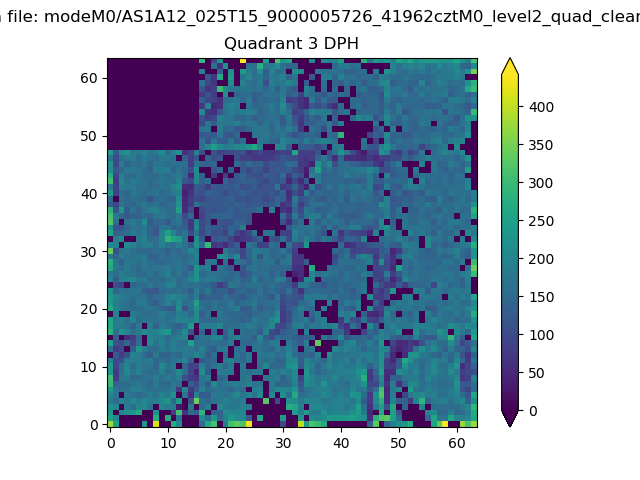 |
 |
Quadrant C |
| Plot type | Count rate plots | Images |
|---|---|---|
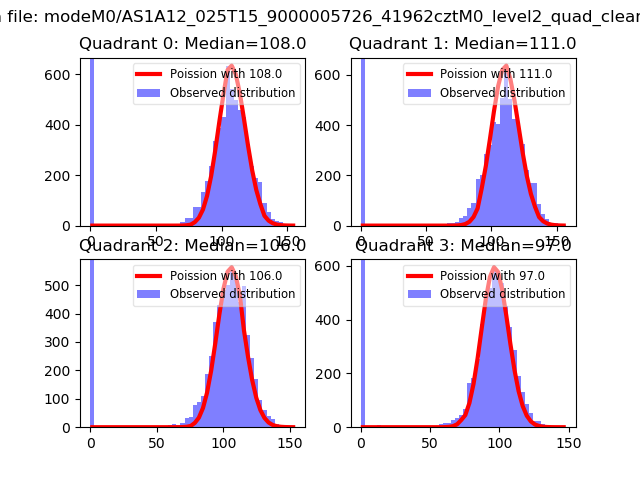
| Comparison with Poisson distribution Blue bars denote a histogram of data divided into 1 sec bins. Red curve is a Poisson curve with rate = median count rate of data. |
 |
 |
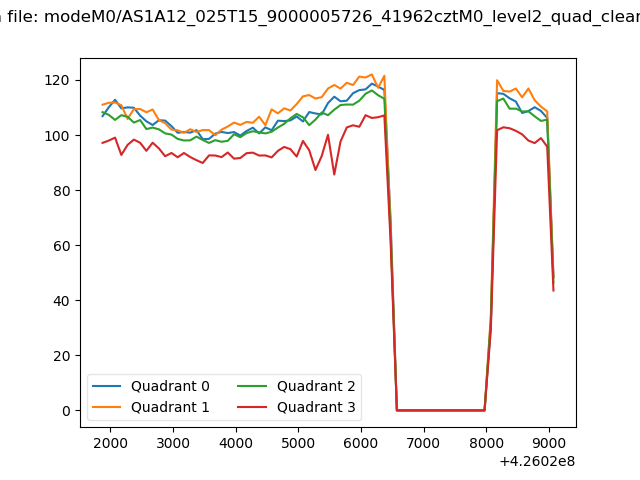
| Quadrant-wise count rates Data is divided into 100 sec bins |
 |
|
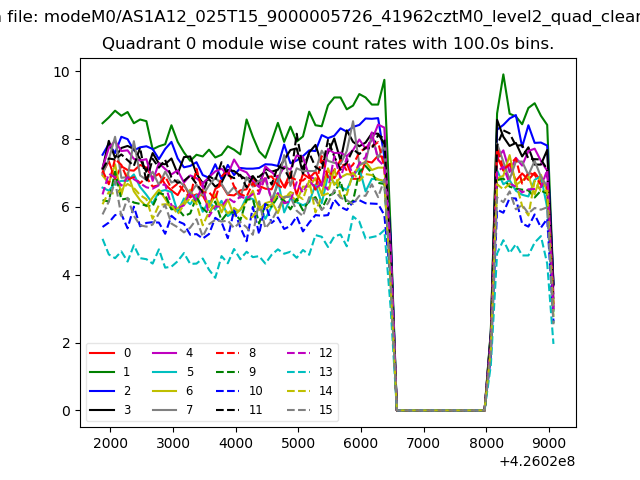
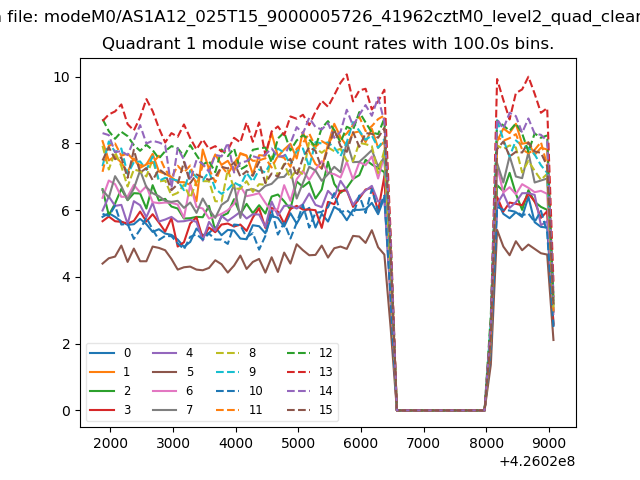
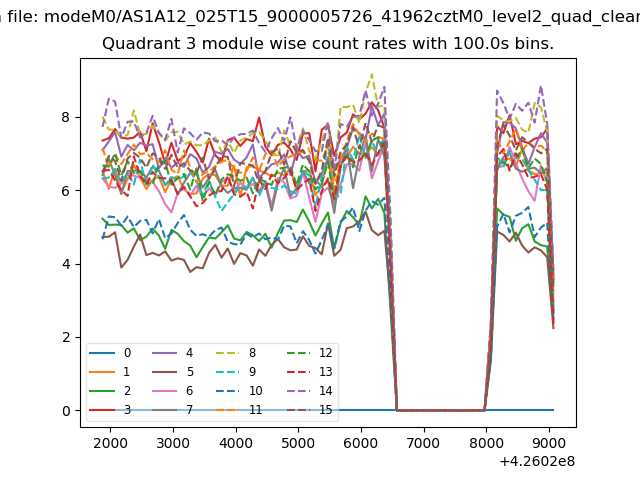
| Module-wise count rates for Quadrant A Data is divided into 100 sec bins |
 |
 |
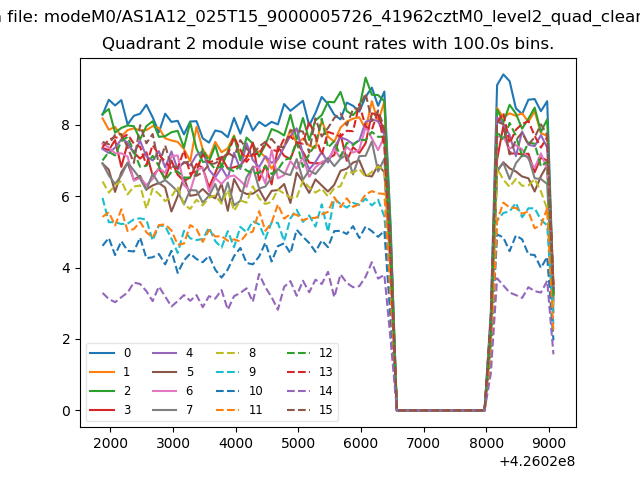
| Module-wise count rates for Quadrant B Data is divided into 100 sec bins |
 |
 |
| Module-wise count rates for Quadrant C Data is divided into 100 sec bins |
 |
 |
| Module-wise count rates for Quadrant D Data is divided into 100 sec bins |
 |
 |
| Parameter | Plot |
|---|---|
| CZT HV Monitor | 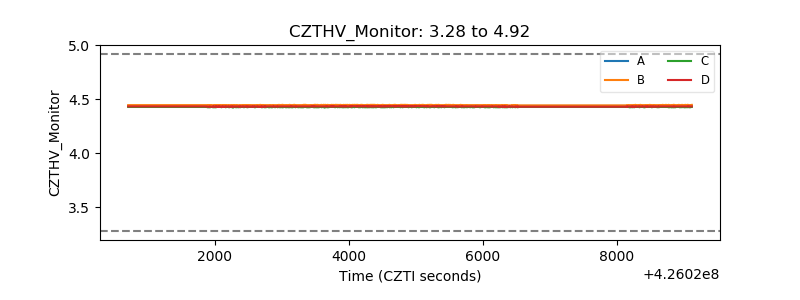 |
| D_VDD | 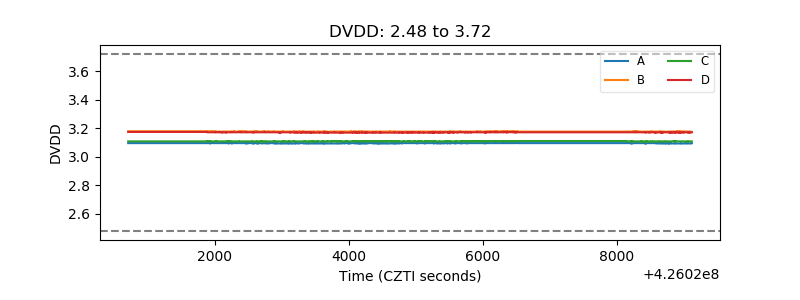 |
| Temperature 1 | 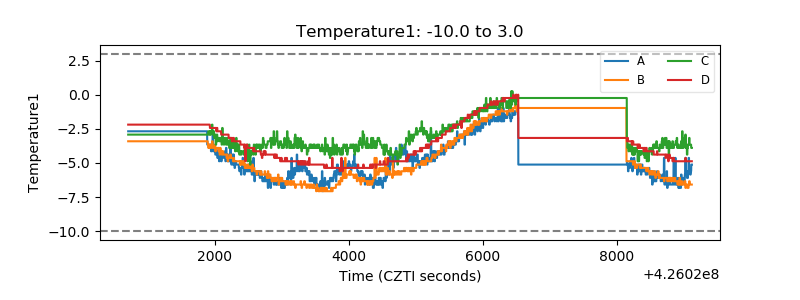 |
| Veto HV Monitor | 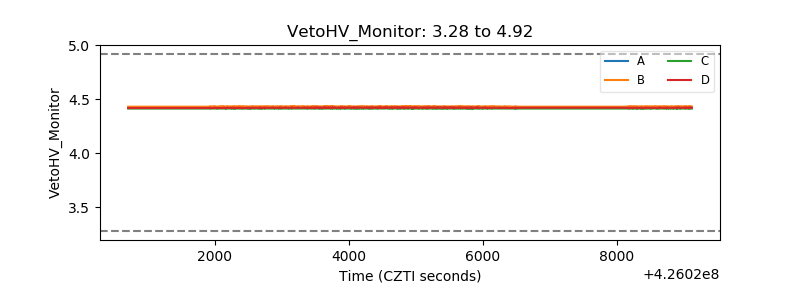 |
| Veto LLD | 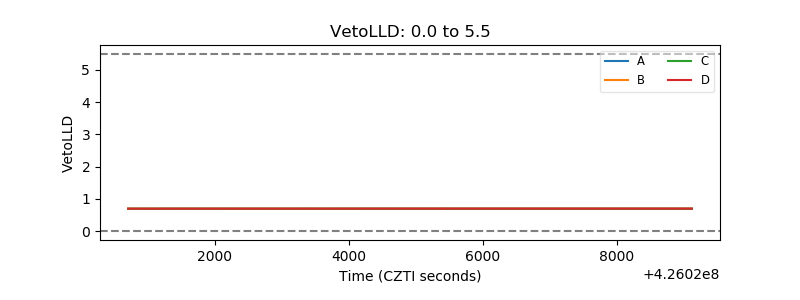 |
| Alpha Counter | 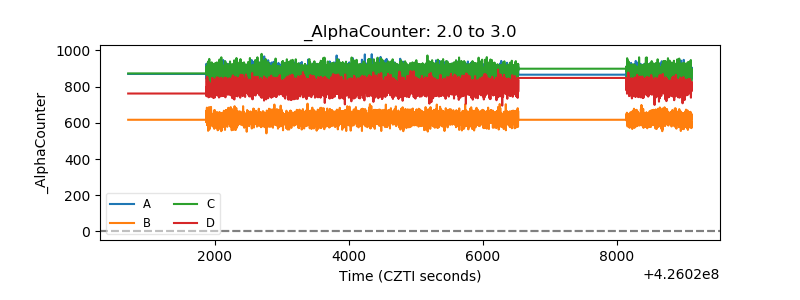 |
| _CPM_Rate | 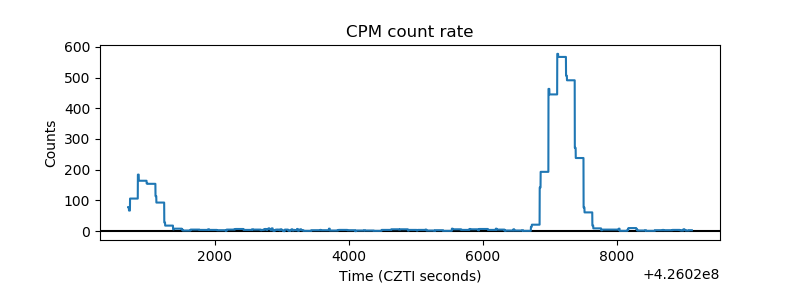 |
| CZT Counter | 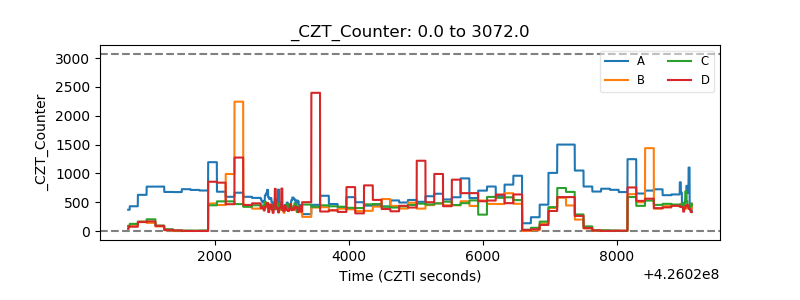 |
| +2.5 Volts monitor | 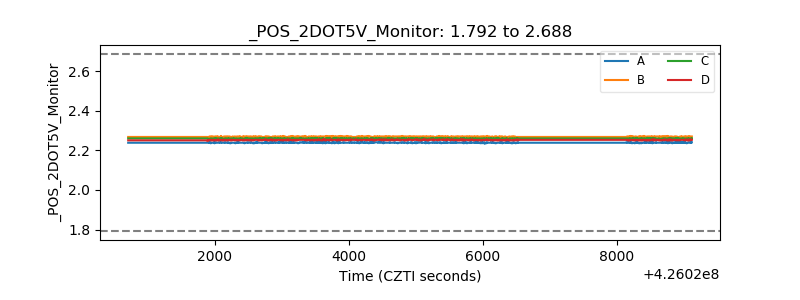 |
| +5 Volts monitor | 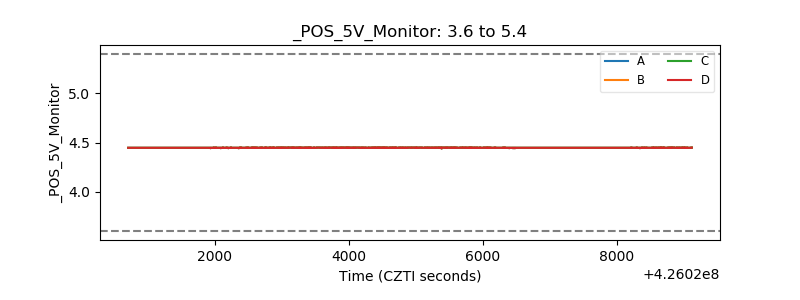 |
| _ROLL_ROT | 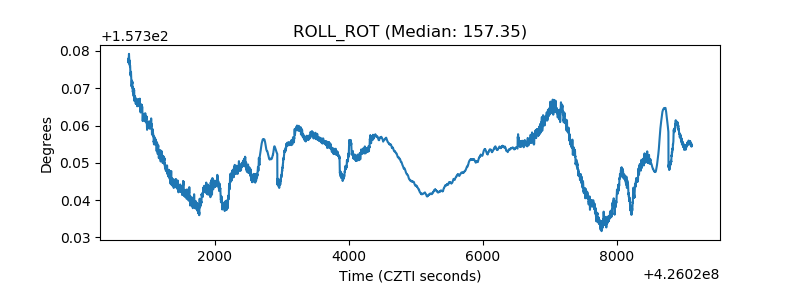 |
| _Roll_DEC | 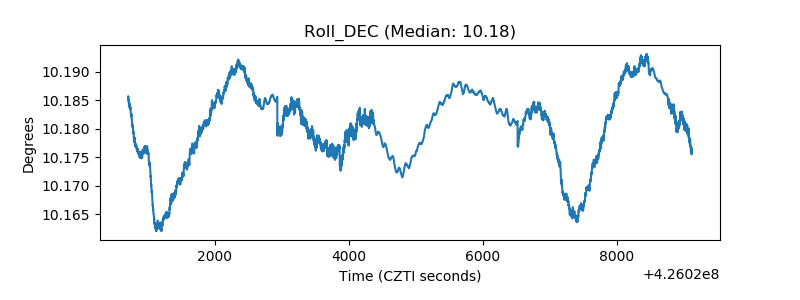 |
| _Roll_RA | 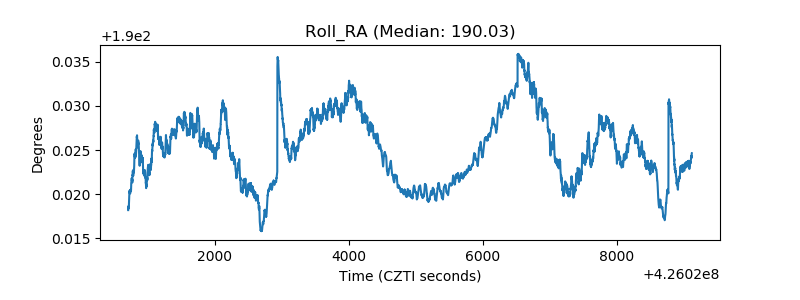 |
| Veto Counter | 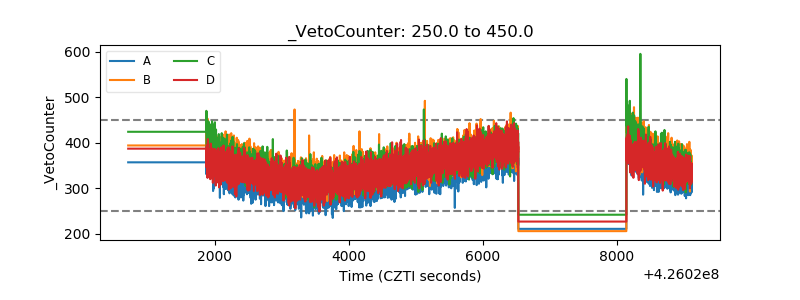 |