| Param | Original file | Final file |
|---|---|---|
| Filename | modeM0/AS1A12_025T15_9000005726_41964cztM0_level2.fits | modeM0/AS1A12_025T15_9000005726_41964cztM0_level2_quad_clean.evt |
| Size (bytes) | 318,631,680 | 90,601,920 |
| Size | 303.9 MB | 86.4 MB |
| Events in quadrant A | 3,527,941 | 604,943 |
| Events in quadrant B | 2,510,893 | 623,387 |
| Events in quadrant C | 2,565,534 | 590,661 |
| Events in quadrant D | 2,763,245 | 540,735 |
| Mode SS | |||
|---|---|---|---|
| Quadrant | BADHDUFLAG | Total packets | Discarded packets |
| A | 0 | 114 | 0 |
| B | 0 | 114 | 0 |
| C | 0 | 114 | 0 |
| D | 0 | 114 | 0 |
| Mode M9 | |||
|---|---|---|---|
| Quadrant | BADHDUFLAG | Total packets | Discarded packets |
| A | 0 | 34 | 0 |
| B | 0 | 34 | 0 |
| C | 0 | 34 | 0 |
| D | 0 | 34 | 0 |
| Mode M0 | |||
|---|---|---|---|
| Quadrant | BADHDUFLAG | Total packets | Discarded packets |
| A | 0 | 14062 | 4 |
| B | 0 | 11252 | 2 |
| C | 0 | 11034 | 2 |
| D | 0 | 12082 | 2 |
| Quadrant | Total seconds | Saturated seconds | Saturation percentage |
|---|---|---|---|
| A | 5481 | 24 | 0.437876% |
| B | 5482 | 9 | 0.164174% |
| C | 5482 | 5 | 0.091208% |
| D | 5482 | 67 | 1.222182% |
Noise dominated data is calculated using 1-second bins in cleaned event files. If a bin has >2000 counts, and if more than 50% of those come from <1% of pixels, then it is considered to be noise-dominated and hence unusable.
| Quadrant | # 1 sec bins | Bins with >0 counts | Bins with >2000 counts | High rate bins dominated by noise | Noise dominated (total time) | Noise dominated (detector-on time) | Marked lightcurve |
|---|---|---|---|---|---|---|---|
| A | 8857 | 5483 | 9 | 9 | 0.10% | 0.16% | 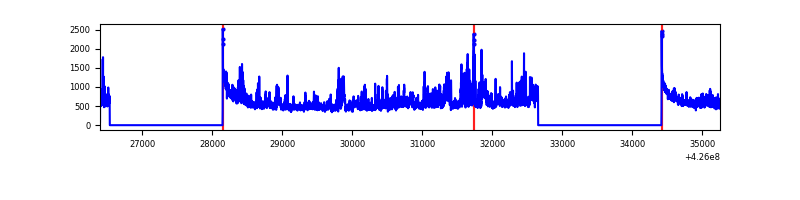 |
| B | 8858 | 5484 | 1 | 1 | 0.01% | 0.02% | 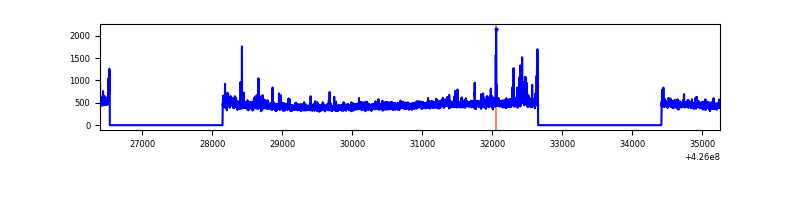 |
| C | 8858 | 5484 | 0 | 0 | 0.00% | 0.00% | 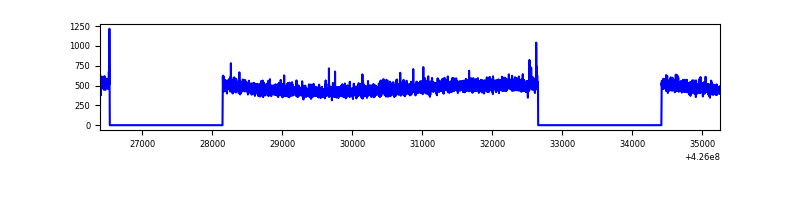 |
| D | 8858 | 5484 | 55 | 55 | 0.62% | 1.00% | 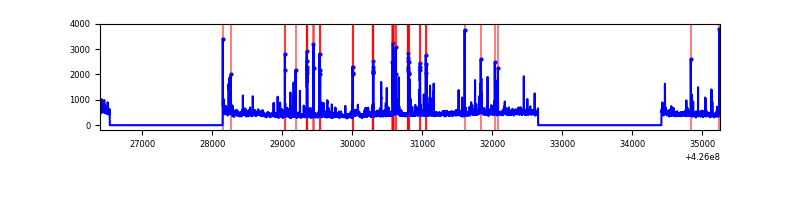 |
Top three noisy pixels from each quadrant. If the there are fewer than three noisy pixels in the level2.evt file, extra rows are filled as -1
| Pixel properties | Quadrant properties | ||||||
|---|---|---|---|---|---|---|---|
| Quadrant | DetID | PixID | Counts | Sigma | Mean | Median | Sigma |
| A | 2 | 79 | 610895 | 4874.33 | 607 | 592 | 125.2 |
| A | 10 | 83 | 543653 | 4337.28 | 607 | 592 | 125.2 |
| A | 13 | 6 | 18288 | 141.33 | 607 | 592 | 125.2 |
| B | 5 | 255 | 56030 | 464.17 | 606 | 589 | 119.4 |
| B | 0 | 190 | 44166 | 364.84 | 606 | 589 | 119.4 |
| B | 12 | 111 | 15245 | 122.7 | 606 | 589 | 119.4 |
| C | 15 | 214 | 241695 | 1722.76 | 593 | 597 | 139.9 |
| C | 15 | 111 | 5643 | 36.06 | 593 | 597 | 139.9 |
| C | 13 | 61 | 3952 | 23.97 | 593 | 597 | 139.9 |
| D | 13 | 249 | 268878 | 1825.95 | 589 | 572 | 146.9 |
| D | 12 | 6 | 66291 | 447.25 | 589 | 572 | 146.9 |
| D | 1 | 52 | 56519 | 380.75 | 589 | 572 | 146.9 |
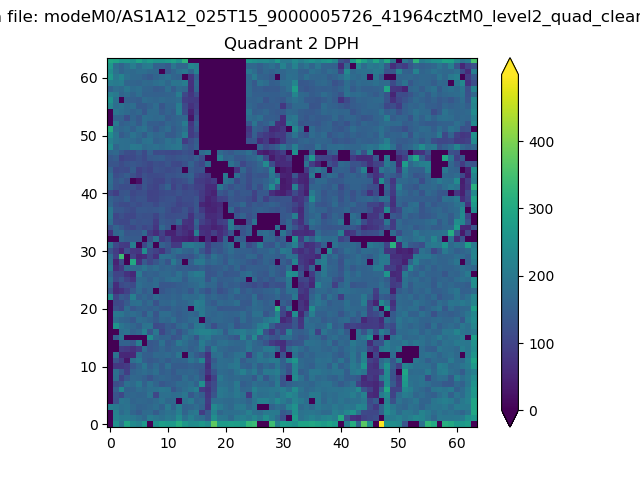
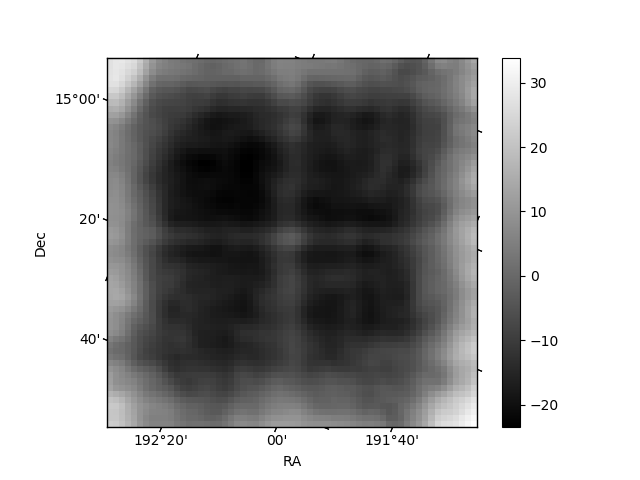
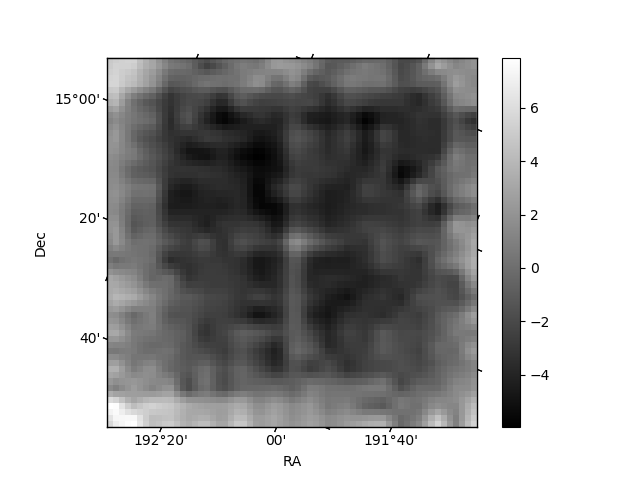
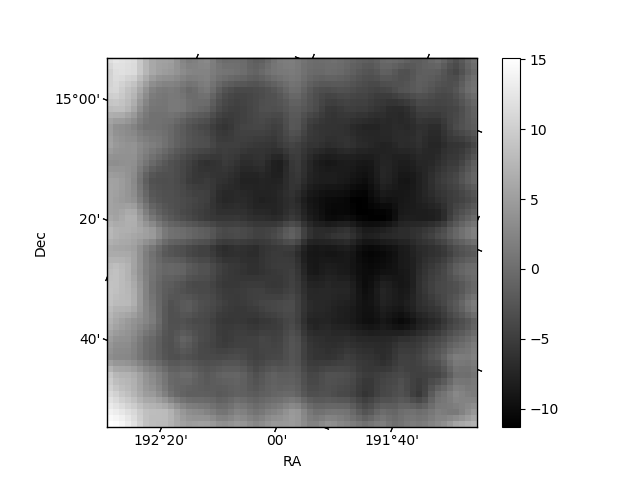
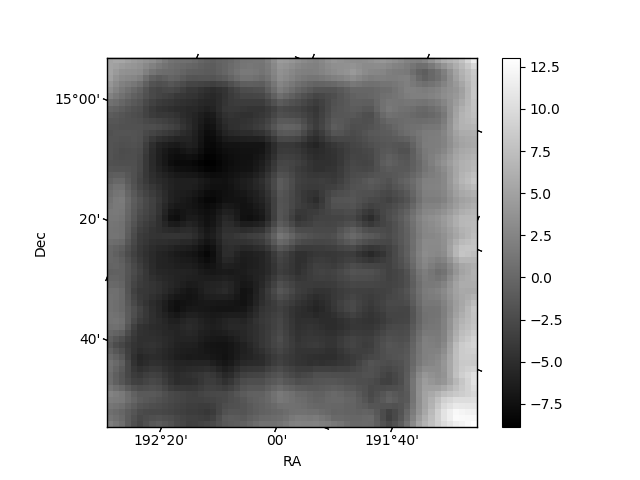
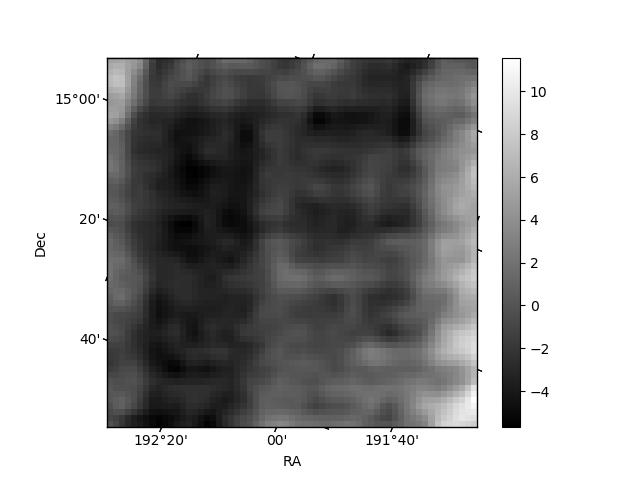
Histogram calculated using DETX and DETY for each event in the final _common_clean file
| Quadrant A | 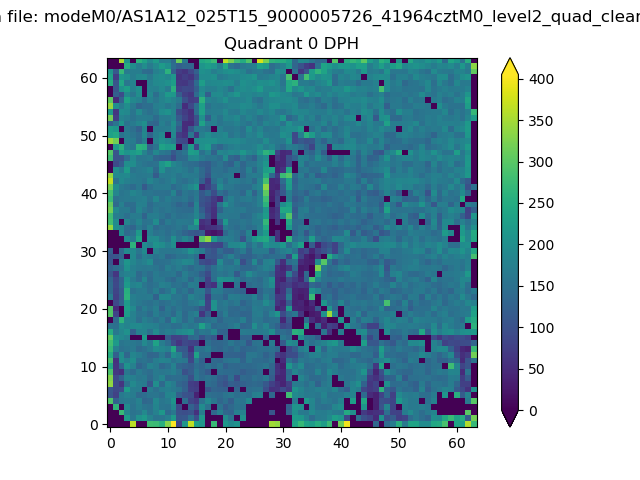 |
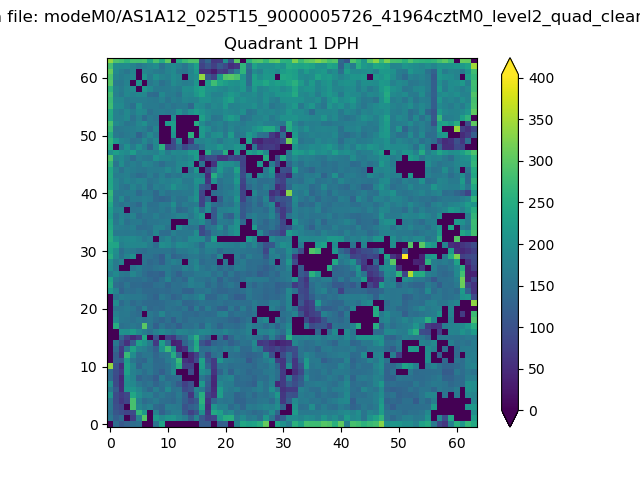 |
Quadrant B |
|---|---|---|---|
| Quadrant D | 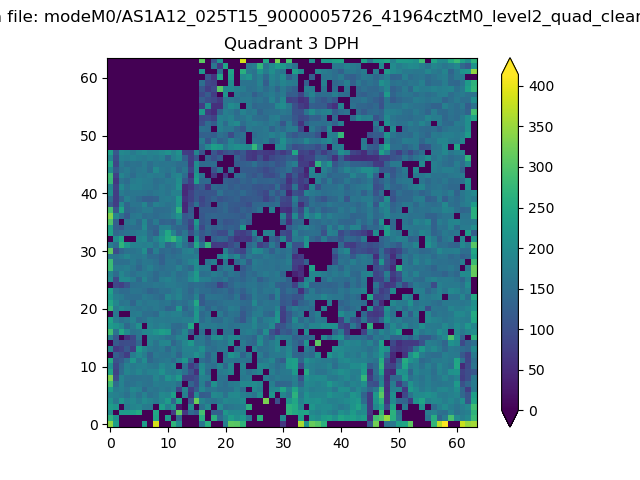 |
 |
Quadrant C |
| Plot type | Count rate plots | Images |
|---|---|---|
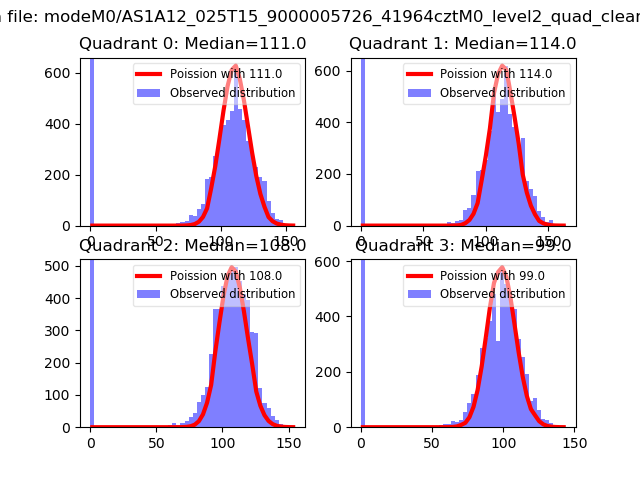
| Comparison with Poisson distribution Blue bars denote a histogram of data divided into 1 sec bins. Red curve is a Poisson curve with rate = median count rate of data. |
 |
 |
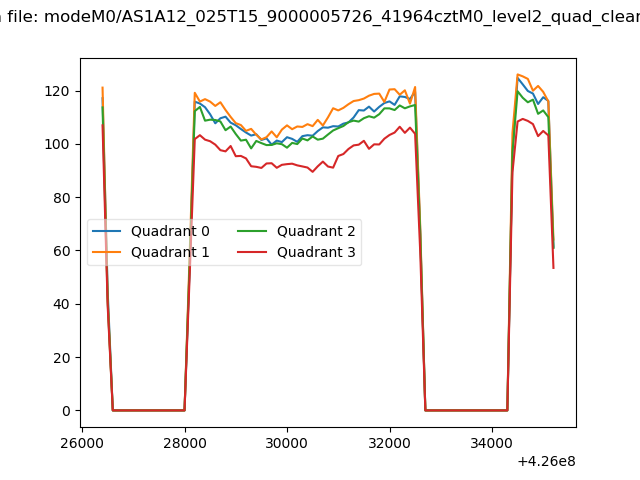
| Quadrant-wise count rates Data is divided into 100 sec bins |
 |
|
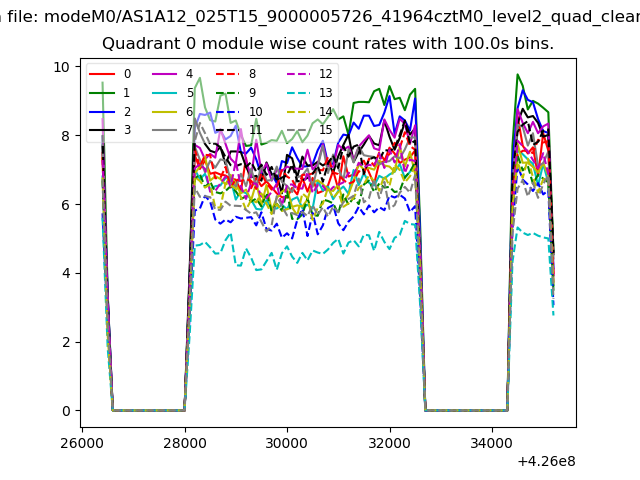
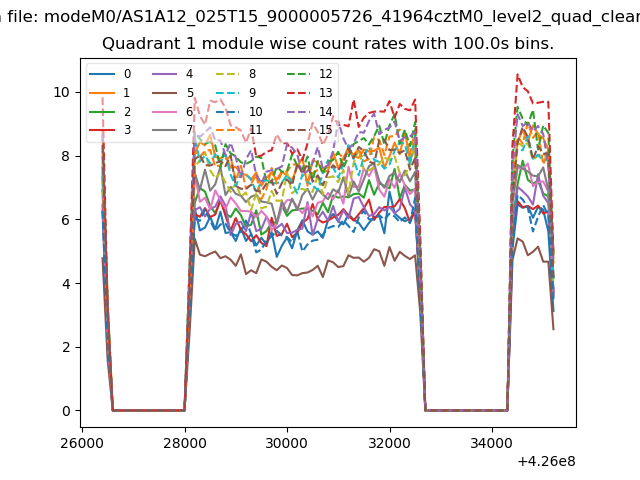
| Module-wise count rates for Quadrant A Data is divided into 100 sec bins |
 |
 |
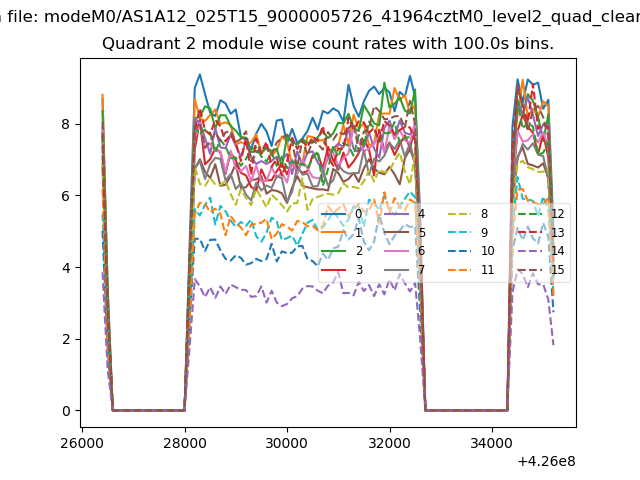
| Module-wise count rates for Quadrant B Data is divided into 100 sec bins |
 |
 |
| Module-wise count rates for Quadrant C Data is divided into 100 sec bins |
 |
 |
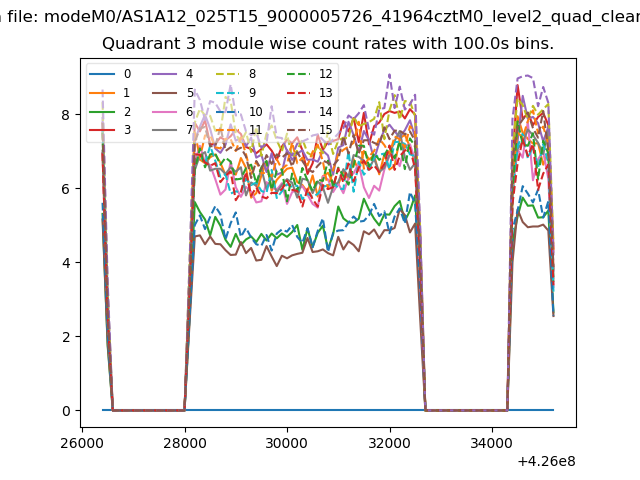
| Module-wise count rates for Quadrant D Data is divided into 100 sec bins |
 |
 |
| Parameter | Plot |
|---|---|
| CZT HV Monitor |  |
| D_VDD | 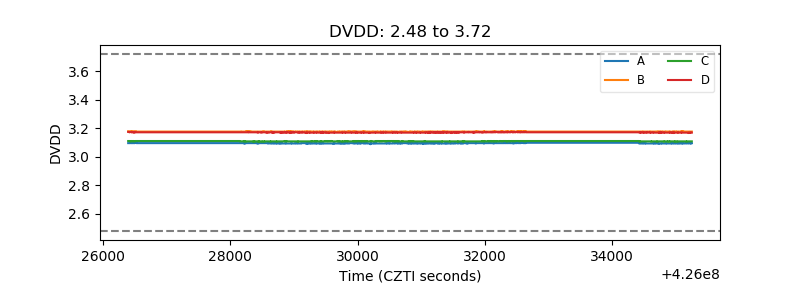 |
| Temperature 1 | 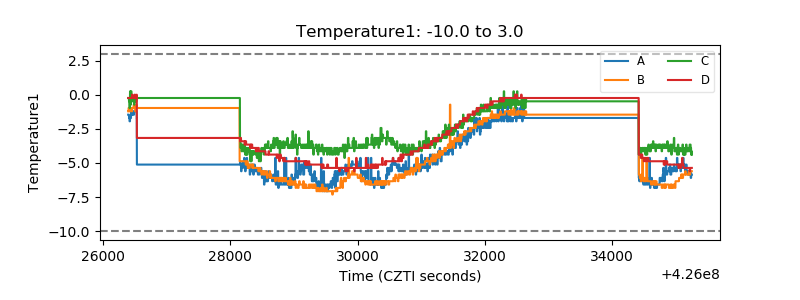 |
| Veto HV Monitor | 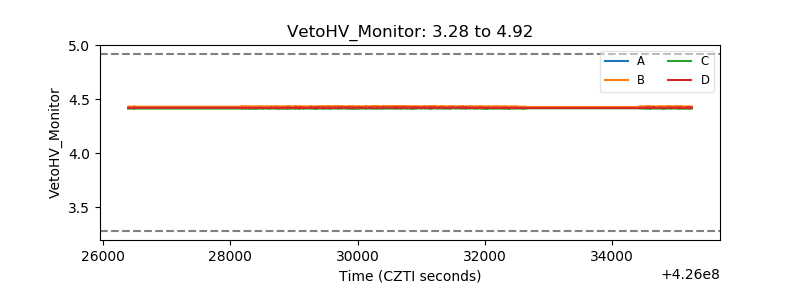 |
| Veto LLD | 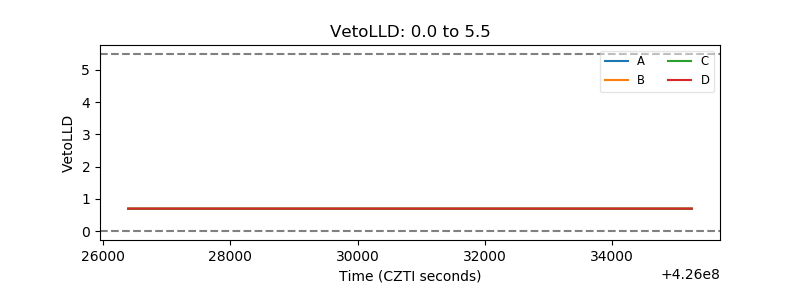 |
| Alpha Counter | 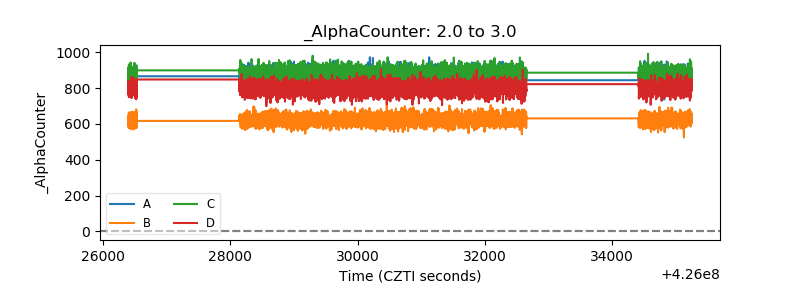 |
| _CPM_Rate | 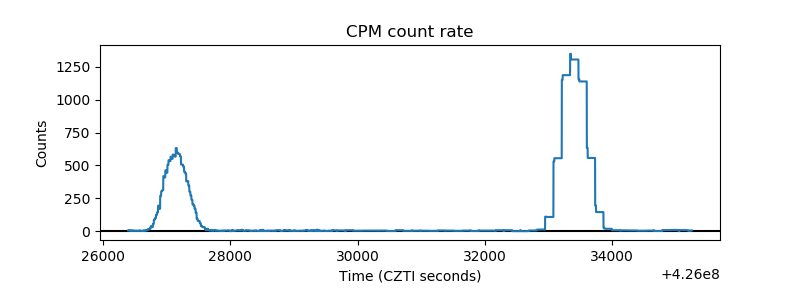 |
| CZT Counter | 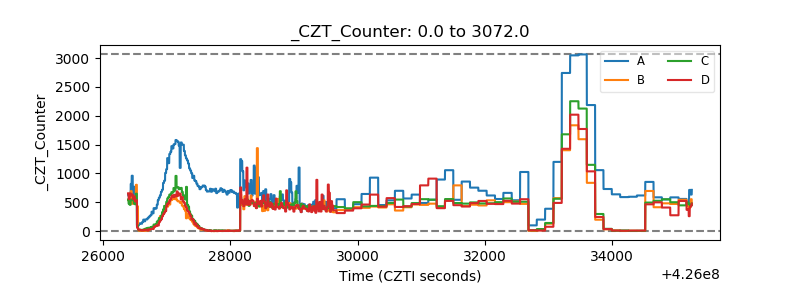 |
| +2.5 Volts monitor | 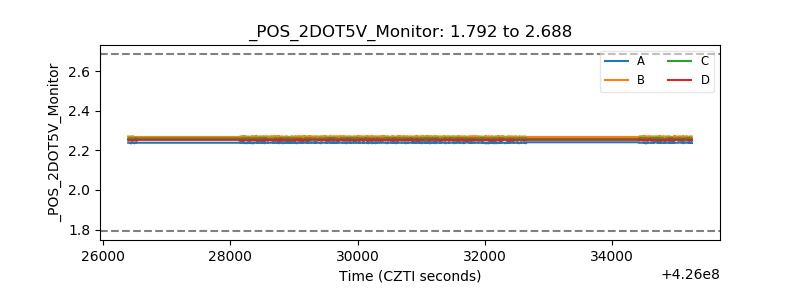 |
| +5 Volts monitor |  |
| _ROLL_ROT | 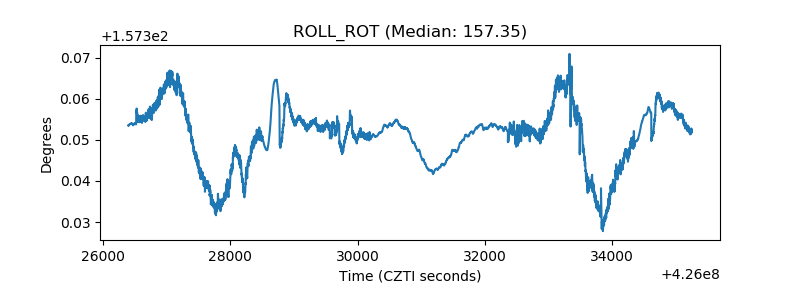 |
| _Roll_DEC | 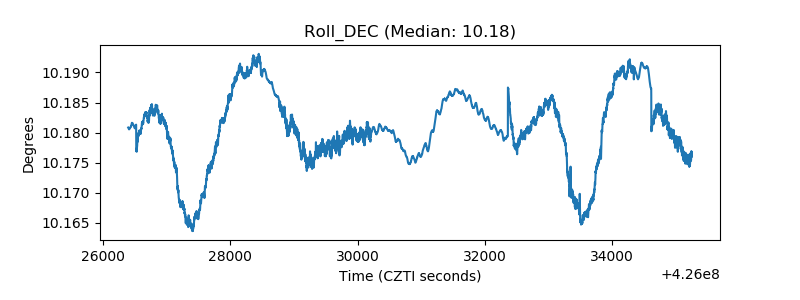 |
| _Roll_RA | 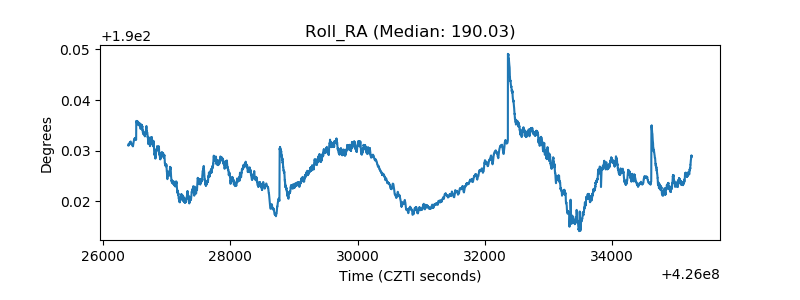 |
| Veto Counter | 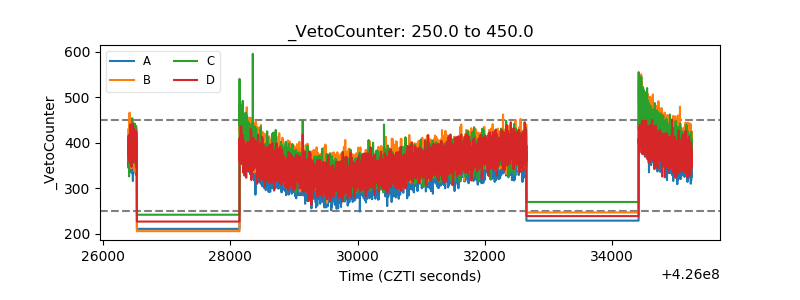 |