| Param | Original file | Final file |
|---|---|---|
| Filename | modeM0/AS1A12_025T15_9000005726_41965cztM0_level2.fits | modeM0/AS1A12_025T15_9000005726_41965cztM0_level2_quad_clean.evt |
| Size (bytes) | 319,887,360 | 89,648,640 |
| Size | 305.1 MB | 85.5 MB |
| Events in quadrant A | 3,289,963 | 607,804 |
| Events in quadrant B | 2,507,292 | 627,901 |
| Events in quadrant C | 2,499,373 | 588,041 |
| Events in quadrant D | 3,137,974 | 526,031 |
| Mode SS | |||
|---|---|---|---|
| Quadrant | BADHDUFLAG | Total packets | Discarded packets |
| A | 0 | 104 | 0 |
| B | 0 | 104 | 0 |
| C | 0 | 104 | 0 |
| D | 0 | 104 | 0 |
| Mode M9 | |||
|---|---|---|---|
| Quadrant | BADHDUFLAG | Total packets | Discarded packets |
| A | 0 | 28 | 0 |
| B | 0 | 29 | 0 |
| C | 0 | 29 | 0 |
| D | 0 | 29 | 0 |
| Mode M0 | |||
|---|---|---|---|
| Quadrant | BADHDUFLAG | Total packets | Discarded packets |
| A | 0 | 13101 | 2 |
| B | 0 | 10891 | 4 |
| C | 0 | 10498 | 2 |
| D | 0 | 12921 | 2 |
| Quadrant | Total seconds | Saturated seconds | Saturation percentage |
|---|---|---|---|
| A | 5218 | 18 | 0.344960% |
| B | 5217 | 10 | 0.191681% |
| C | 5217 | 2 | 0.038336% |
| D | 5217 | 188 | 3.603604% |
Noise dominated data is calculated using 1-second bins in cleaned event files. If a bin has >2000 counts, and if more than 50% of those come from <1% of pixels, then it is considered to be noise-dominated and hence unusable.
| Quadrant | # 1 sec bins | Bins with >0 counts | Bins with >2000 counts | High rate bins dominated by noise | Noise dominated (total time) | Noise dominated (detector-on time) | Marked lightcurve |
|---|---|---|---|---|---|---|---|
| A | 7070 | 5219 | 6 | 6 | 0.08% | 0.11% | 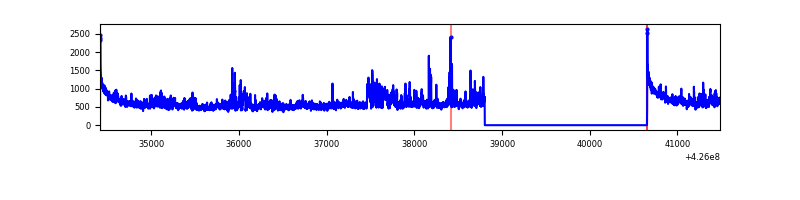 |
| B | 7069 | 5218 | 7 | 7 | 0.10% | 0.13% | 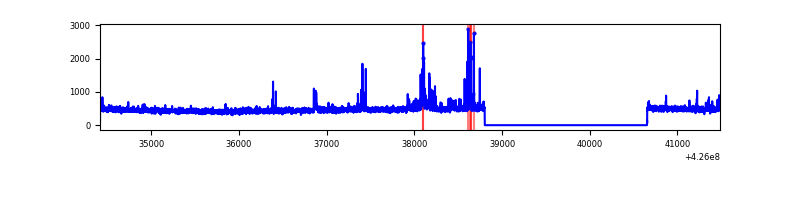 |
| C | 7069 | 5218 | 0 | 0 | 0.00% | 0.00% | 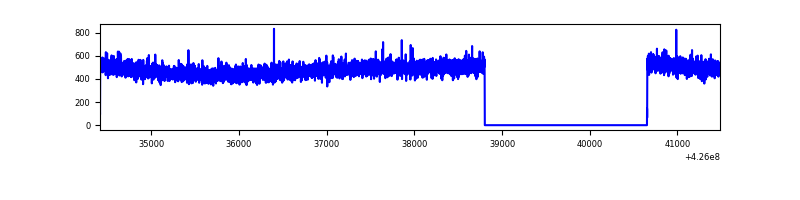 |
| D | 7069 | 5218 | 173 | 173 | 2.45% | 3.32% | 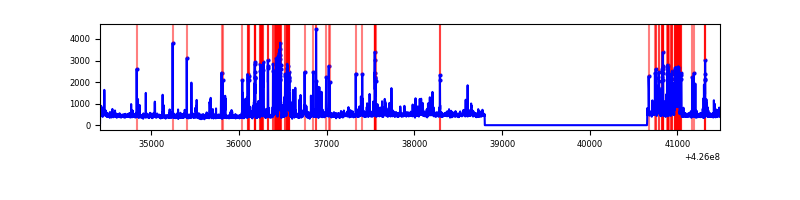 |
Top three noisy pixels from each quadrant. If the there are fewer than three noisy pixels in the level2.evt file, extra rows are filled as -1
| Pixel properties | Quadrant properties | ||||||
|---|---|---|---|---|---|---|---|
| Quadrant | DetID | PixID | Counts | Sigma | Mean | Median | Sigma |
| A | 10 | 83 | 530253 | 4300.9 | 599 | 588 | 123.2 |
| A | 2 | 79 | 413565 | 3353.39 | 599 | 588 | 123.2 |
| A | 15 | 222 | 20307 | 160.12 | 599 | 588 | 123.2 |
| B | 5 | 255 | 70768 | 597.34 | 597 | 582 | 117.5 |
| B | 0 | 190 | 65590 | 553.27 | 597 | 582 | 117.5 |
| B | 15 | 85 | 25168 | 209.25 | 597 | 582 | 117.5 |
| C | 15 | 214 | 230139 | 1686.86 | 580 | 585 | 136.1 |
| C | 9 | 54 | 7048 | 47.49 | 580 | 585 | 136.1 |
| C | 13 | 61 | 3902 | 24.37 | 580 | 585 | 136.1 |
| D | 13 | 249 | 628879 | 4474.33 | 569 | 552 | 140.4 |
| D | 12 | 6 | 144035 | 1021.74 | 569 | 552 | 140.4 |
| D | 2 | 249 | 70944 | 501.26 | 569 | 552 | 140.4 |
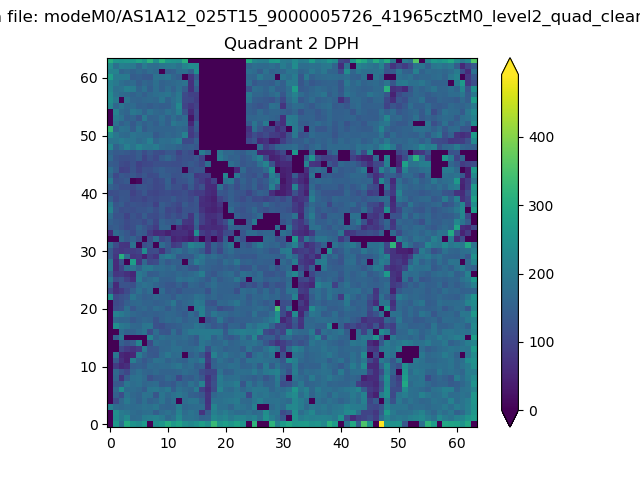
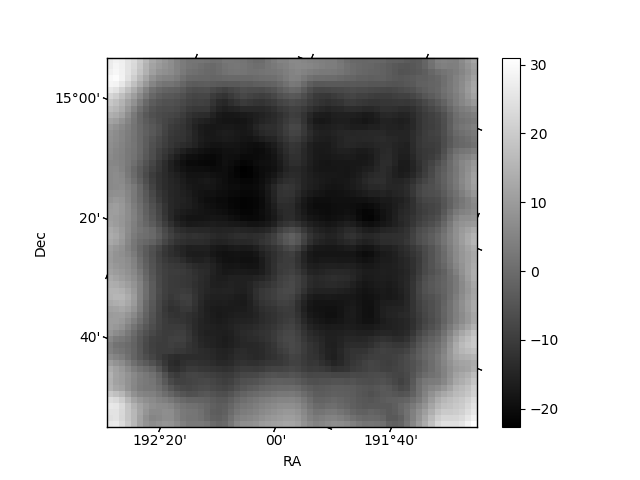
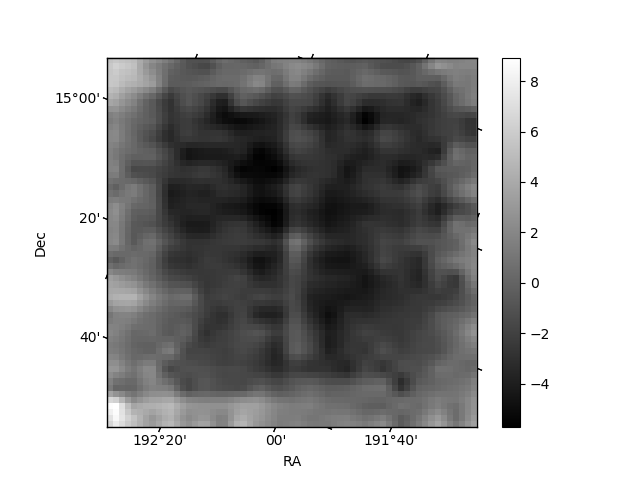
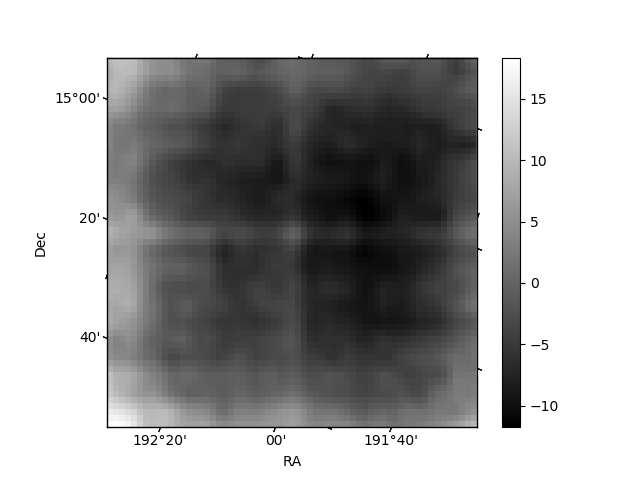
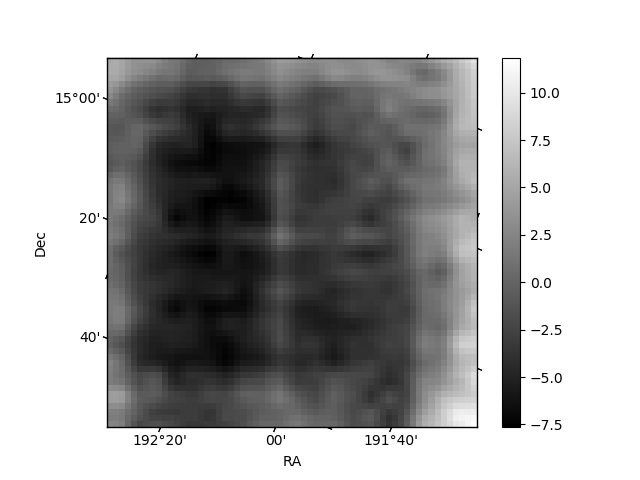
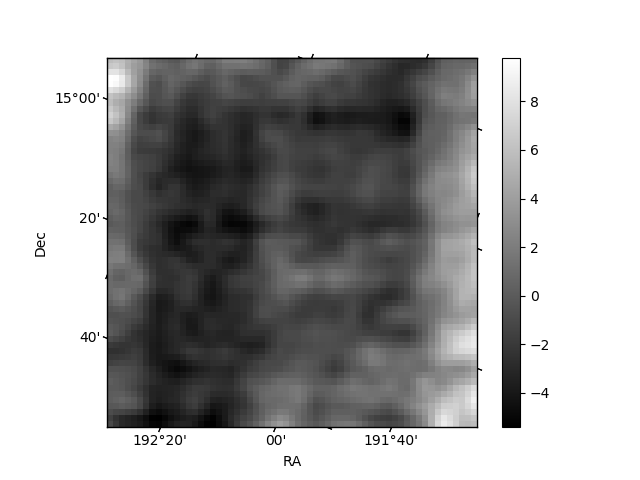
Histogram calculated using DETX and DETY for each event in the final _common_clean file
| Quadrant A | 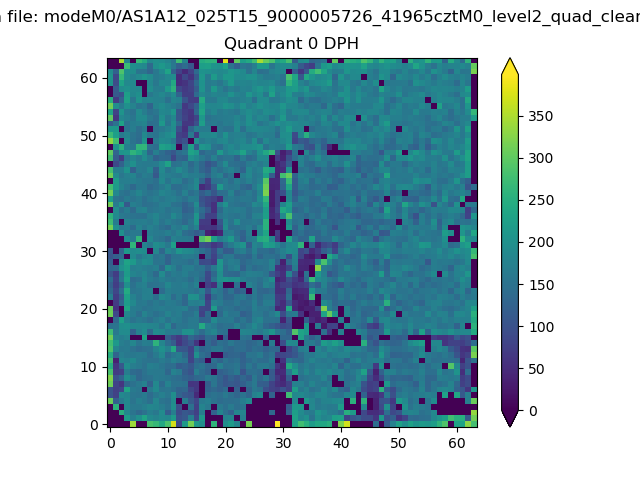 |
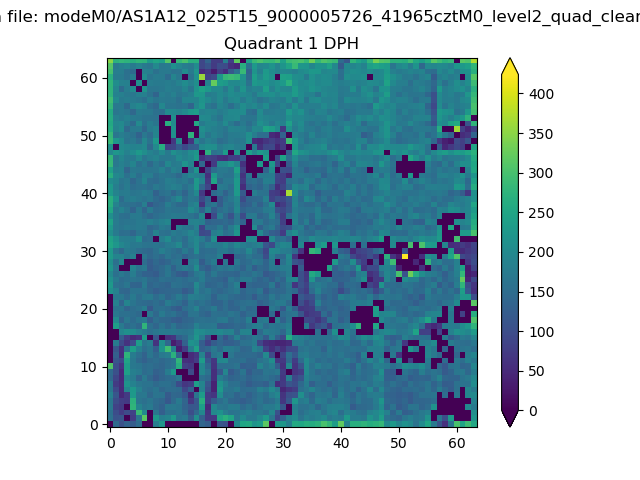 |
Quadrant B |
|---|---|---|---|
| Quadrant D | 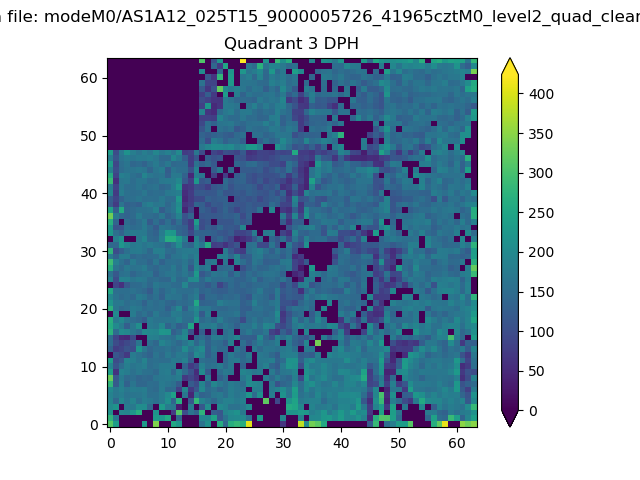 |
 |
Quadrant C |
| Plot type | Count rate plots | Images |
|---|---|---|
| Comparison with Poisson distribution Blue bars denote a histogram of data divided into 1 sec bins. Red curve is a Poisson curve with rate = median count rate of data. |
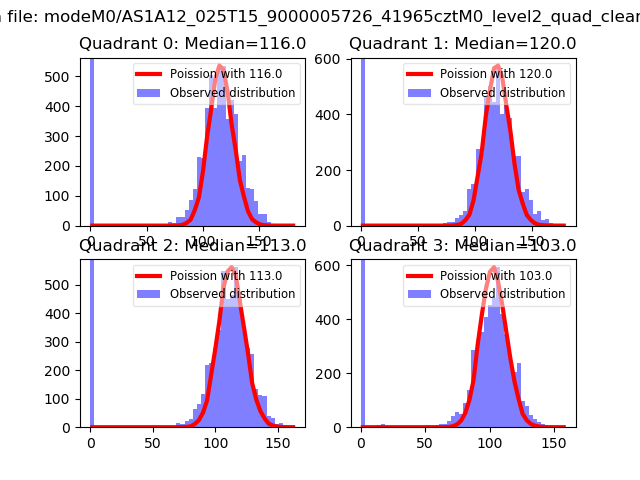 |
 |
| Quadrant-wise count rates Data is divided into 100 sec bins |
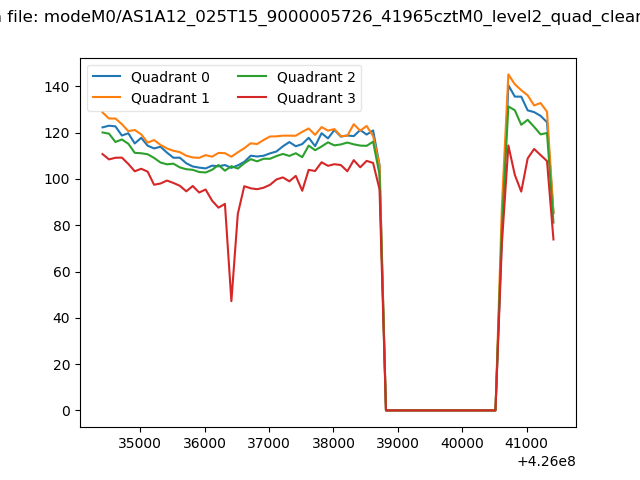 |
|
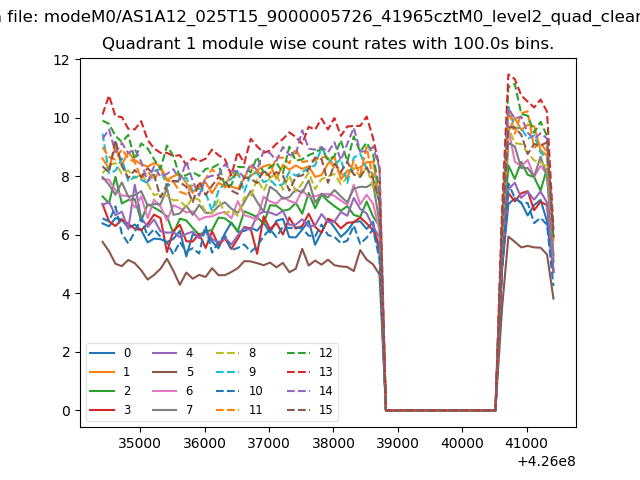
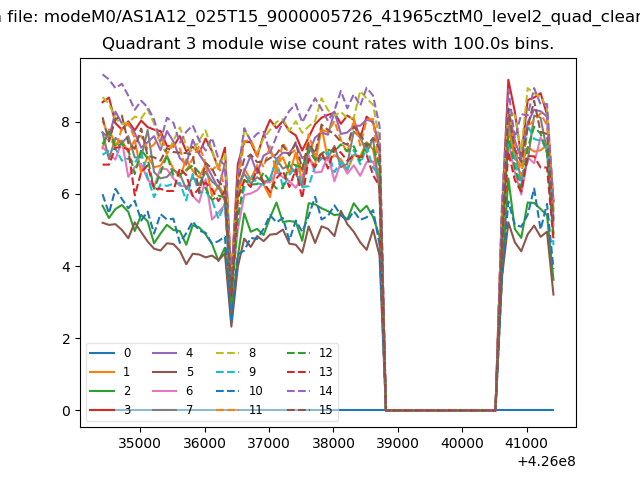
| Module-wise count rates for Quadrant A Data is divided into 100 sec bins |
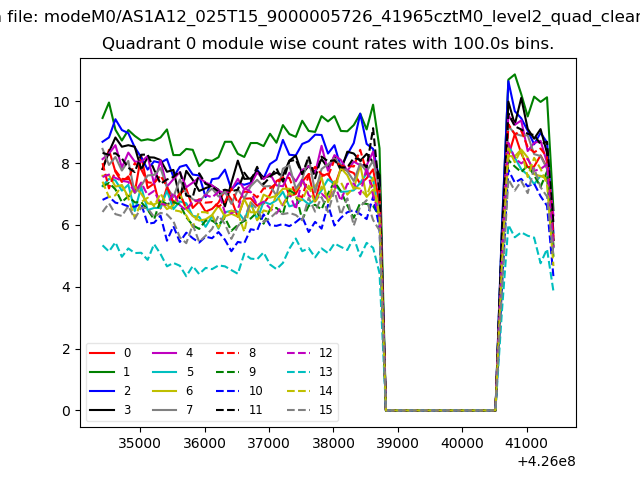 |
 |
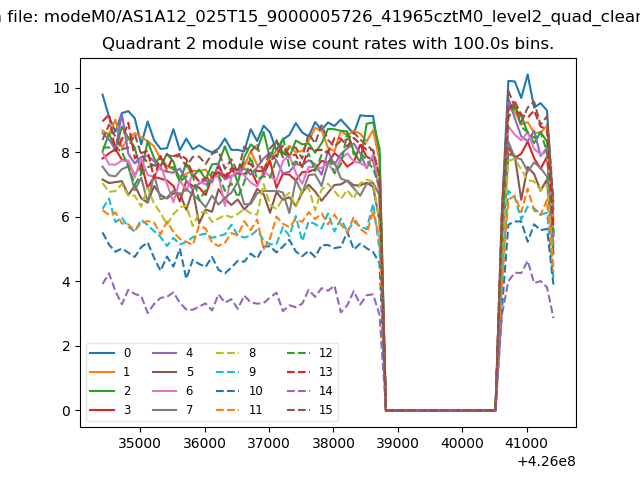
| Module-wise count rates for Quadrant B Data is divided into 100 sec bins |
 |
 |
| Module-wise count rates for Quadrant C Data is divided into 100 sec bins |
 |
 |
| Module-wise count rates for Quadrant D Data is divided into 100 sec bins |
 |
 |
| Parameter | Plot |
|---|---|
| CZT HV Monitor | 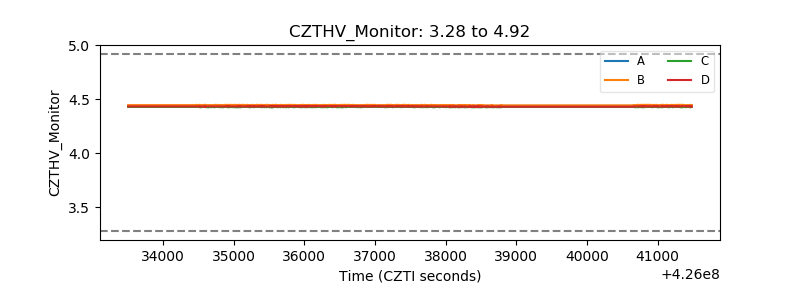 |
| D_VDD | 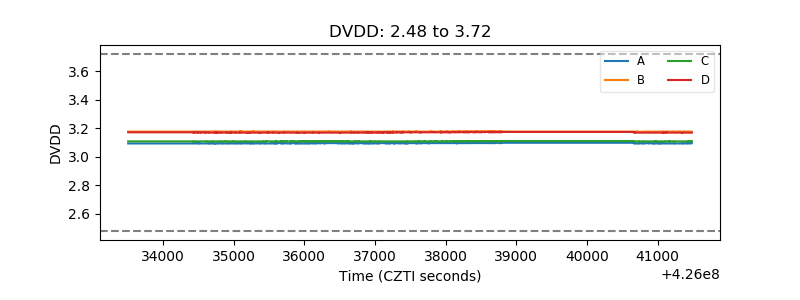 |
| Temperature 1 | 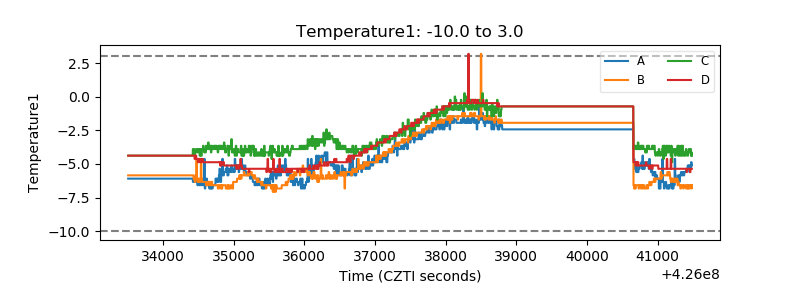 |
| Veto HV Monitor |  |
| Veto LLD | 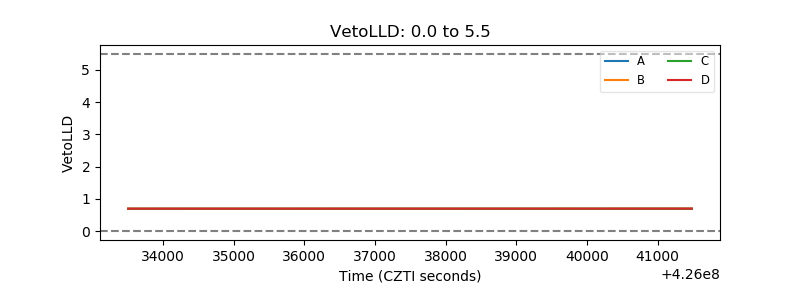 |
| Alpha Counter | 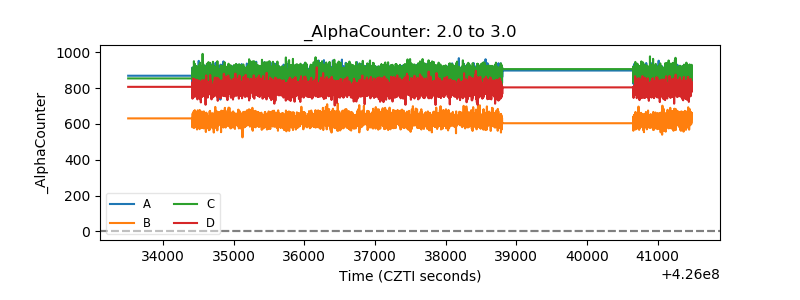 |
| _CPM_Rate | 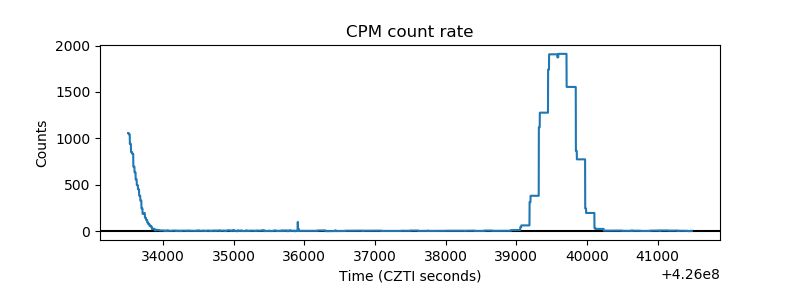 |
| CZT Counter | 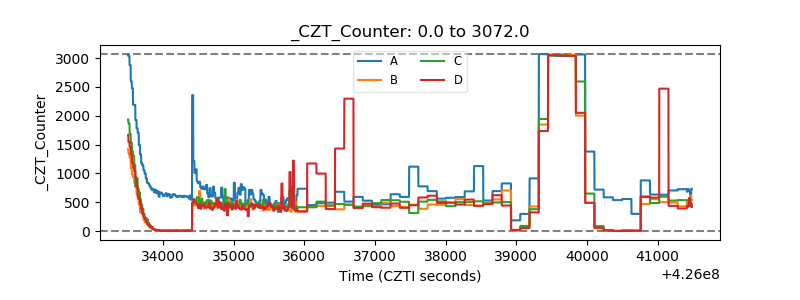 |
| +2.5 Volts monitor | 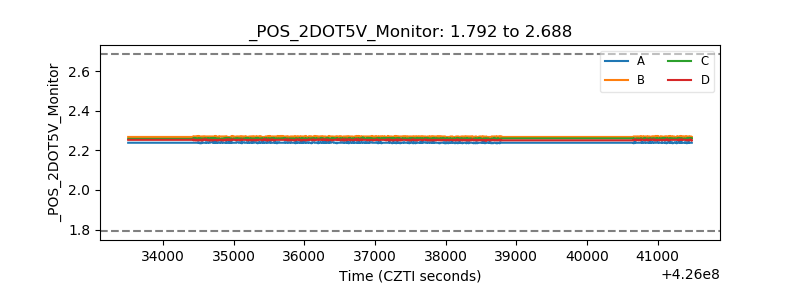 |
| +5 Volts monitor |  |
| _ROLL_ROT | 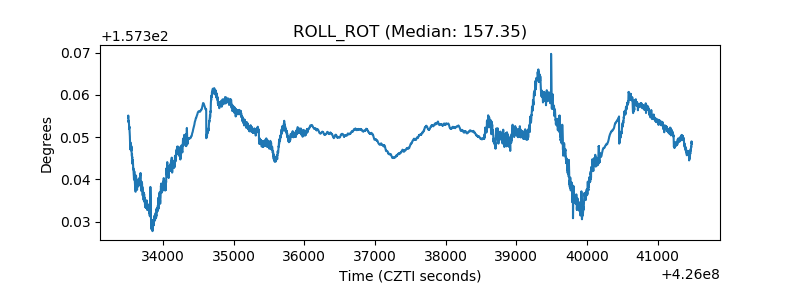 |
| _Roll_DEC | 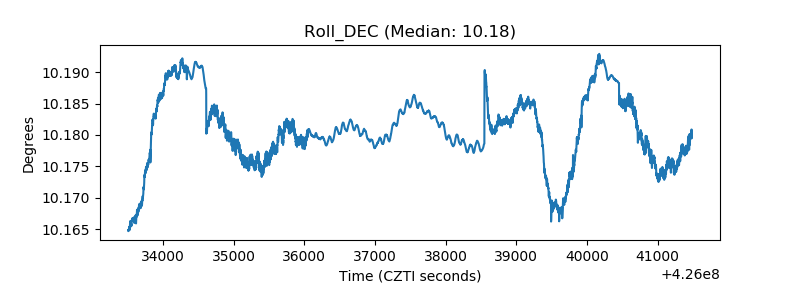 |
| _Roll_RA | 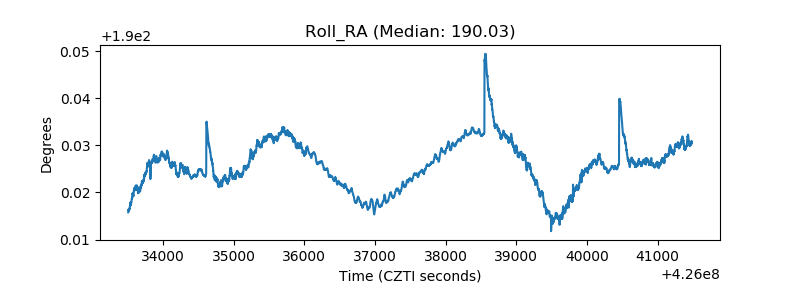 |
| Veto Counter | 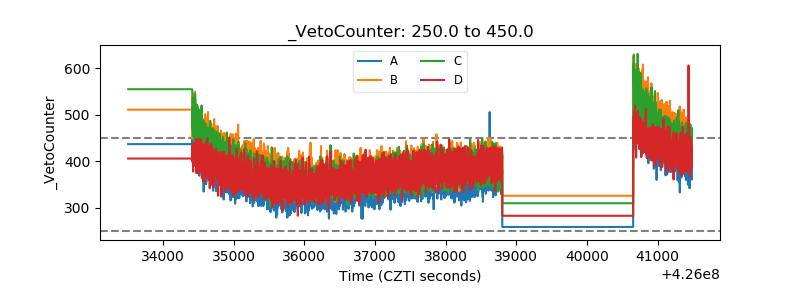 |