| Param | Original file | Final file |
|---|---|---|
| Filename | modeM0/AS1A12_025T15_9000005726_41966cztM0_level2.fits | modeM0/AS1A12_025T15_9000005726_41966cztM0_level2_quad_clean.evt |
| Size (bytes) | 325,131,840 | 94,872,960 |
| Size | 310.1 MB | 90.5 MB |
| Events in quadrant A | 3,202,337 | 649,446 |
| Events in quadrant B | 2,589,719 | 676,283 |
| Events in quadrant C | 2,608,016 | 623,043 |
| Events in quadrant D | 3,226,729 | 557,126 |
| Mode SS | |||
|---|---|---|---|
| Quadrant | BADHDUFLAG | Total packets | Discarded packets |
| A | 0 | 106 | 0 |
| B | 0 | 106 | 0 |
| C | 0 | 106 | 0 |
| D | 0 | 106 | 0 |
| Mode M9 | |||
|---|---|---|---|
| Quadrant | BADHDUFLAG | Total packets | Discarded packets |
| A | 0 | 29 | 0 |
| B | 0 | 30 | 0 |
| C | 0 | 30 | 0 |
| D | 0 | 30 | 0 |
| Mode M0 | |||
|---|---|---|---|
| Quadrant | BADHDUFLAG | Total packets | Discarded packets |
| A | 0 | 12904 | 3 |
| B | 0 | 10881 | 2 |
| C | 0 | 10642 | 2 |
| D | 0 | 13084 | 2 |
| Quadrant | Total seconds | Saturated seconds | Saturation percentage |
|---|---|---|---|
| A | 5243 | 14 | 0.267023% |
| B | 5243 | 7 | 0.133511% |
| C | 5243 | 3 | 0.057219% |
| D | 5243 | 199 | 3.795537% |
Noise dominated data is calculated using 1-second bins in cleaned event files. If a bin has >2000 counts, and if more than 50% of those come from <1% of pixels, then it is considered to be noise-dominated and hence unusable.
| Quadrant | # 1 sec bins | Bins with >0 counts | Bins with >2000 counts | High rate bins dominated by noise | Noise dominated (total time) | Noise dominated (detector-on time) | Marked lightcurve |
|---|---|---|---|---|---|---|---|
| A | 7247 | 5244 | 4 | 4 | 0.06% | 0.08% | 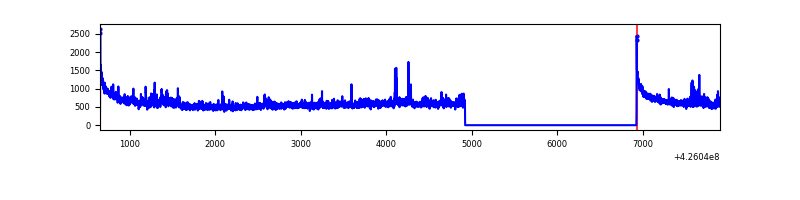 |
| B | 7247 | 5244 | 4 | 4 | 0.06% | 0.08% | 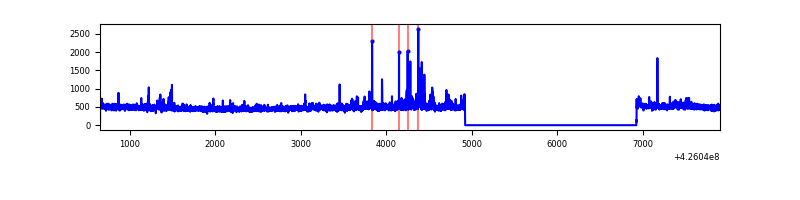 |
| C | 7247 | 5244 | 0 | 0 | 0.00% | 0.00% | 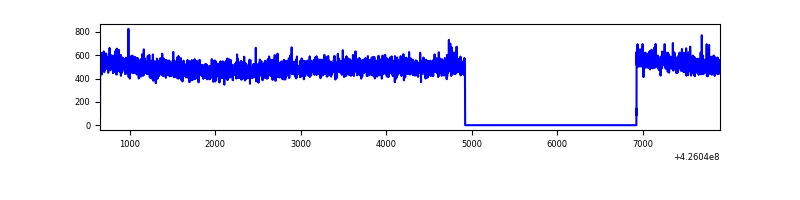 |
| D | 7247 | 5244 | 171 | 171 | 2.36% | 3.26% | 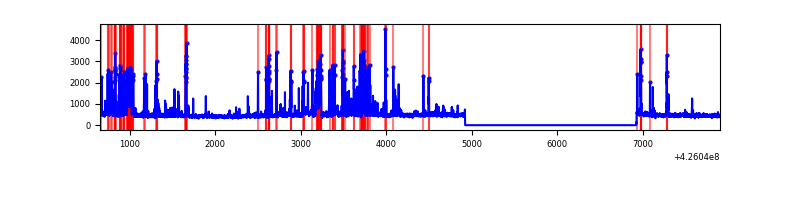 |
Top three noisy pixels from each quadrant. If the there are fewer than three noisy pixels in the level2.evt file, extra rows are filled as -1
| Pixel properties | Quadrant properties | ||||||
|---|---|---|---|---|---|---|---|
| Quadrant | DetID | PixID | Counts | Sigma | Mean | Median | Sigma |
| A | 10 | 83 | 543557 | 4273.6 | 627 | 616 | 127.0 |
| A | 2 | 79 | 184615 | 1448.29 | 627 | 616 | 127.0 |
| A | 14 | 250 | 34971 | 270.42 | 627 | 616 | 127.0 |
| B | 0 | 190 | 71335 | 591.36 | 626 | 611 | 119.6 |
| B | 5 | 255 | 39308 | 323.57 | 626 | 611 | 119.6 |
| B | 12 | 111 | 14779 | 118.47 | 626 | 611 | 119.6 |
| C | 15 | 214 | 231980 | 1651.68 | 604 | 609 | 140.1 |
| C | 9 | 54 | 15049 | 103.08 | 604 | 609 | 140.1 |
| C | 13 | 61 | 4154 | 25.31 | 604 | 609 | 140.1 |
| D | 13 | 249 | 535894 | 3674.59 | 593 | 575 | 145.7 |
| D | 12 | 6 | 187597 | 1283.78 | 593 | 575 | 145.7 |
| D | 12 | 250 | 68077 | 463.35 | 593 | 575 | 145.7 |
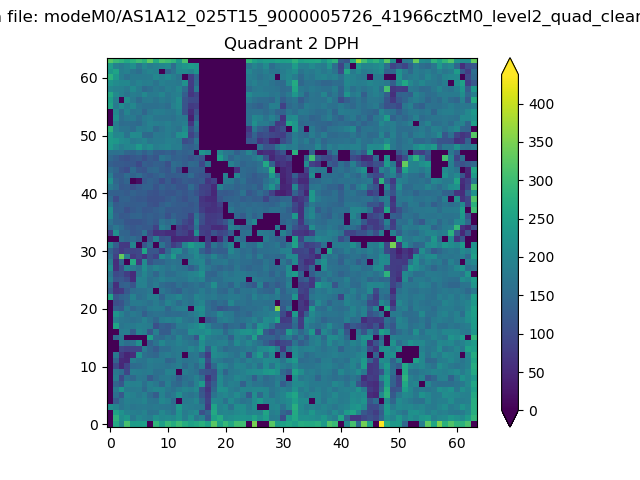
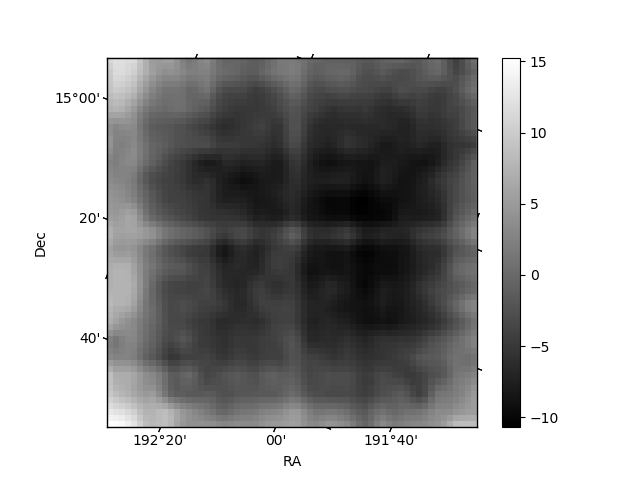
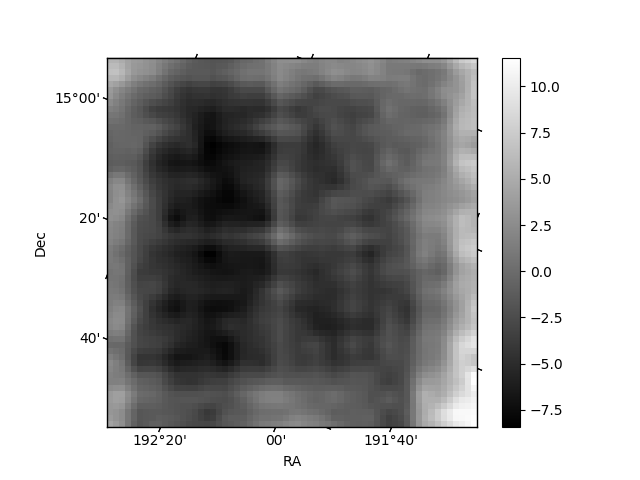
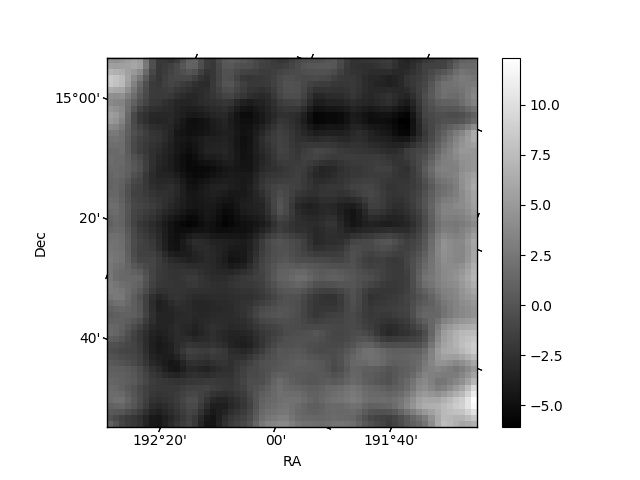
Histogram calculated using DETX and DETY for each event in the final _common_clean file
| Quadrant A | 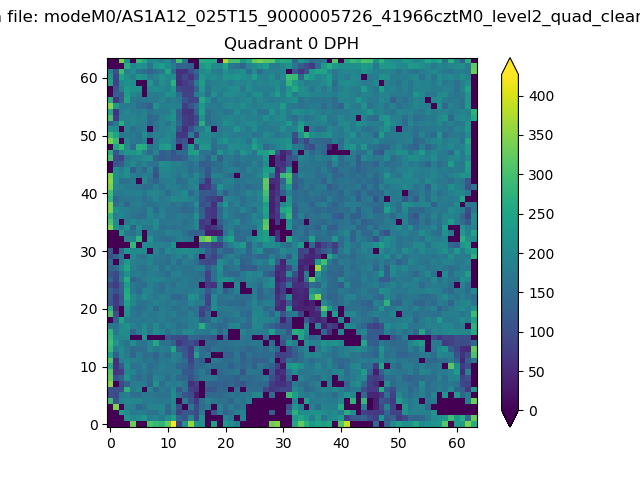 |
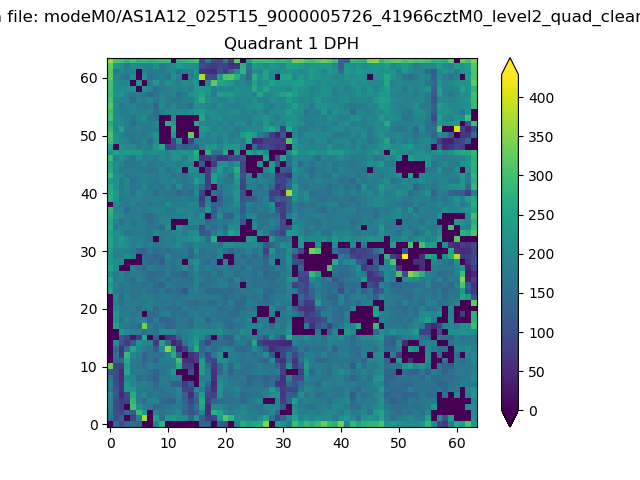 |
Quadrant B |
|---|---|---|---|
| Quadrant D | 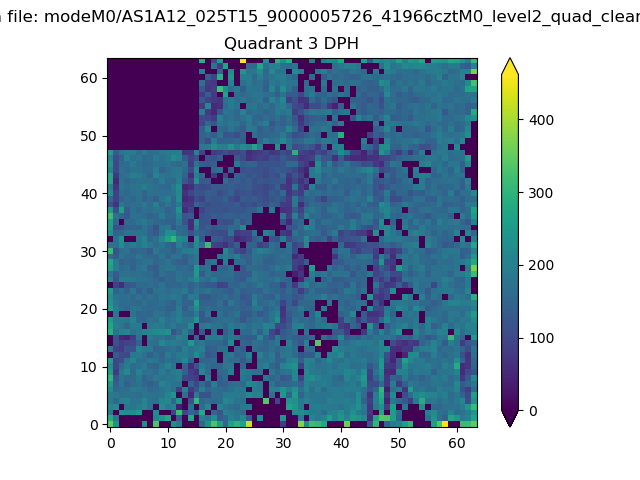 |
 |
Quadrant C |
| Plot type | Count rate plots | Images |
|---|---|---|
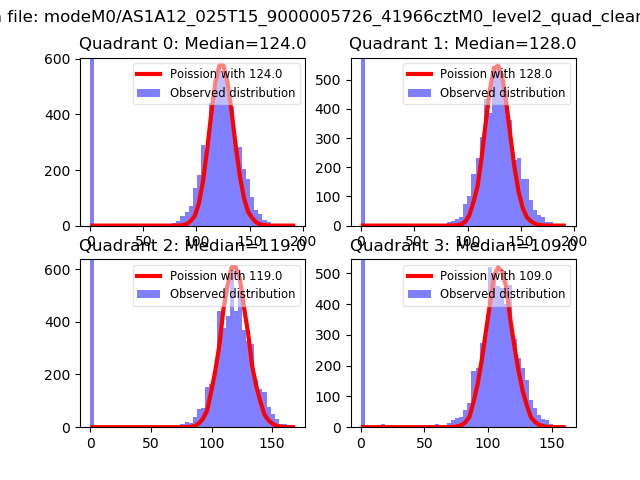
| Comparison with Poisson distribution Blue bars denote a histogram of data divided into 1 sec bins. Red curve is a Poisson curve with rate = median count rate of data. |
 |
 |
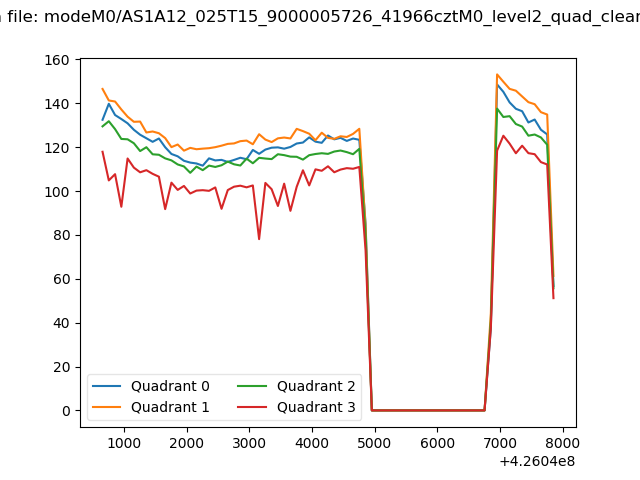
| Quadrant-wise count rates Data is divided into 100 sec bins |
 |
|
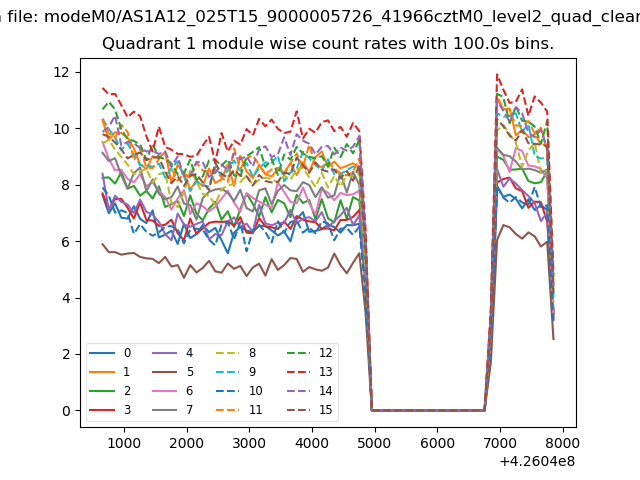
| Module-wise count rates for Quadrant A Data is divided into 100 sec bins |
 |
 |
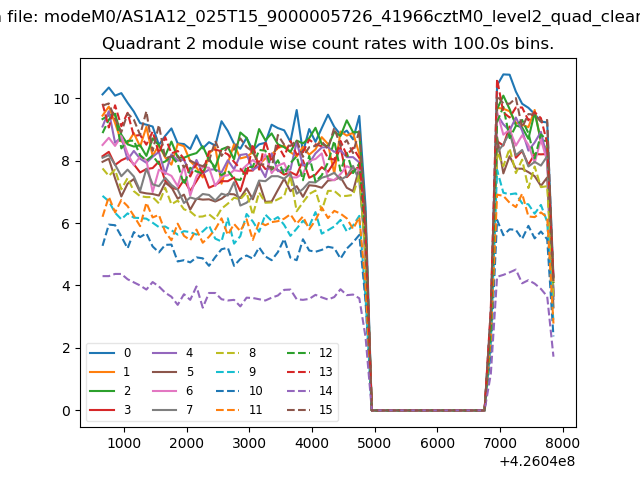
| Module-wise count rates for Quadrant B Data is divided into 100 sec bins |
 |
 |
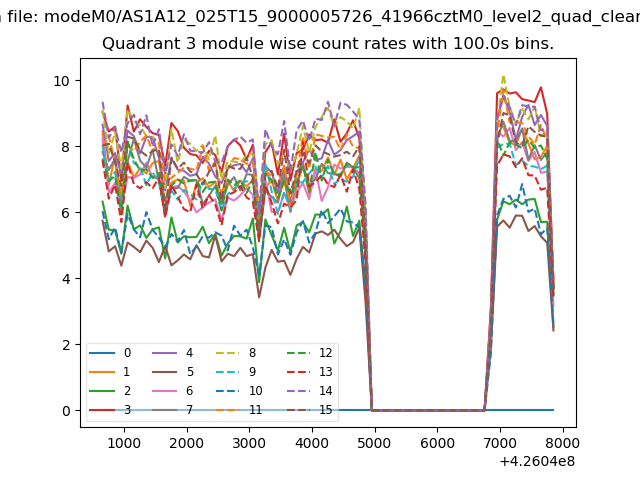
| Module-wise count rates for Quadrant C Data is divided into 100 sec bins |
 |
 |
| Module-wise count rates for Quadrant D Data is divided into 100 sec bins |
 |
 |
| Parameter | Plot |
|---|---|
| CZT HV Monitor | 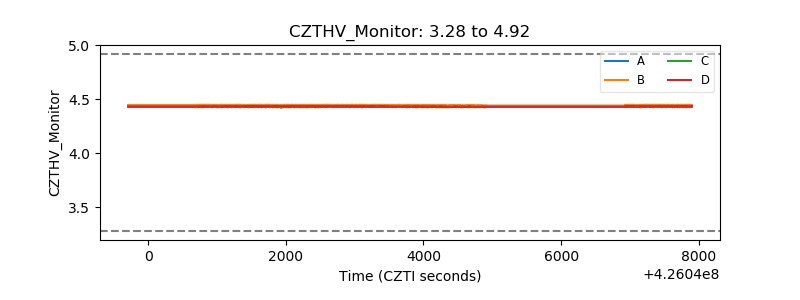 |
| D_VDD | 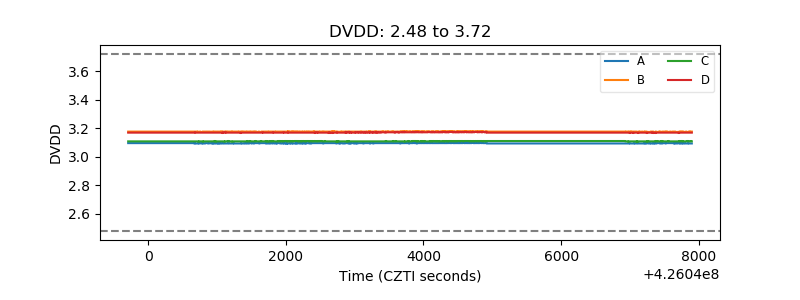 |
| Temperature 1 | 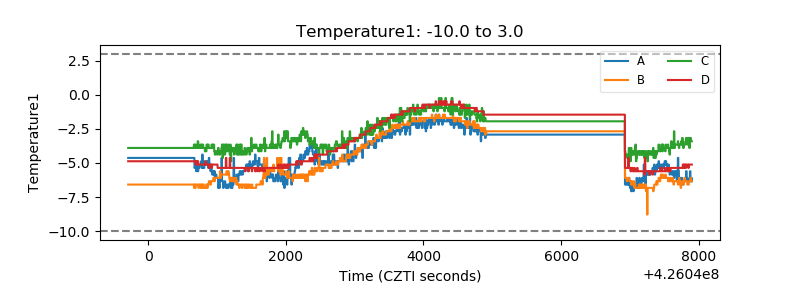 |
| Veto HV Monitor | 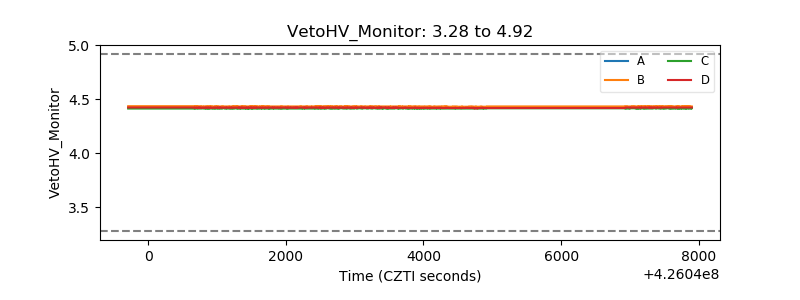 |
| Veto LLD | 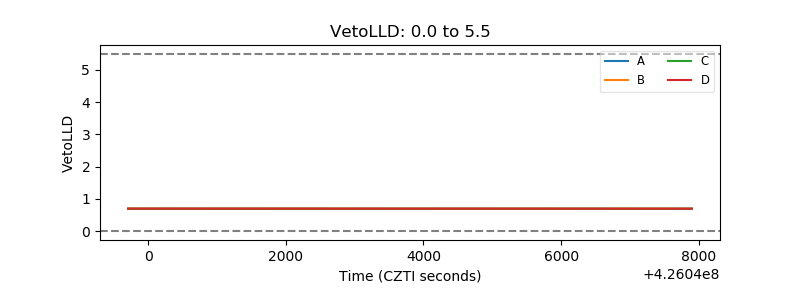 |
| Alpha Counter | 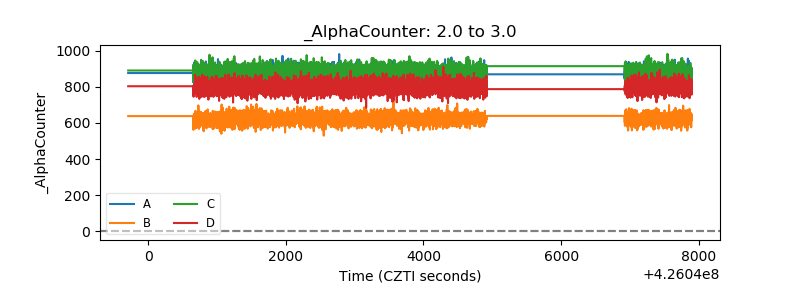 |
| _CPM_Rate | 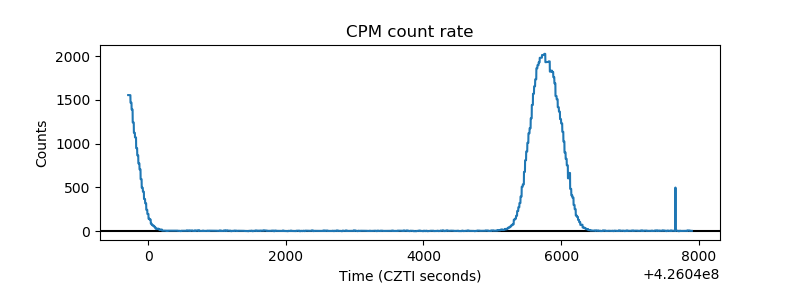 |
| CZT Counter | 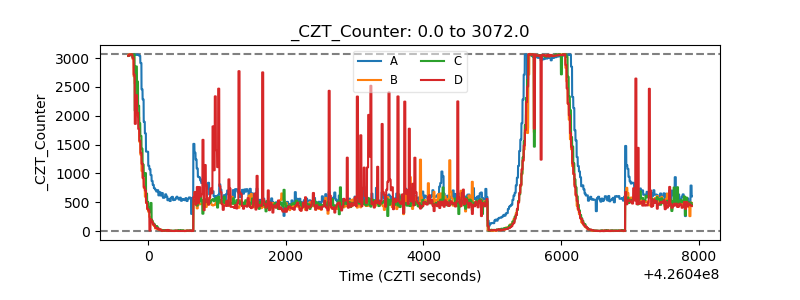 |
| +2.5 Volts monitor | 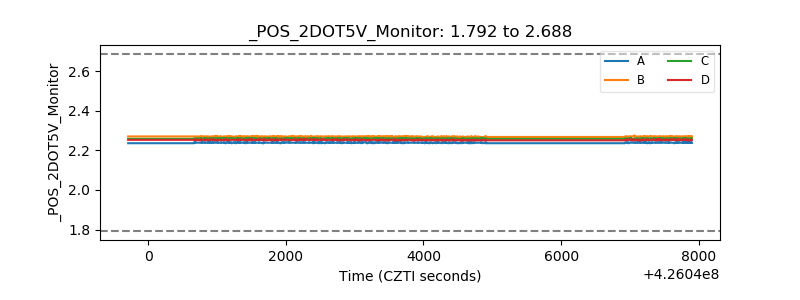 |
| +5 Volts monitor |  |
| _ROLL_ROT | 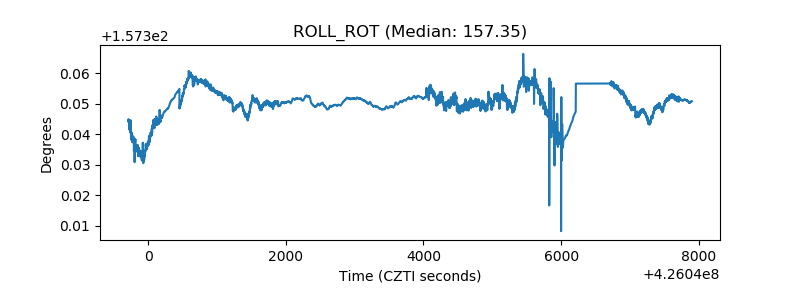 |
| _Roll_DEC | 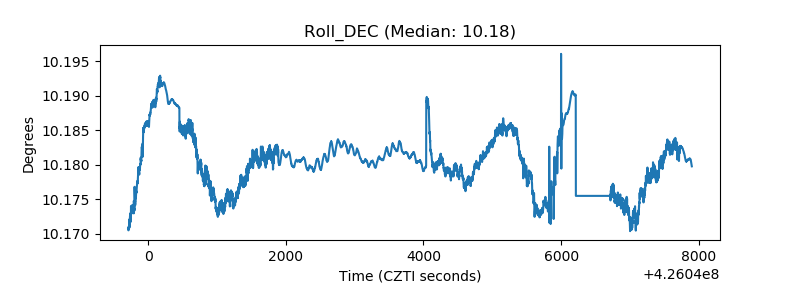 |
| _Roll_RA | 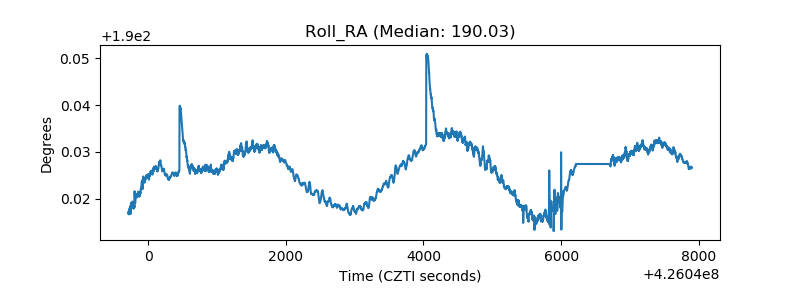 |
| Veto Counter | 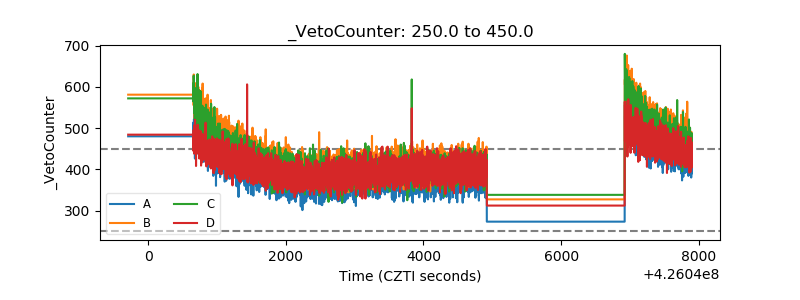 |