| Param | Original file | Final file |
|---|---|---|
| Filename | modeM0/AS1A12_025T15_9000005726_41967cztM0_level2.fits | modeM0/AS1A12_025T15_9000005726_41967cztM0_level2_quad_clean.evt |
| Size (bytes) | 320,616,000 | 94,455,360 |
| Size | 305.8 MB | 90.1 MB |
| Events in quadrant A | 3,272,280 | 649,040 |
| Events in quadrant B | 2,606,752 | 675,757 |
| Events in quadrant C | 2,591,042 | 622,505 |
| Events in quadrant D | 3,001,456 | 556,715 |
| Mode SS | |||
|---|---|---|---|
| Quadrant | BADHDUFLAG | Total packets | Discarded packets |
| A | 0 | 102 | 0 |
| B | 0 | 102 | 0 |
| C | 0 | 102 | 0 |
| D | 0 | 102 | 0 |
| Mode M9 | |||
|---|---|---|---|
| Quadrant | BADHDUFLAG | Total packets | Discarded packets |
| A | 0 | 22 | 0 |
| B | 0 | 23 | 0 |
| C | 0 | 23 | 0 |
| D | 0 | 23 | 0 |
| Mode M0 | |||
|---|---|---|---|
| Quadrant | BADHDUFLAG | Total packets | Discarded packets |
| A | 0 | 13085 | 2 |
| B | 0 | 10740 | 2 |
| C | 0 | 10369 | 2 |
| D | 0 | 12239 | 2 |
| Quadrant | Total seconds | Saturated seconds | Saturation percentage |
|---|---|---|---|
| A | 5089 | 12 | 0.235803% |
| B | 5089 | 11 | 0.216152% |
| C | 5089 | 2 | 0.039300% |
| D | 5089 | 142 | 2.790332% |
Noise dominated data is calculated using 1-second bins in cleaned event files. If a bin has >2000 counts, and if more than 50% of those come from <1% of pixels, then it is considered to be noise-dominated and hence unusable.
| Quadrant | # 1 sec bins | Bins with >0 counts | Bins with >2000 counts | High rate bins dominated by noise | Noise dominated (total time) | Noise dominated (detector-on time) | Marked lightcurve |
|---|---|---|---|---|---|---|---|
| A | 7182 | 5090 | 3 | 3 | 0.04% | 0.06% | 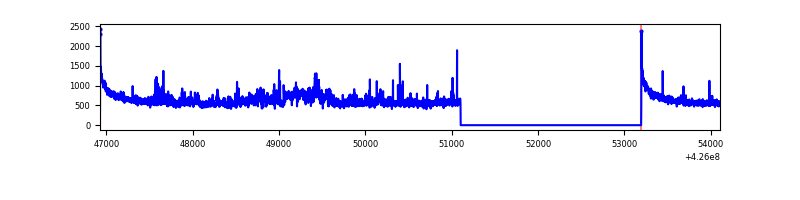 |
| B | 7182 | 5090 | 2 | 2 | 0.03% | 0.04% | 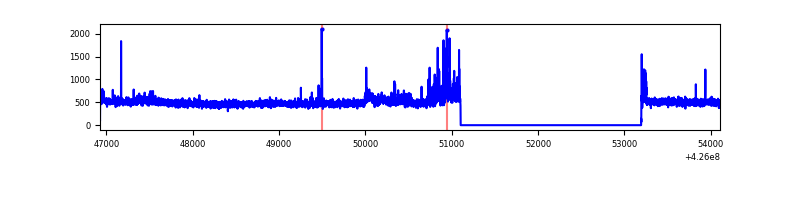 |
| C | 7182 | 5090 | 0 | 0 | 0.00% | 0.00% | 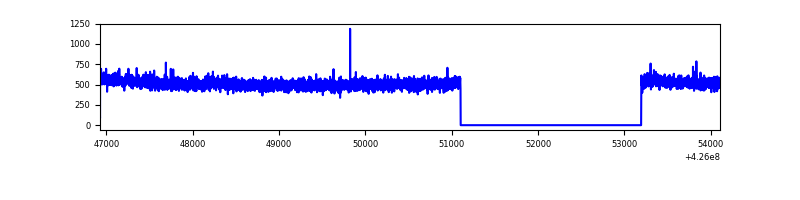 |
| D | 7182 | 5090 | 112 | 112 | 1.56% | 2.20% | 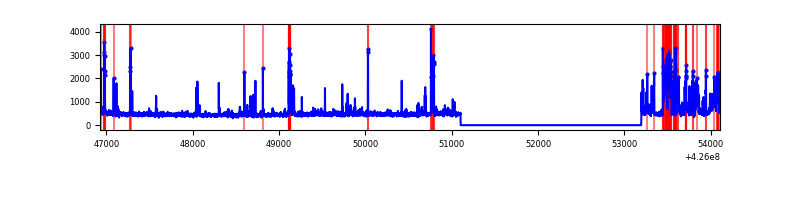 |
Top three noisy pixels from each quadrant. If the there are fewer than three noisy pixels in the level2.evt file, extra rows are filled as -1
| Pixel properties | Quadrant properties | ||||||
|---|---|---|---|---|---|---|---|
| Quadrant | DetID | PixID | Counts | Sigma | Mean | Median | Sigma |
| A | 10 | 83 | 535347 | 4208.41 | 624 | 614 | 127.1 |
| A | 2 | 79 | 284151 | 2231.47 | 624 | 614 | 127.1 |
| A | 14 | 250 | 31324 | 241.69 | 624 | 614 | 127.1 |
| B | 0 | 190 | 132988 | 1121.2 | 621 | 605 | 118.1 |
| B | 0 | 186 | 32458 | 269.77 | 621 | 605 | 118.1 |
| B | 12 | 111 | 14384 | 116.7 | 621 | 605 | 118.1 |
| C | 15 | 214 | 225408 | 1618.8 | 598 | 604 | 138.9 |
| C | 9 | 54 | 31553 | 222.86 | 598 | 604 | 138.9 |
| C | 13 | 61 | 4147 | 25.51 | 598 | 604 | 138.9 |
| D | 13 | 249 | 556735 | 3857.22 | 591 | 575 | 144.2 |
| D | 12 | 6 | 91036 | 627.39 | 591 | 575 | 144.2 |
| D | 2 | 249 | 29853 | 203.05 | 591 | 575 | 144.2 |
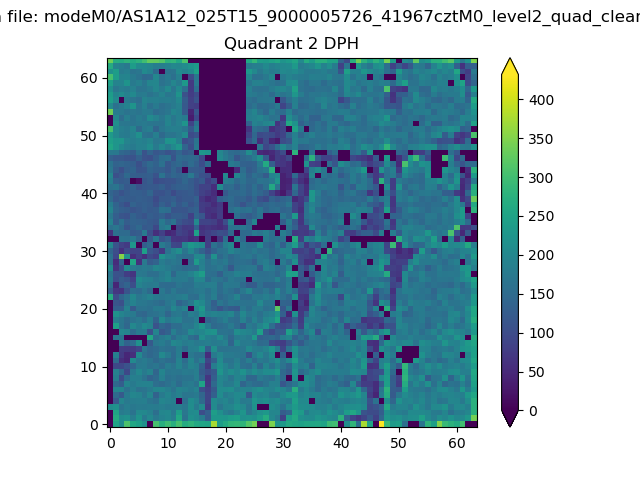
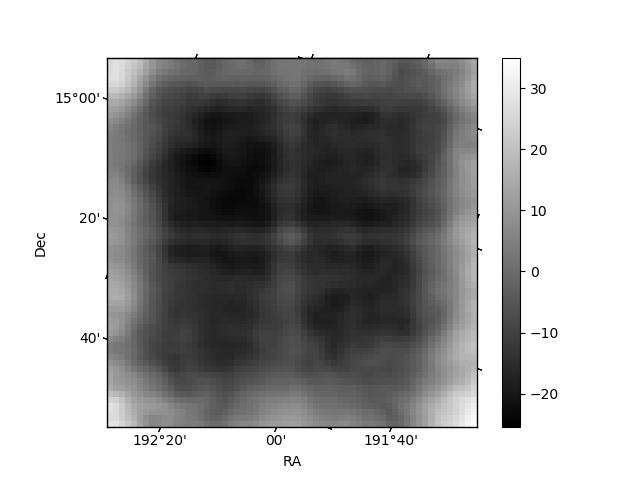
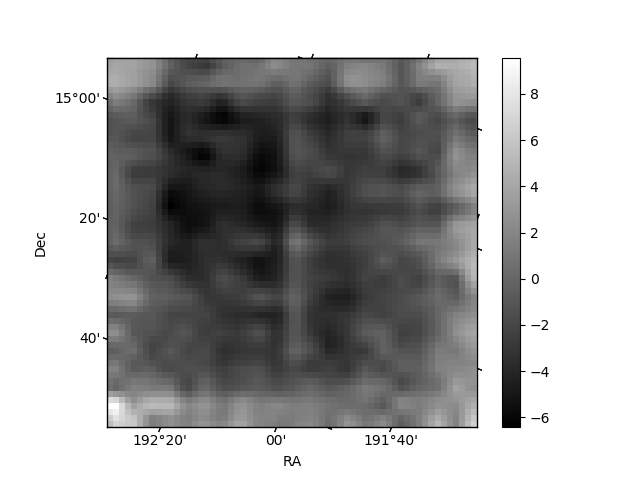
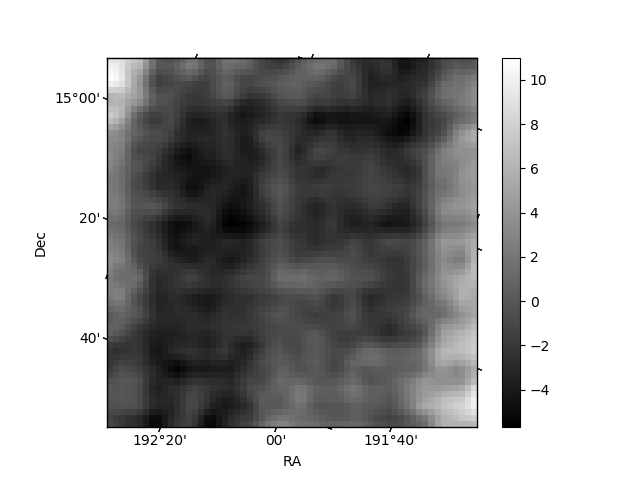
Histogram calculated using DETX and DETY for each event in the final _common_clean file
| Quadrant A | 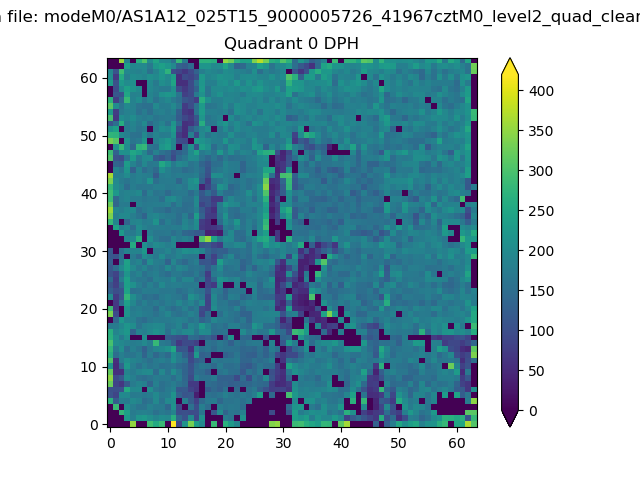 |
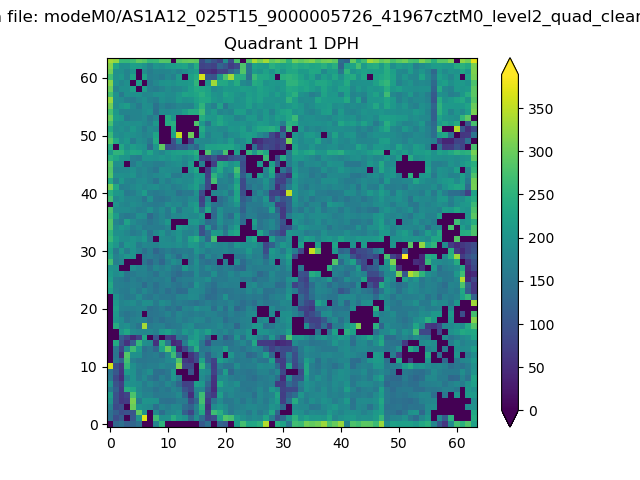 |
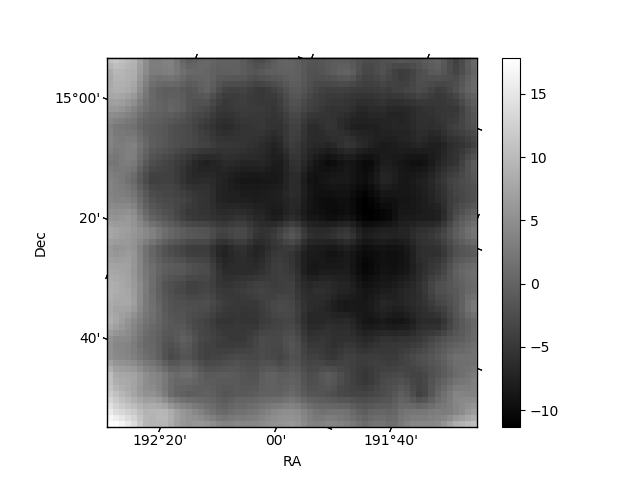
Quadrant B |
|---|---|---|---|
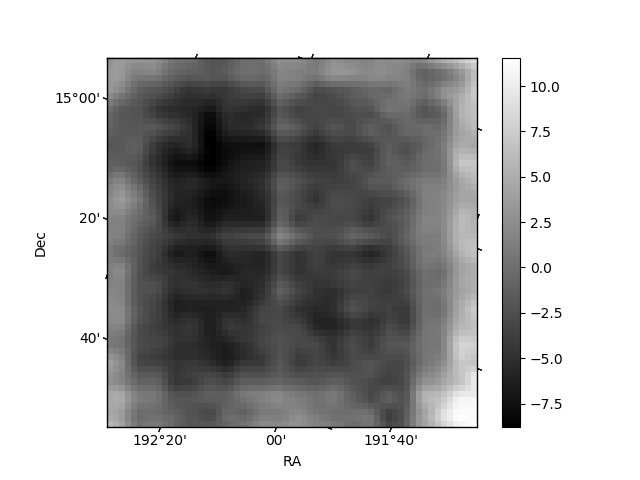
| Quadrant D | 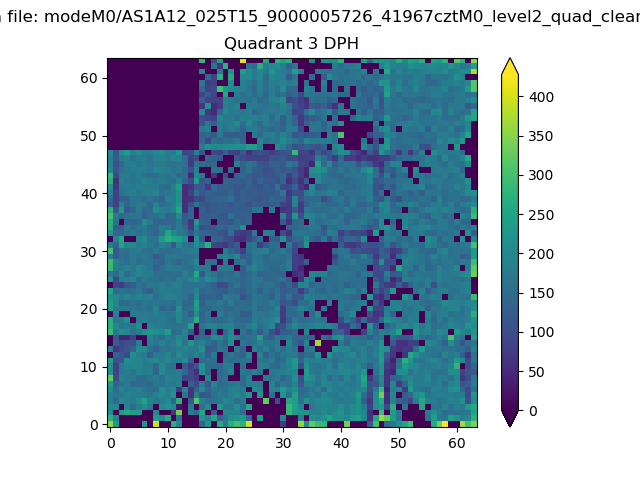 |
 |
Quadrant C |
| Plot type | Count rate plots | Images |
|---|---|---|
| Comparison with Poisson distribution Blue bars denote a histogram of data divided into 1 sec bins. Red curve is a Poisson curve with rate = median count rate of data. |
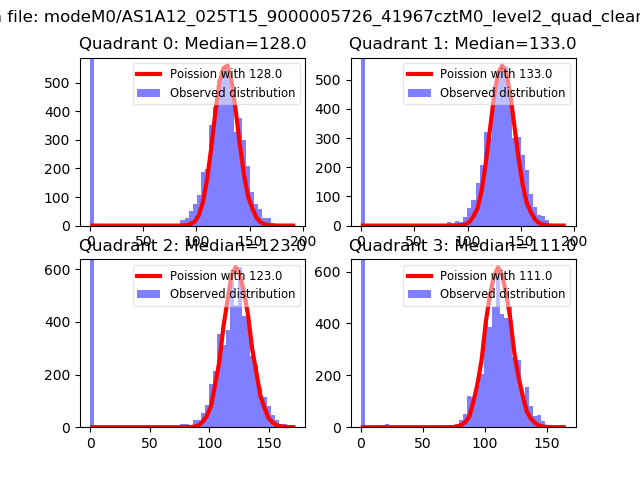 |
 |
| Quadrant-wise count rates Data is divided into 100 sec bins |
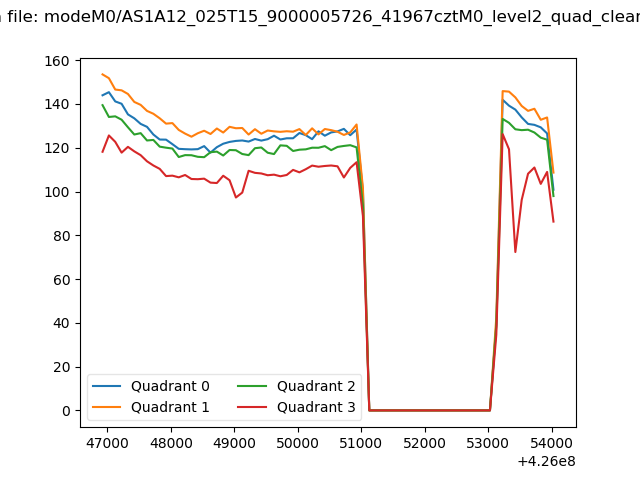 |
|
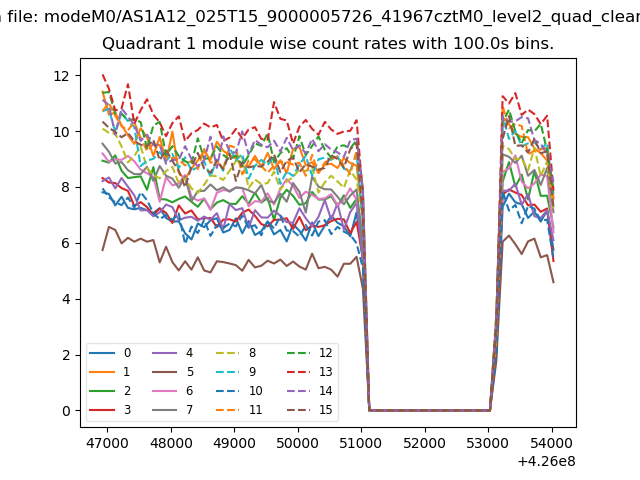
| Module-wise count rates for Quadrant A Data is divided into 100 sec bins |
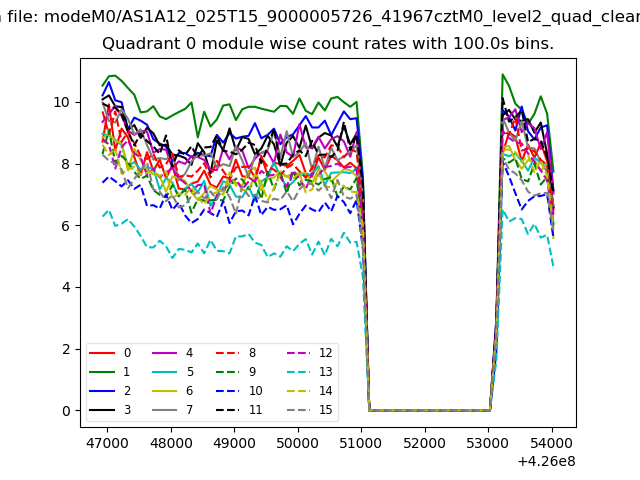 |
 |
| Module-wise count rates for Quadrant B Data is divided into 100 sec bins |
 |
 |
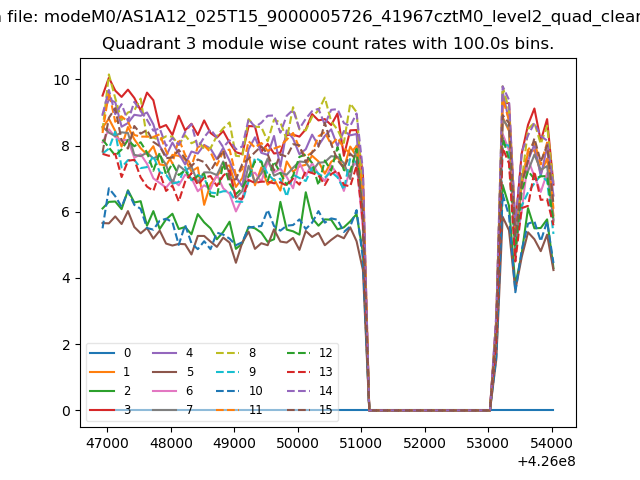
| Module-wise count rates for Quadrant C Data is divided into 100 sec bins |
 |
 |
| Module-wise count rates for Quadrant D Data is divided into 100 sec bins |
 |
 |
| Parameter | Plot |
|---|---|
| CZT HV Monitor | 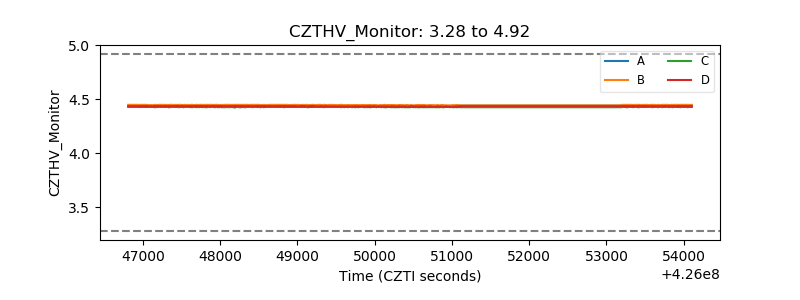 |
| D_VDD | 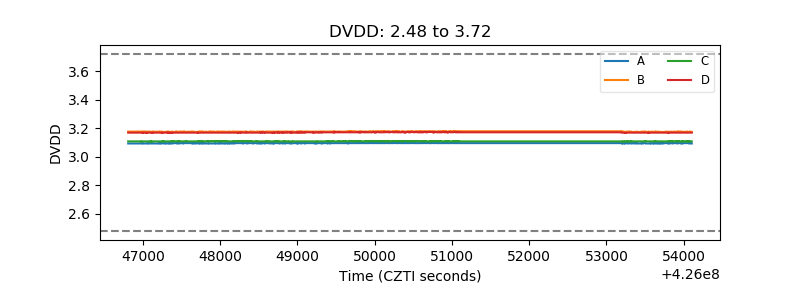 |
| Temperature 1 | 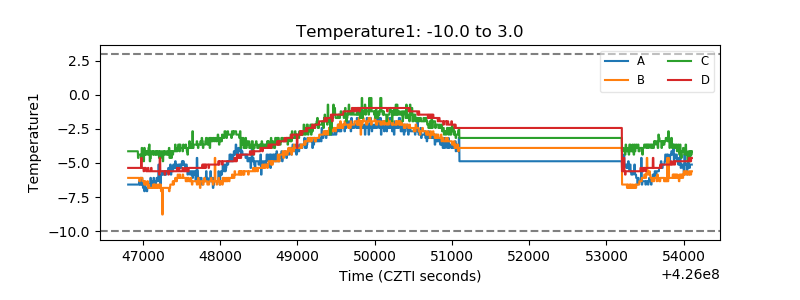 |
| Veto HV Monitor | 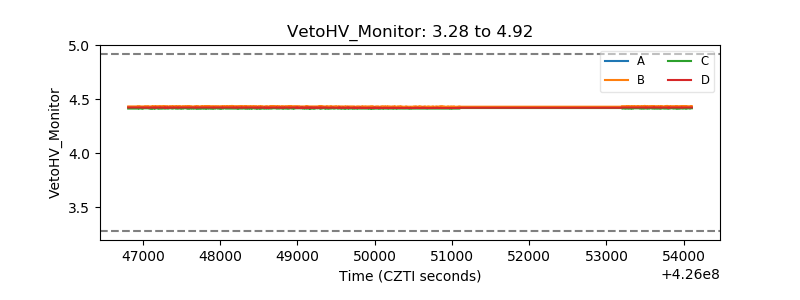 |
| Veto LLD | 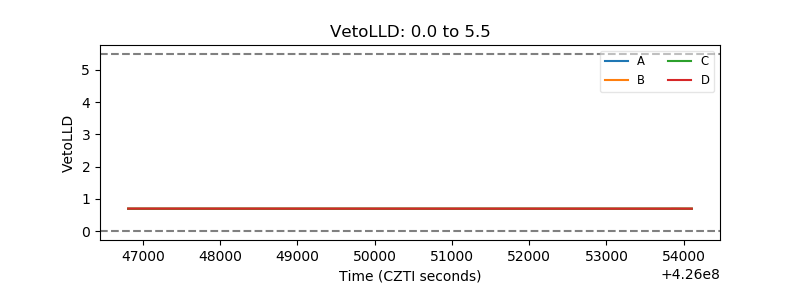 |
| Alpha Counter | 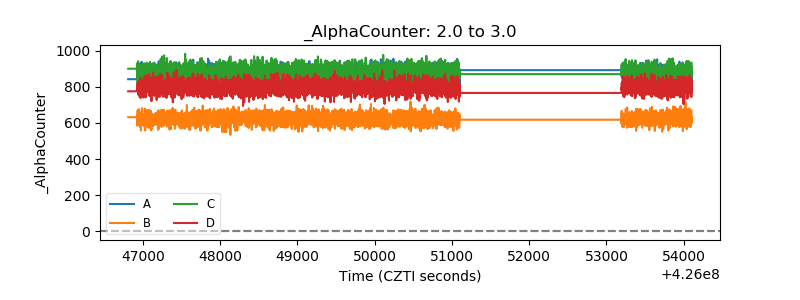 |
| _CPM_Rate | 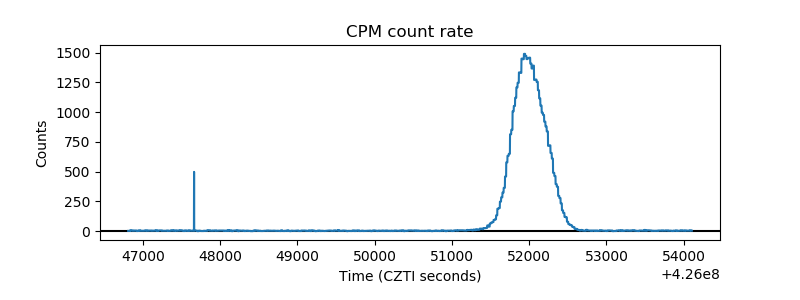 |
| CZT Counter | 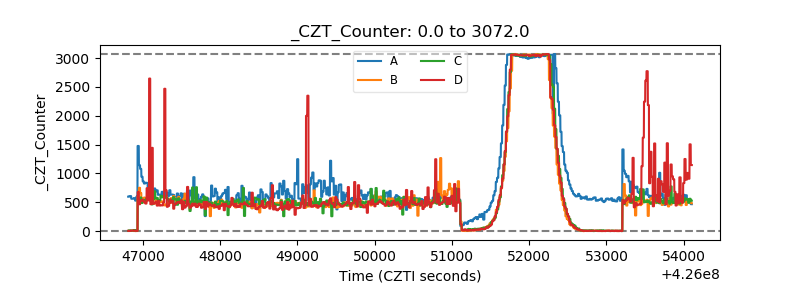 |
| +2.5 Volts monitor |  |
| +5 Volts monitor |  |
| _ROLL_ROT | 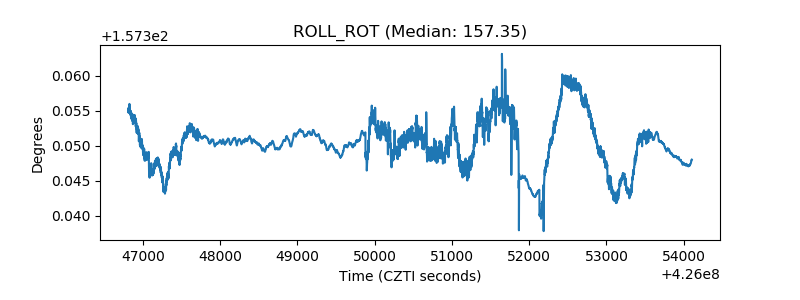 |
| _Roll_DEC | 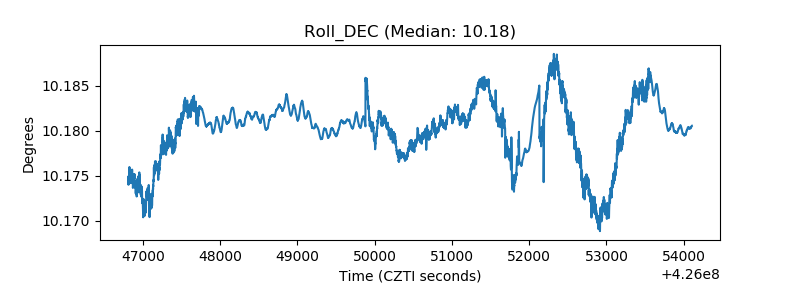 |
| _Roll_RA | 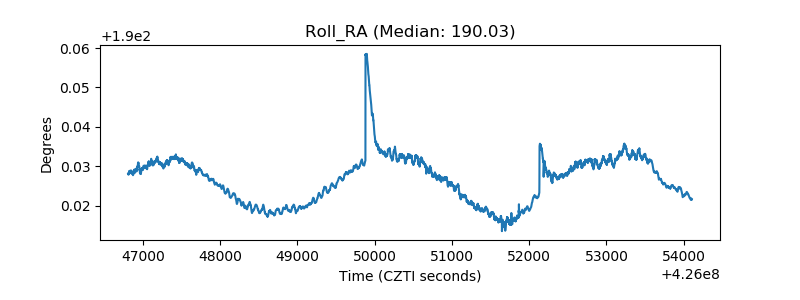 |
| Veto Counter | 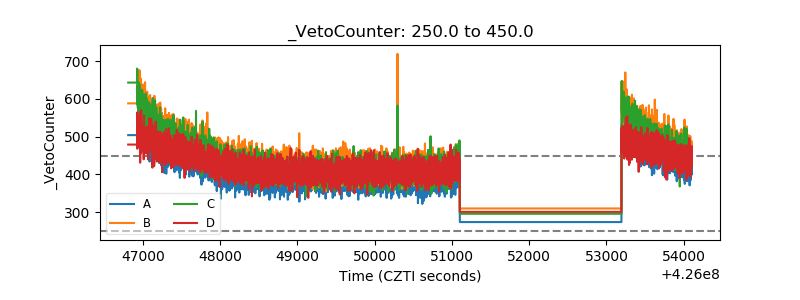 |