| Param | Original file | Final file |
|---|---|---|
| Filename | modeM0/AS1A12_025T15_9000005726_41969cztM0_level2.fits | modeM0/AS1A12_025T15_9000005726_41969cztM0_level2_quad_clean.evt |
| Size (bytes) | 312,096,960 | 87,134,400 |
| Size | 297.6 MB | 83.1 MB |
| Events in quadrant A | 2,868,741 | 596,358 |
| Events in quadrant B | 2,580,164 | 614,591 |
| Events in quadrant C | 2,474,310 | 573,615 |
| Events in quadrant D | 3,240,582 | 504,064 |
Noise dominated data is calculated using 1-second bins in cleaned event files. If a bin has >2000 counts, and if more than 50% of those come from <1% of pixels, then it is considered to be noise-dominated and hence unusable.
| Quadrant | # 1 sec bins | Bins with >0 counts | Bins with >2000 counts | High rate bins dominated by noise | Noise dominated (total time) | Noise dominated (detector-on time) | Marked lightcurve |
|---|---|---|---|---|---|---|---|
| A | 7083 | 4991 | 6 | 6 | 0.08% | 0.12% | 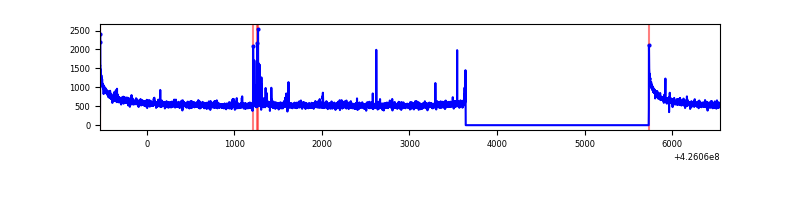 |
| B | 7083 | 4991 | 4 | 4 | 0.06% | 0.08% | 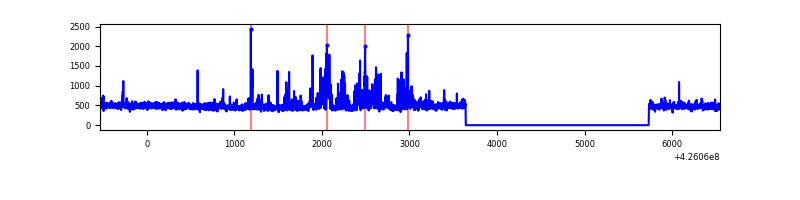 |
| C | 7083 | 4991 | 3 | 3 | 0.04% | 0.06% | 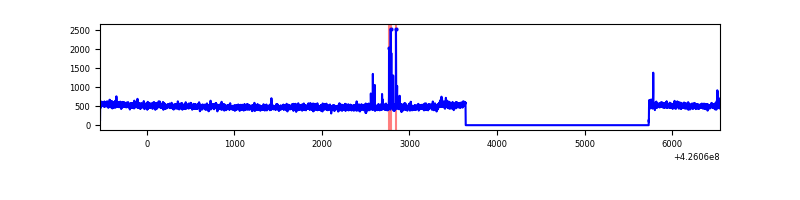 |
| D | 7083 | 4991 | 260 | 260 | 3.67% | 5.21% | 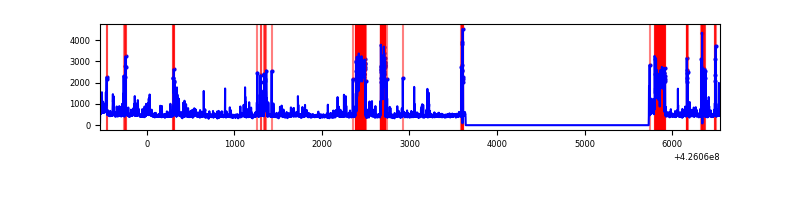 |
Top three noisy pixels from each quadrant. If the there are fewer than three noisy pixels in the level2.evt file, extra rows are filled as -1
| Pixel properties | Quadrant properties | ||||||
|---|---|---|---|---|---|---|---|
| Quadrant | DetID | PixID | Counts | Sigma | Mean | Median | Sigma |
| A | 10 | 83 | 534452 | 4478.7 | 584 | 573 | 119.2 |
| A | 14 | 250 | 50378 | 417.81 | 584 | 573 | 119.2 |
| A | 2 | 79 | 14855 | 119.81 | 584 | 573 | 119.2 |
| B | 0 | 190 | 279907 | 2478.2 | 577 | 561 | 112.7 |
| B | 5 | 255 | 28422 | 247.17 | 577 | 561 | 112.7 |
| B | 12 | 111 | 13778 | 117.25 | 577 | 561 | 112.7 |
| C | 15 | 214 | 223497 | 1697.51 | 563 | 568 | 131.3 |
| C | 8 | 79 | 26040 | 193.96 | 563 | 568 | 131.3 |
| C | 15 | 111 | 21935 | 162.7 | 563 | 568 | 131.3 |
| D | 13 | 249 | 493317 | 3627.33 | 551 | 535 | 135.9 |
| D | 10 | 199 | 427153 | 3140.3 | 551 | 535 | 135.9 |
| D | 2 | 249 | 111031 | 813.35 | 551 | 535 | 135.9 |
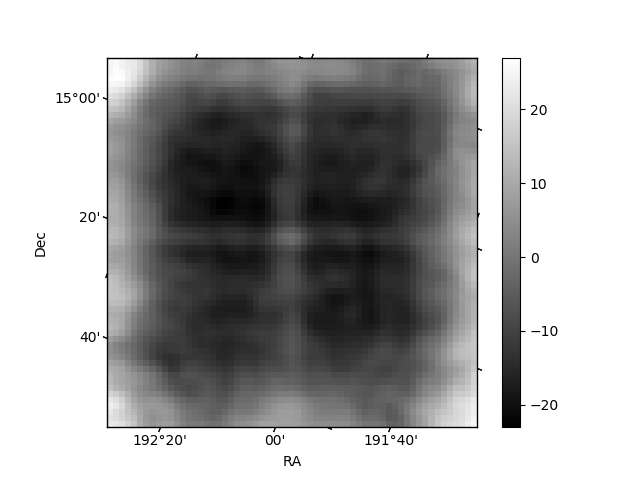
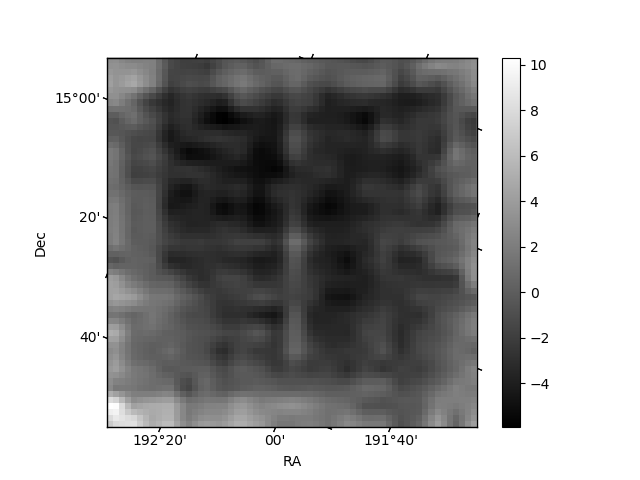
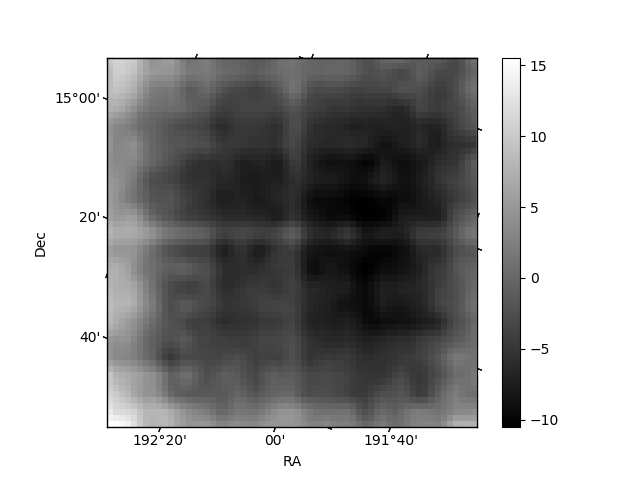
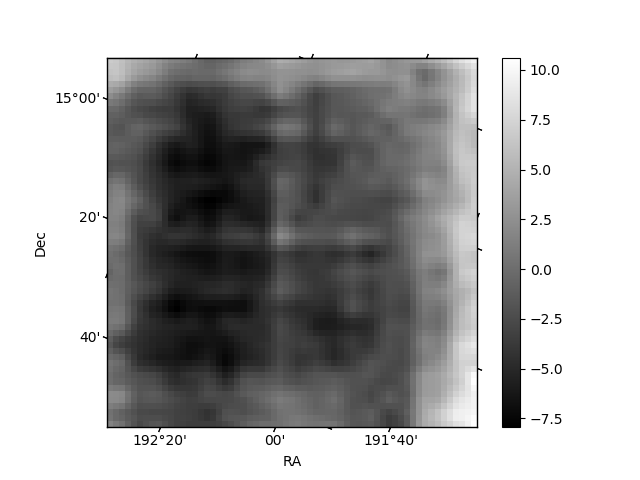
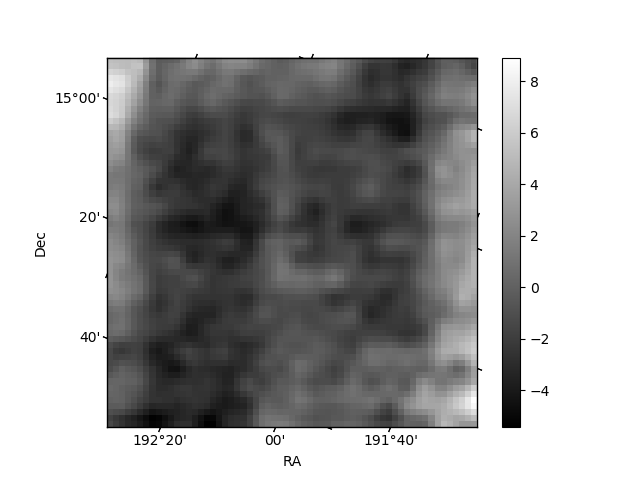
Histogram calculated using DETX and DETY for each event in the final _common_clean file
| Quadrant A | 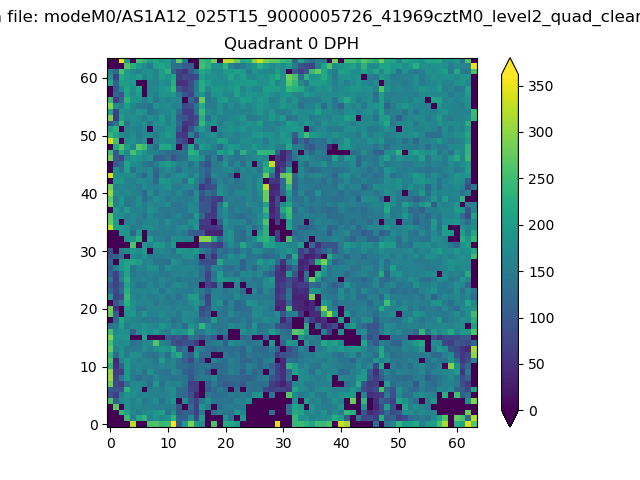 |
 |
Quadrant B |
|---|---|---|---|
| Quadrant D | 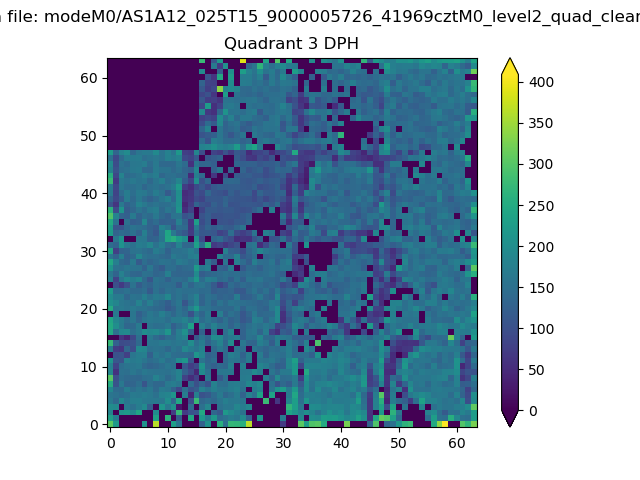 |
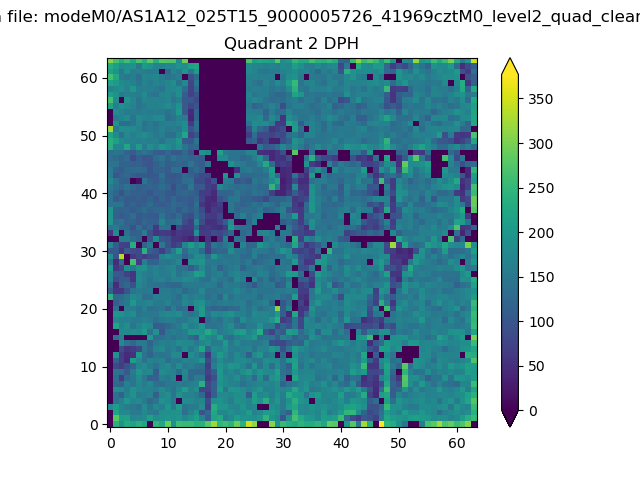 |
Quadrant C |
| Plot type | Count rate plots | Images |
|---|---|---|
| Comparison with Poisson distribution Blue bars denote a histogram of data divided into 1 sec bins. Red curve is a Poisson curve with rate = median count rate of data. |
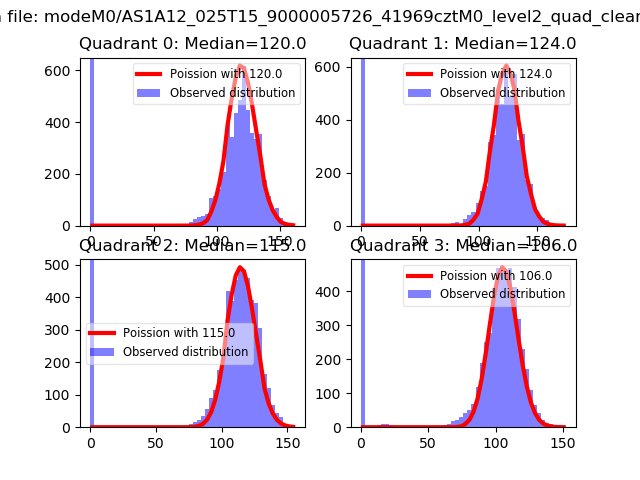 |
 |
| Quadrant-wise count rates Data is divided into 100 sec bins |
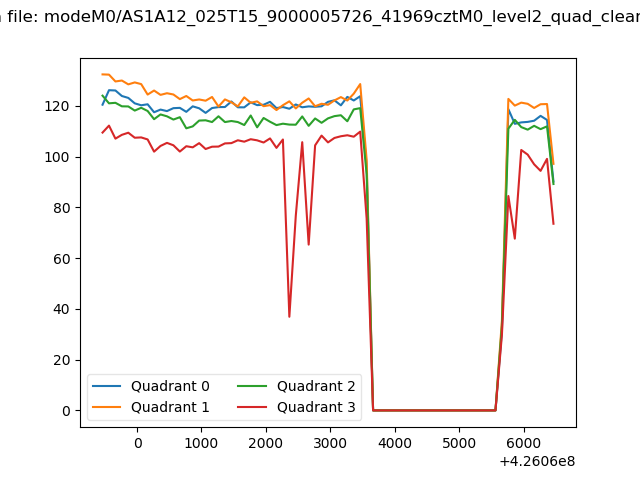 |
|
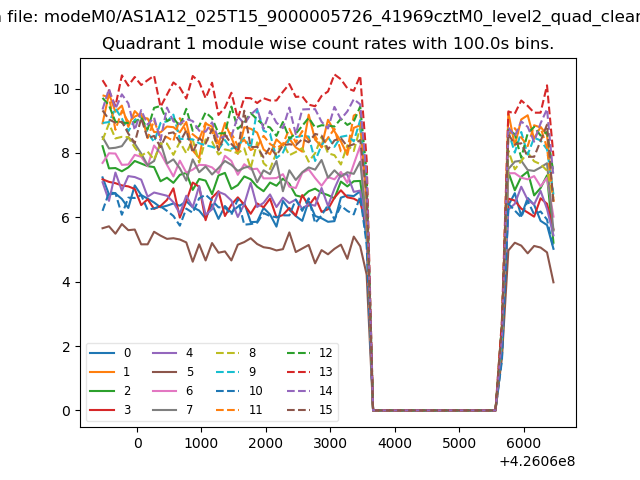
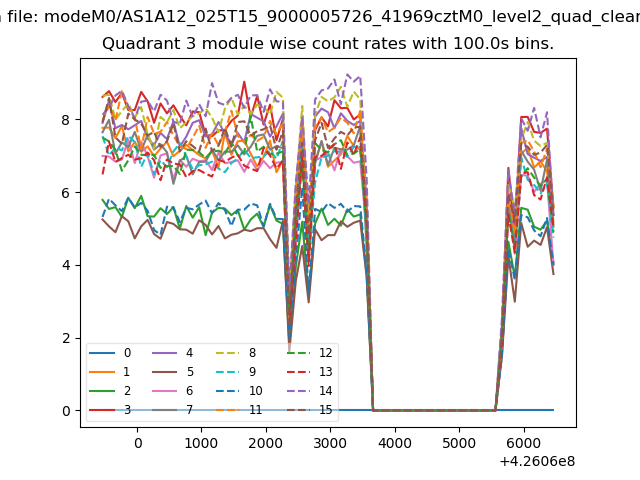
| Module-wise count rates for Quadrant A Data is divided into 100 sec bins |
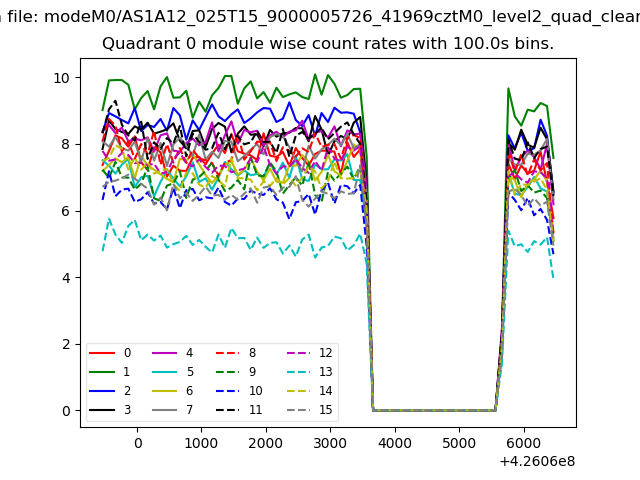 |
 |
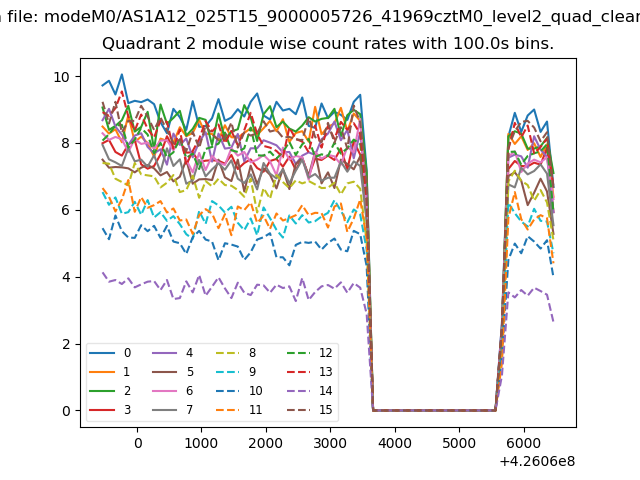
| Module-wise count rates for Quadrant B Data is divided into 100 sec bins |
 |
 |
| Module-wise count rates for Quadrant C Data is divided into 100 sec bins |
 |
 |
| Module-wise count rates for Quadrant D Data is divided into 100 sec bins |
 |
 |
| Parameter | Plot |
|---|---|
| CZT HV Monitor | 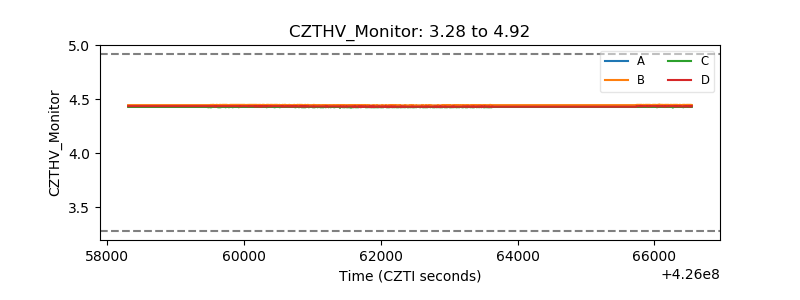 |
| D_VDD | 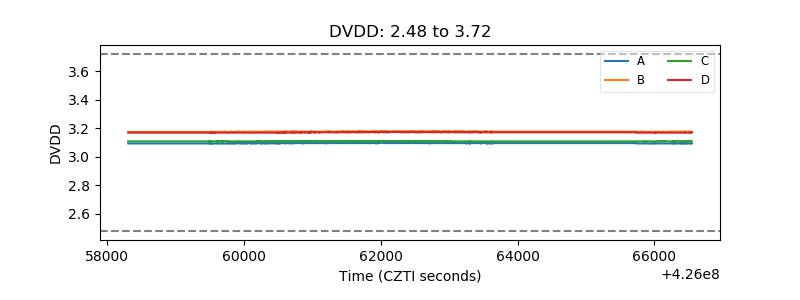 |
| Temperature 1 | 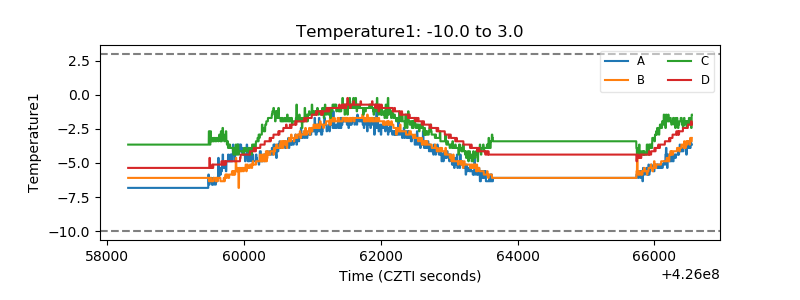 |
| Veto HV Monitor | 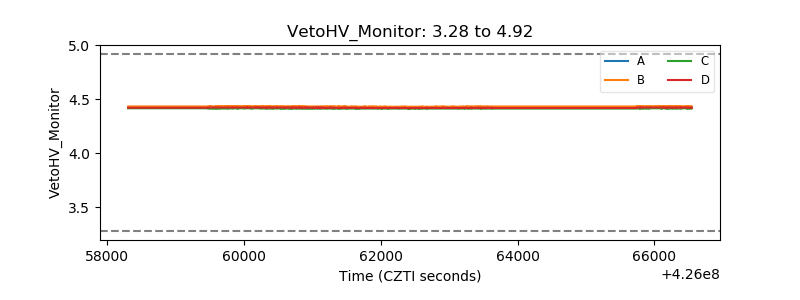 |
| Veto LLD | 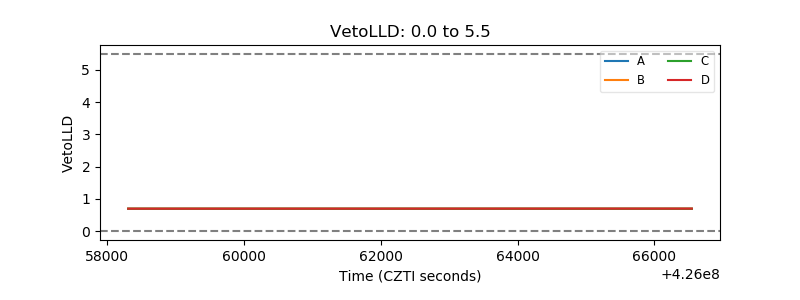 |
| Alpha Counter | 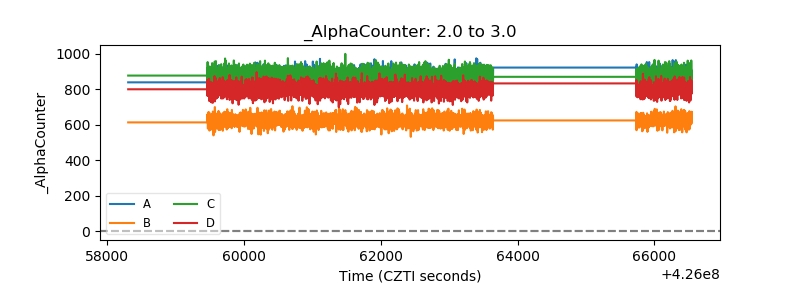 |
| _CPM_Rate | 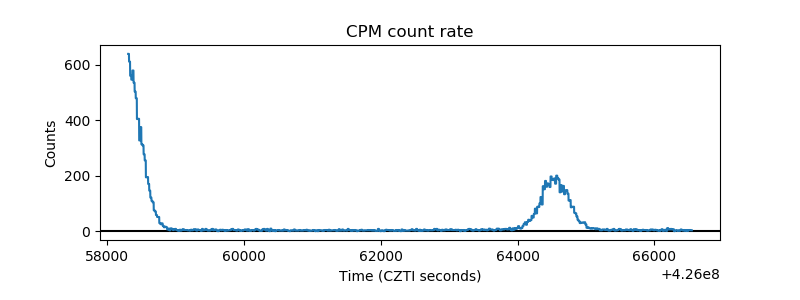 |
| CZT Counter | 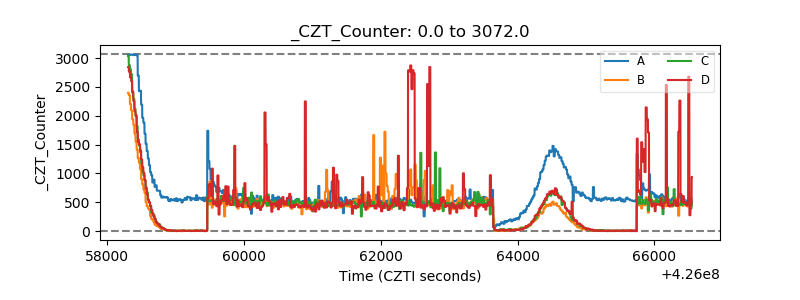 |
| +2.5 Volts monitor | 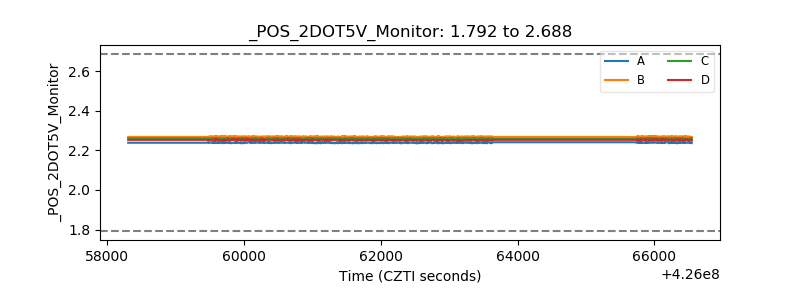 |
| +5 Volts monitor | 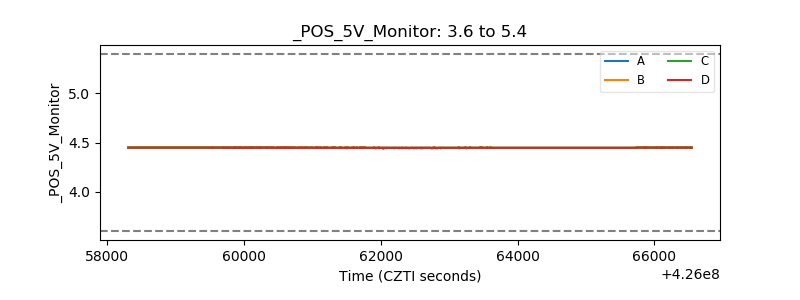 |
| _ROLL_ROT | 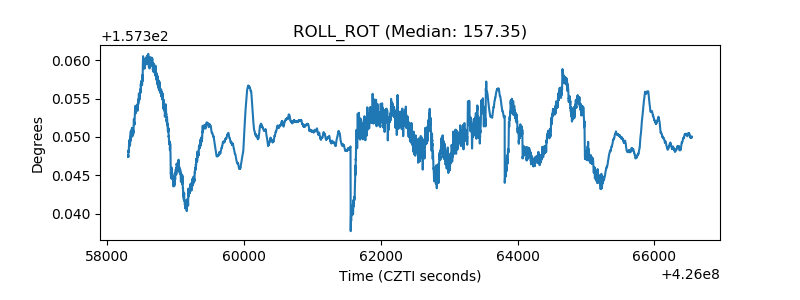 |
| _Roll_DEC | 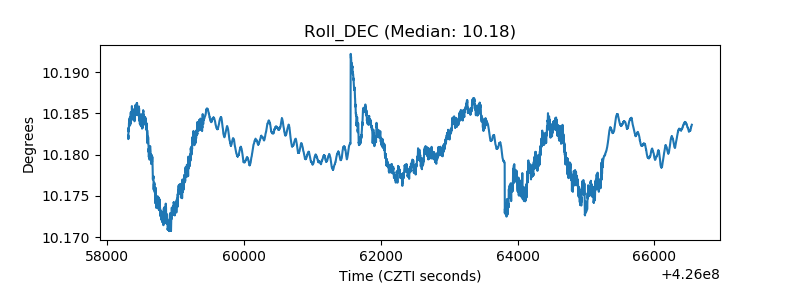 |
| _Roll_RA | 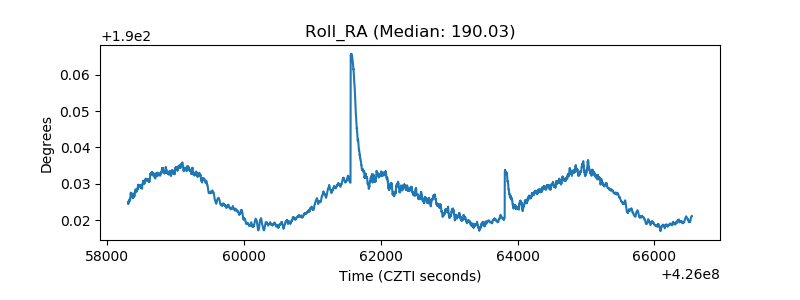 |
| Veto Counter | 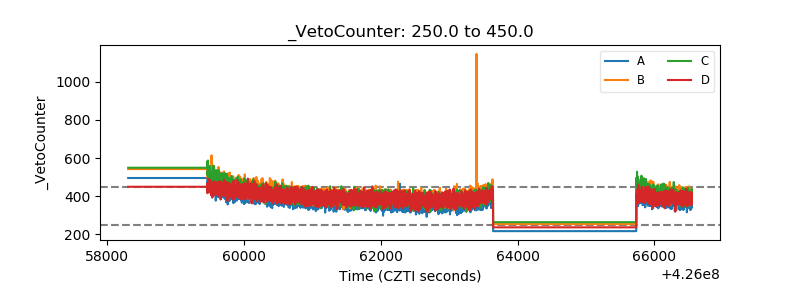 |