| Param | Original file | Final file |
|---|---|---|
| Filename | modeM0/AS1A12_025T15_9000005726_41970cztM0_level2.fits | modeM0/AS1A12_025T15_9000005726_41970cztM0_level2_quad_clean.evt |
| Size (bytes) | 937,851,840 | 270,596,160 |
| Size | 894.4 MB | 258.1 MB |
| Events in quadrant A | 8,958,133 | 1,853,620 |
| Events in quadrant B | 7,971,819 | 1,910,660 |
| Events in quadrant C | 7,703,811 | 1,776,861 |
| Events in quadrant D | 8,892,634 | 1,592,907 |
| Mode SS | |||
|---|---|---|---|
| Quadrant | BADHDUFLAG | Total packets | Discarded packets |
| A | 0 | 314 | 0 |
| B | 0 | 314 | 0 |
| C | 0 | 314 | 0 |
| D | 0 | 314 | 0 |
| Mode M9 | |||
|---|---|---|---|
| Quadrant | BADHDUFLAG | Total packets | Discarded packets |
| A | 0 | 63 | 0 |
| B | 0 | 63 | 0 |
| C | 0 | 63 | 0 |
| D | 0 | 63 | 0 |
| Mode M0 | |||
|---|---|---|---|
| Quadrant | BADHDUFLAG | Total packets | Discarded packets |
| A | 0 | 35465 | 3 |
| B | 0 | 33371 | 3 |
| C | 0 | 31528 | 3 |
| D | 0 | 36779 | 3 |
| Quadrant | Total seconds | Saturated seconds | Saturation percentage |
|---|---|---|---|
| A | 15361 | 42 | 0.273420% |
| B | 15361 | 65 | 0.423150% |
| C | 15361 | 28 | 0.182280% |
| D | 15361 | 443 | 2.883927% |
Noise dominated data is calculated using 1-second bins in cleaned event files. If a bin has >2000 counts, and if more than 50% of those come from <1% of pixels, then it is considered to be noise-dominated and hence unusable.
| Quadrant | # 1 sec bins | Bins with >0 counts | Bins with >2000 counts | High rate bins dominated by noise | Noise dominated (total time) | Noise dominated (detector-on time) | Marked lightcurve |
|---|---|---|---|---|---|---|---|
| A | 21700 | 15364 | 19 | 19 | 0.09% | 0.12% | 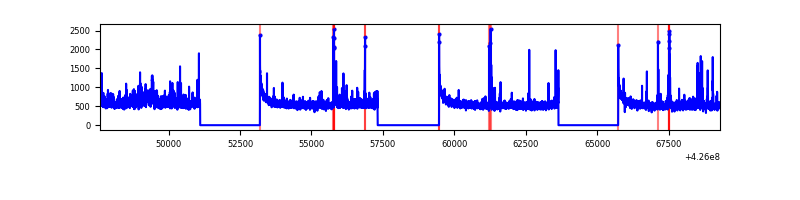 |
| B | 21700 | 15364 | 41 | 41 | 0.19% | 0.27% | 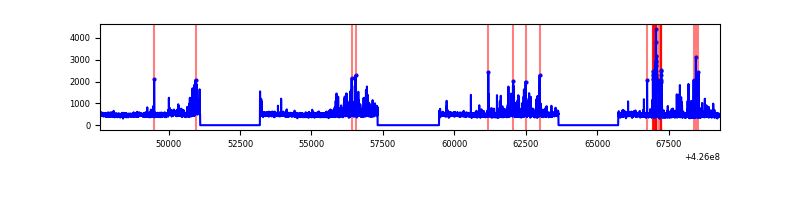 |
| C | 21700 | 15364 | 22 | 22 | 0.10% | 0.14% | 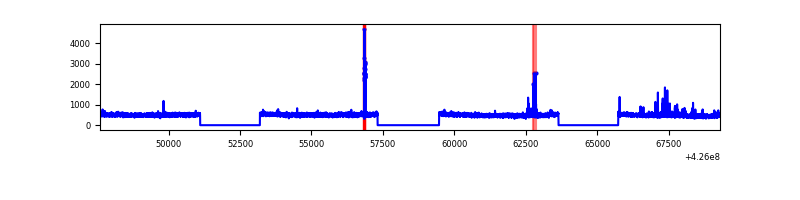 |
| D | 21700 | 15364 | 399 | 399 | 1.84% | 2.60% | 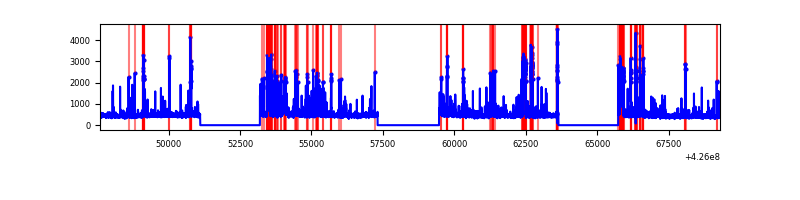 |
Top three noisy pixels from each quadrant. If the there are fewer than three noisy pixels in the level2.evt file, extra rows are filled as -1
| Pixel properties | Quadrant properties | ||||||
|---|---|---|---|---|---|---|---|
| Quadrant | DetID | PixID | Counts | Sigma | Mean | Median | Sigma |
| A | 10 | 83 | 1356153 | 3721.24 | 1802 | 1767 | 364.0 |
| A | 2 | 79 | 307993 | 841.37 | 1802 | 1767 | 364.0 |
| A | 14 | 250 | 288995 | 789.17 | 1802 | 1767 | 364.0 |
| B | 0 | 190 | 725287 | 2145.61 | 1778 | 1734 | 337.2 |
| B | 5 | 255 | 213002 | 626.49 | 1778 | 1734 | 337.2 |
| B | 0 | 186 | 43378 | 123.49 | 1778 | 1734 | 337.2 |
| C | 15 | 214 | 661192 | 1653.3 | 1730 | 1746 | 398.9 |
| C | 8 | 79 | 148537 | 368.02 | 1730 | 1746 | 398.9 |
| C | 15 | 111 | 82835 | 203.3 | 1730 | 1746 | 398.9 |
| D | 13 | 249 | 1271957 | 3050.24 | 1721 | 1674 | 416.5 |
| D | 10 | 199 | 488024 | 1167.84 | 1721 | 1674 | 416.5 |
| D | 2 | 249 | 187085 | 445.21 | 1721 | 1674 | 416.5 |
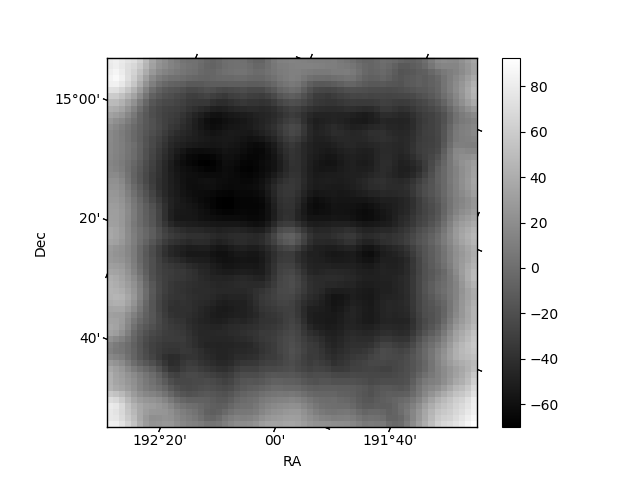
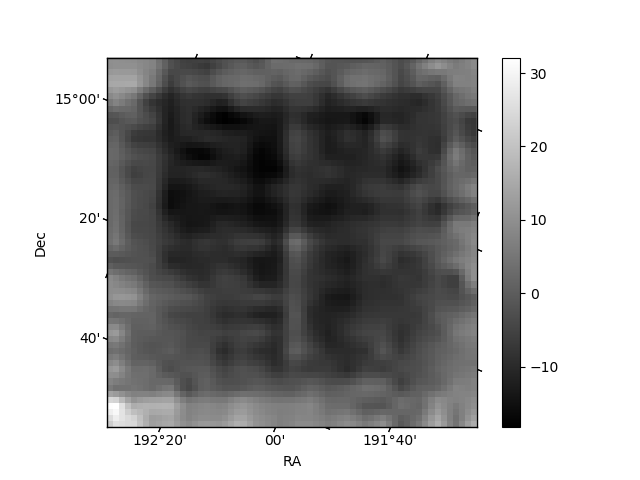
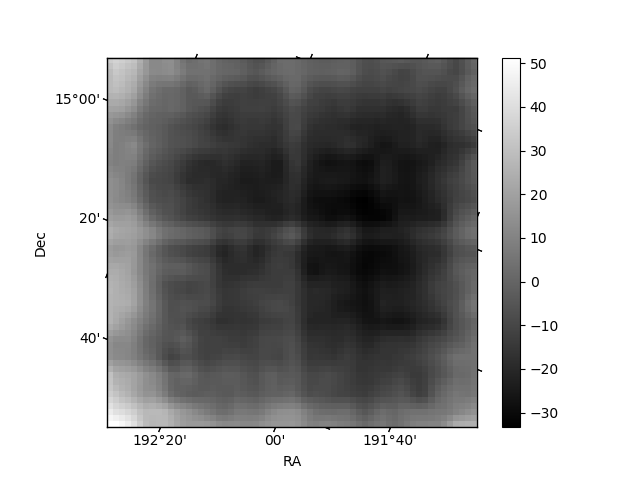
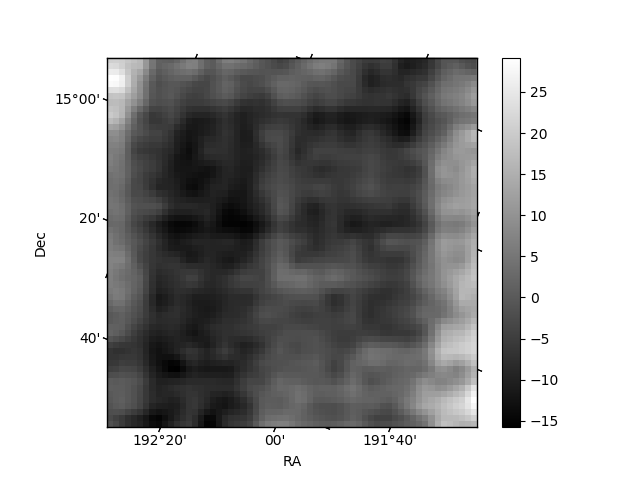
Histogram calculated using DETX and DETY for each event in the final _common_clean file
| Quadrant A | 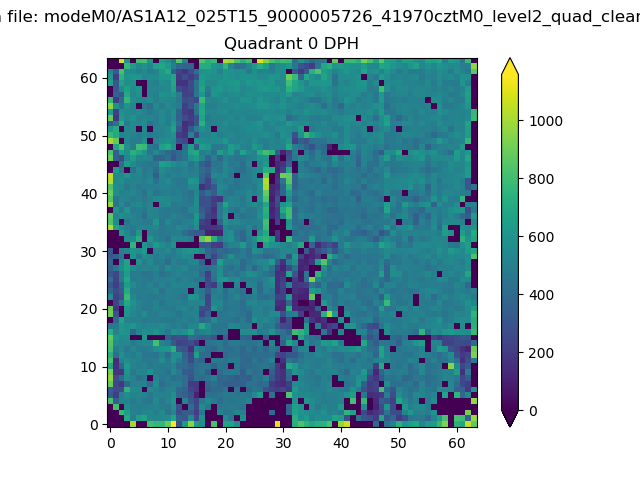 |
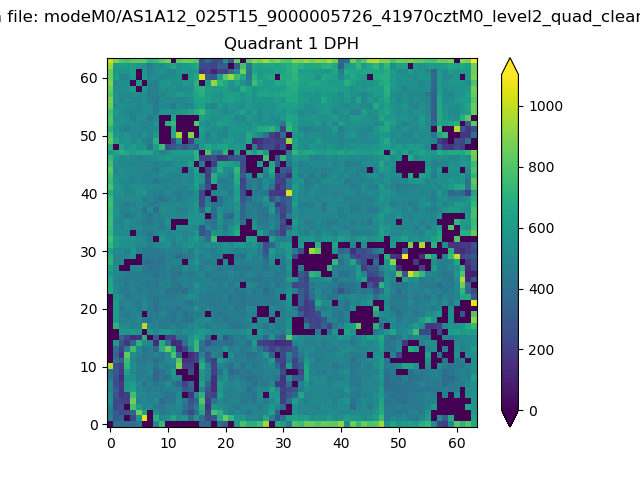 |
Quadrant B |
|---|---|---|---|
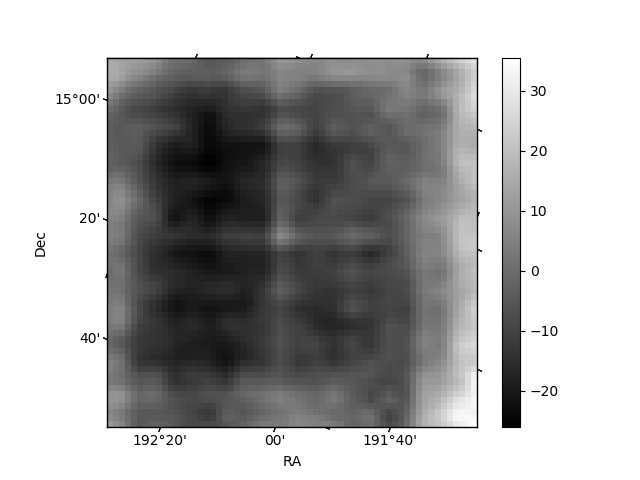
| Quadrant D | 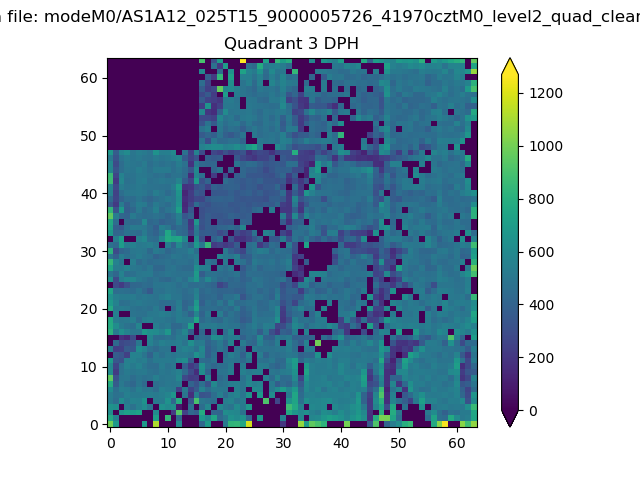 |
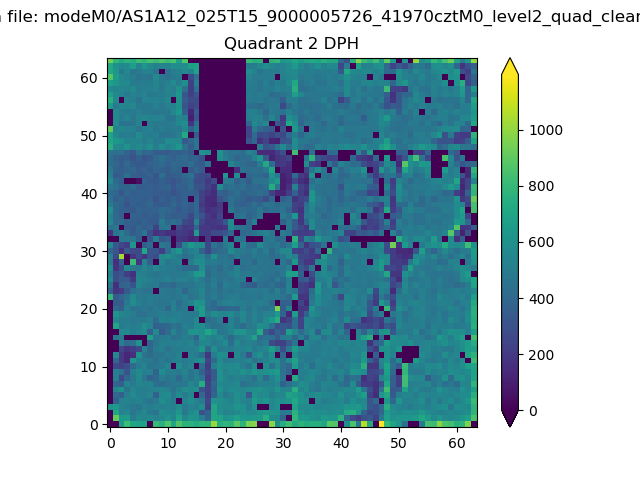 |
Quadrant C |
| Plot type | Count rate plots | Images |
|---|---|---|
| Comparison with Poisson distribution Blue bars denote a histogram of data divided into 1 sec bins. Red curve is a Poisson curve with rate = median count rate of data. |
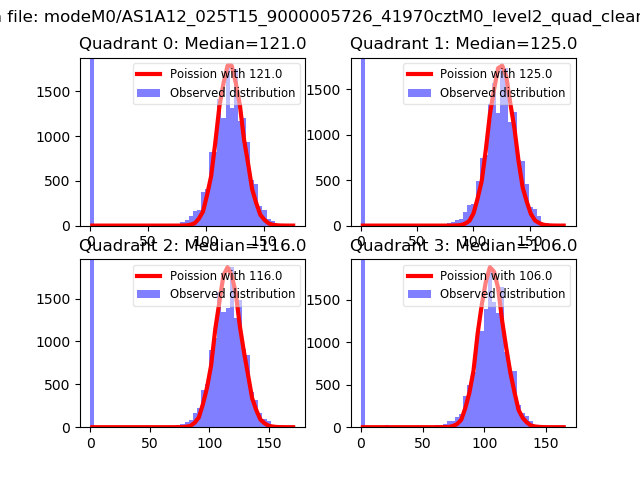 |
 |
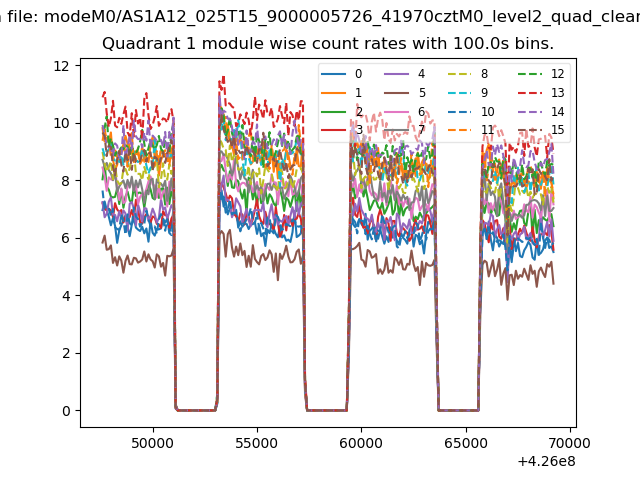
| Quadrant-wise count rates Data is divided into 100 sec bins |
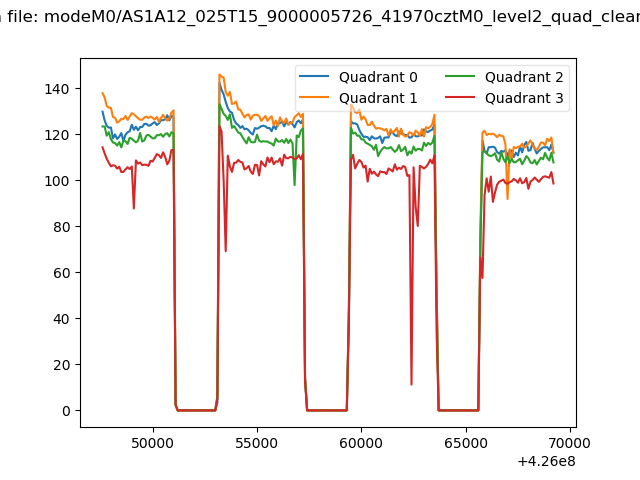 |
|
| Module-wise count rates for Quadrant A Data is divided into 100 sec bins |
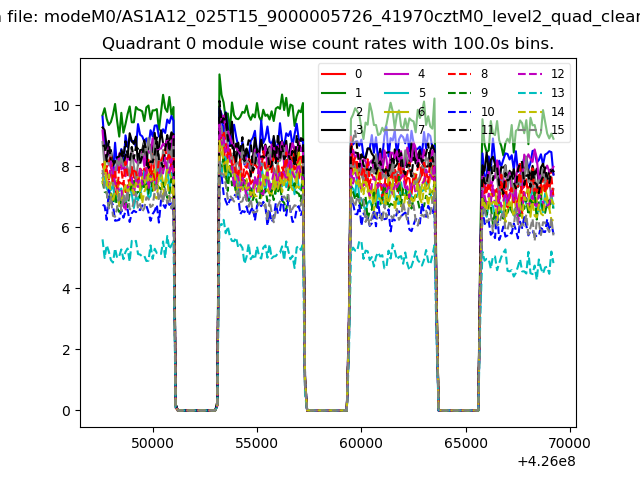 |
 |
| Module-wise count rates for Quadrant B Data is divided into 100 sec bins |
 |
 |
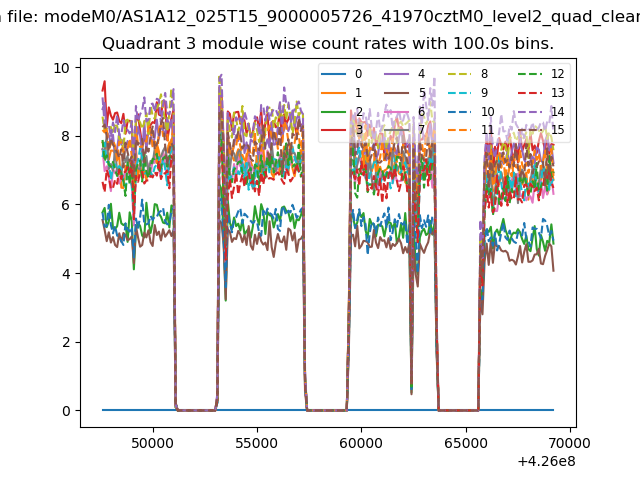
| Module-wise count rates for Quadrant C Data is divided into 100 sec bins |
 |
 |
| Module-wise count rates for Quadrant D Data is divided into 100 sec bins |
 |
 |
| Parameter | Plot |
|---|---|
| CZT HV Monitor | 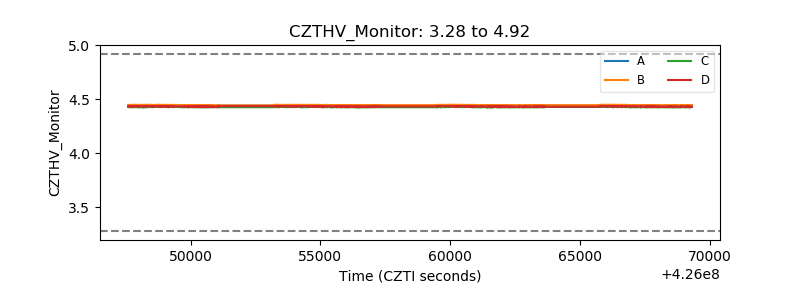 |
| D_VDD | 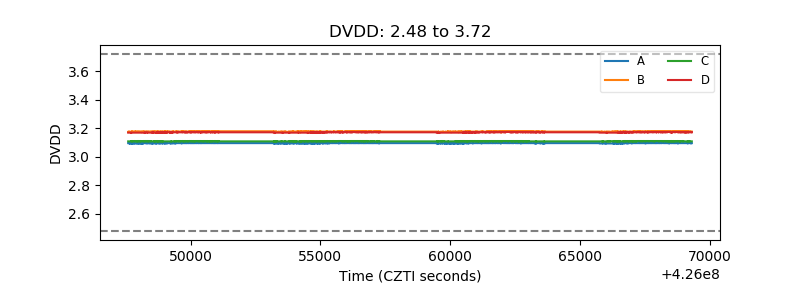 |
| Temperature 1 | 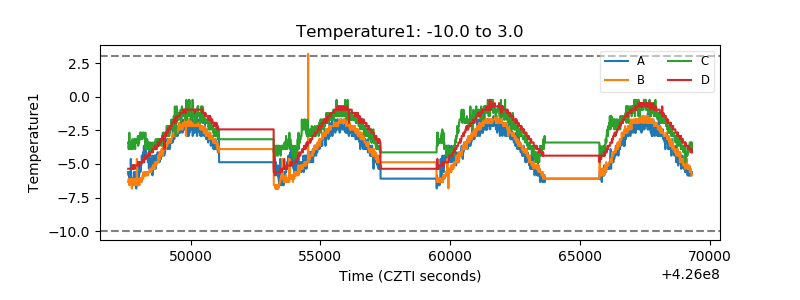 |
| Veto HV Monitor | 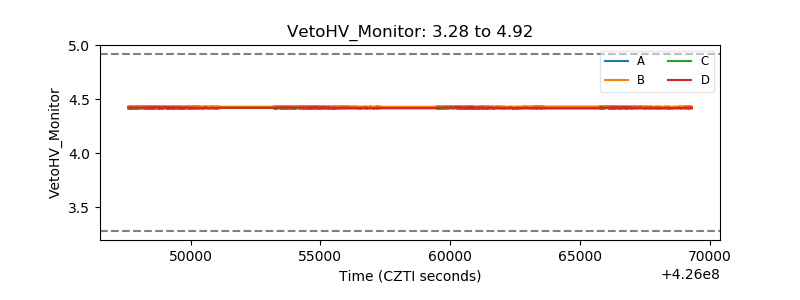 |
| Veto LLD | 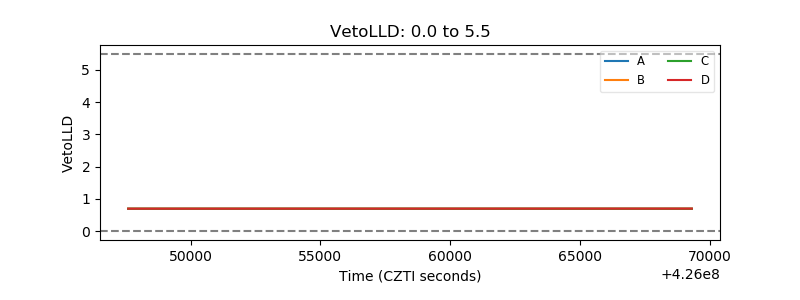 |
| Alpha Counter | 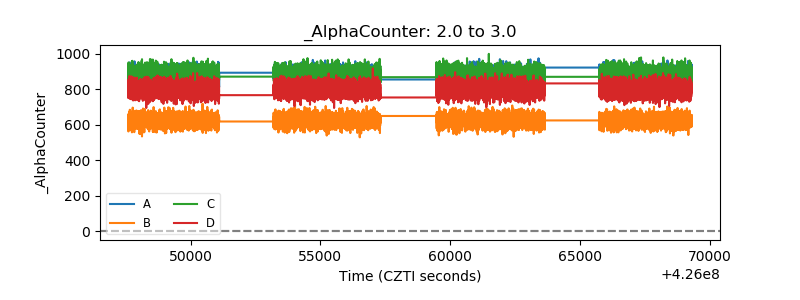 |
| _CPM_Rate | 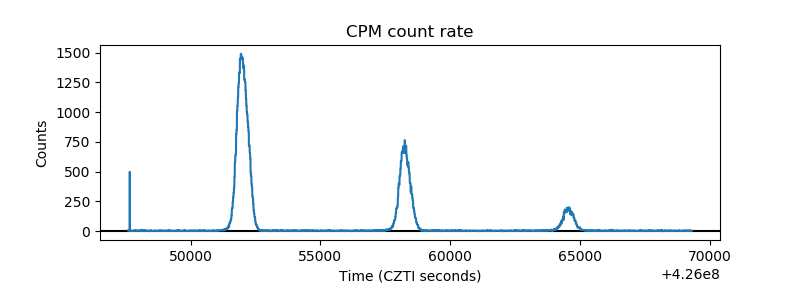 |
| CZT Counter | 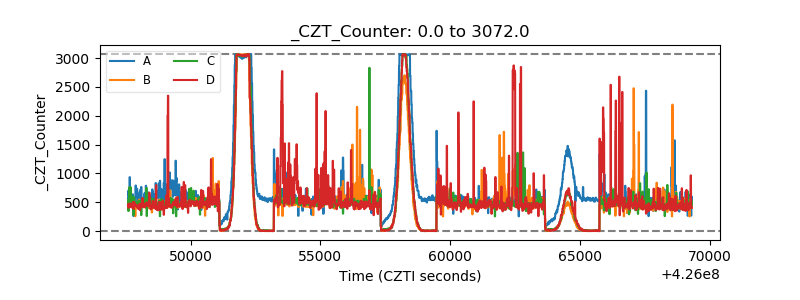 |
| +2.5 Volts monitor | 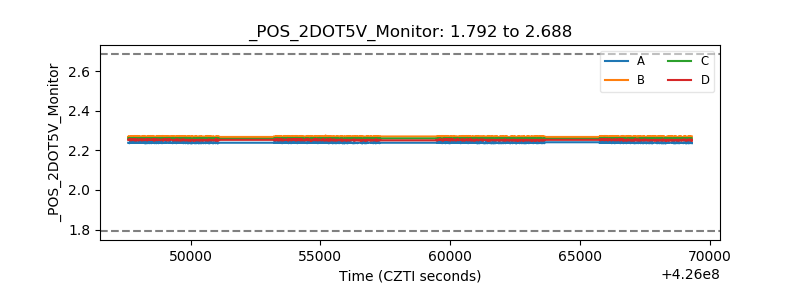 |
| +5 Volts monitor |  |
| _ROLL_ROT | 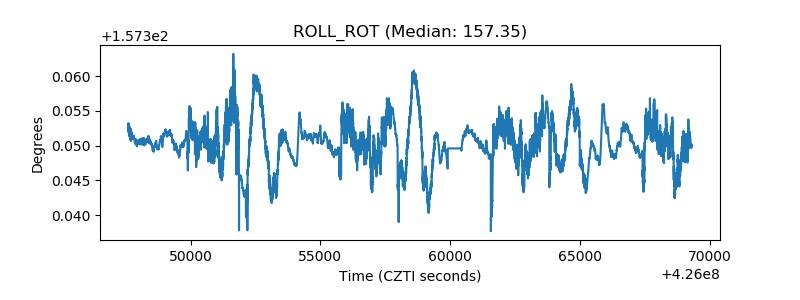 |
| _Roll_DEC | 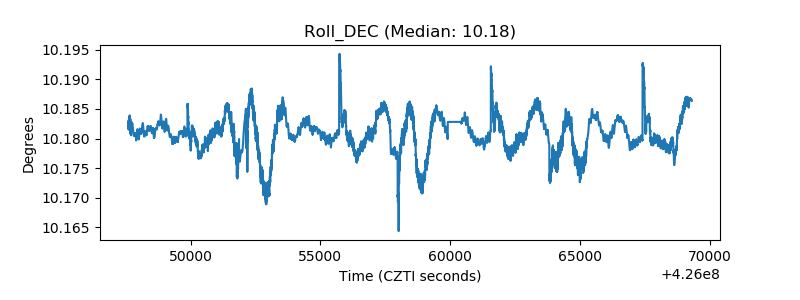 |
| _Roll_RA | 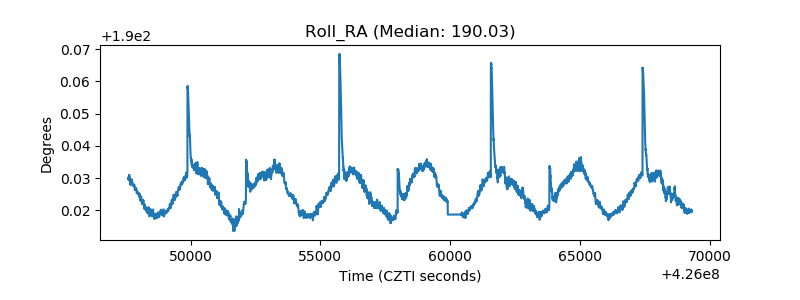 |
| Veto Counter | 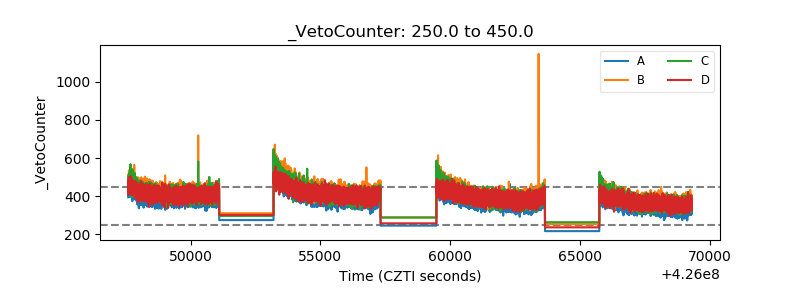 |