| Param | Original file | Final file |
|---|---|---|
| Filename | modeM0/AS1A12_025T16_9000005724_41957cztM0_level2.fits | modeM0/AS1A12_025T16_9000005724_41957cztM0_level2_quad_clean.evt |
| Size (bytes) | 89,881,920 | 26,112,960 |
| Size | 85.7 MB | 24.9 MB |
| Events in quadrant A | 916,943 | 172,955 |
| Events in quadrant B | 746,423 | 177,781 |
| Events in quadrant C | 768,565 | 169,260 |
| Events in quadrant D | 771,812 | 156,273 |
| Mode M0 | |||
|---|---|---|---|
| Quadrant | BADHDUFLAG | Total packets | Discarded packets |
| A | 0 | 3641 | 1 |
| B | 0 | 3170 | 1 |
| C | 0 | 3123 | 1 |
| D | 0 | 3317 | 1 |
| Mode M9 | |||
|---|---|---|---|
| Quadrant | BADHDUFLAG | Total packets | Discarded packets |
| A | 0 | 14 | 0 |
| B | 0 | 14 | 0 |
| C | 0 | 14 | 0 |
| D | 0 | 14 | 0 |
| Mode SS | |||
|---|---|---|---|
| Quadrant | BADHDUFLAG | Total packets | Discarded packets |
| A | 0 | 34 | 0 |
| B | 0 | 34 | 0 |
| C | 0 | 34 | 0 |
| D | 0 | 34 | 0 |
| Quadrant | Total seconds | Saturated seconds | Saturation percentage |
|---|---|---|---|
| A | 1547 | 5 | 0.323206% |
| B | 1547 | 5 | 0.323206% |
| C | 1547 | 1 | 0.064641% |
| D | 1547 | 5 | 0.323206% |
Noise dominated data is calculated using 1-second bins in cleaned event files. If a bin has >2000 counts, and if more than 50% of those come from <1% of pixels, then it is considered to be noise-dominated and hence unusable.
| Quadrant | # 1 sec bins | Bins with >0 counts | Bins with >2000 counts | High rate bins dominated by noise | Noise dominated (total time) | Noise dominated (detector-on time) | Marked lightcurve |
|---|---|---|---|---|---|---|---|
| A | 2950 | 1548 | 1 | 1 | 0.03% | 0.06% | 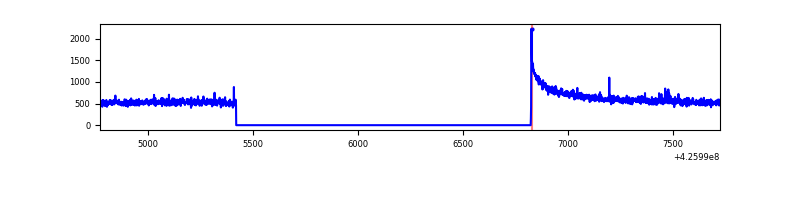 |
| B | 2950 | 1548 | 0 | 0 | 0.00% | 0.00% | 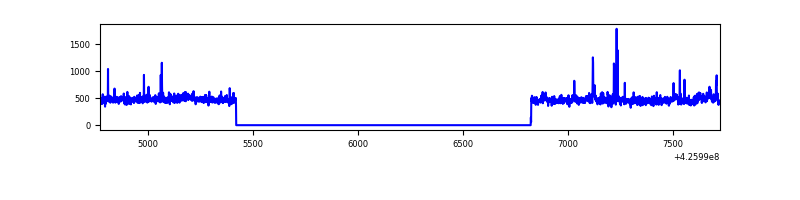 |
| C | 2950 | 1548 | 0 | 0 | 0.00% | 0.00% | 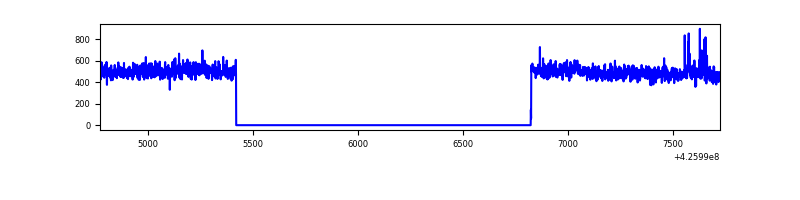 |
| D | 2950 | 1548 | 4 | 4 | 0.14% | 0.26% | 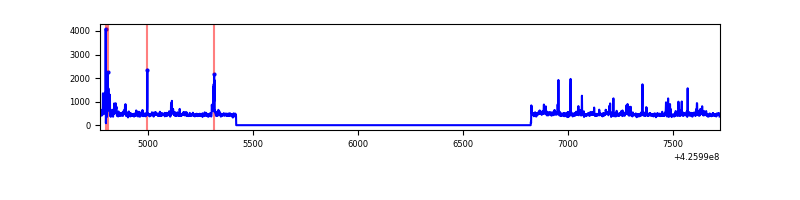 |
Top three noisy pixels from each quadrant. If the there are fewer than three noisy pixels in the level2.evt file, extra rows are filled as -1
| Pixel properties | Quadrant properties | ||||||
|---|---|---|---|---|---|---|---|
| Quadrant | DetID | PixID | Counts | Sigma | Mean | Median | Sigma |
| A | 10 | 83 | 203202 | 5176.03 | 182 | 178 | 39.2 |
| A | 2 | 79 | 6191 | 153.3 | 182 | 178 | 39.2 |
| A | 13 | 6 | 4043 | 98.54 | 182 | 178 | 39.2 |
| B | 5 | 255 | 14747 | 387.11 | 179 | 173 | 37.6 |
| B | 0 | 156 | 10365 | 270.72 | 179 | 173 | 37.6 |
| B | 0 | 229 | 5969 | 153.95 | 179 | 173 | 37.6 |
| C | 15 | 214 | 70785 | 1646.57 | 176 | 177 | 42.9 |
| C | 15 | 111 | 5219 | 117.58 | 176 | 177 | 42.9 |
| C | 8 | 79 | 1983 | 42.12 | 176 | 177 | 42.9 |
| D | 2 | 249 | 28756 | 634.66 | 176 | 171 | 45.0 |
| D | 12 | 218 | 20891 | 460.04 | 176 | 171 | 45.0 |
| D | 10 | 199 | 9693 | 211.41 | 176 | 171 | 45.0 |
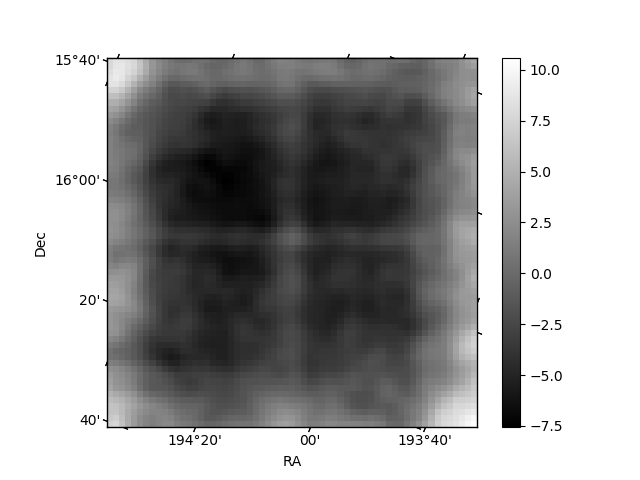
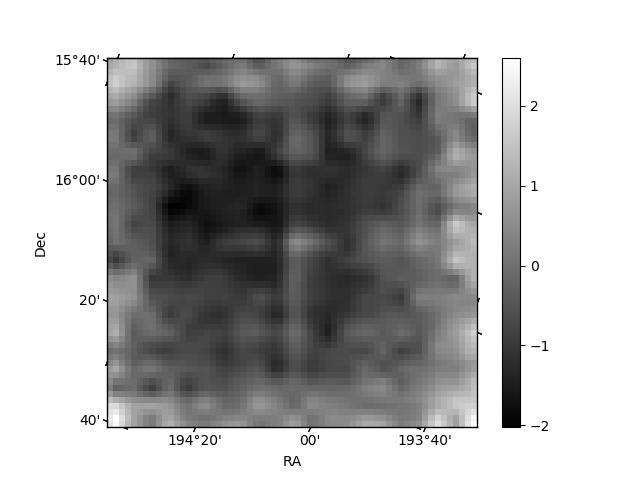
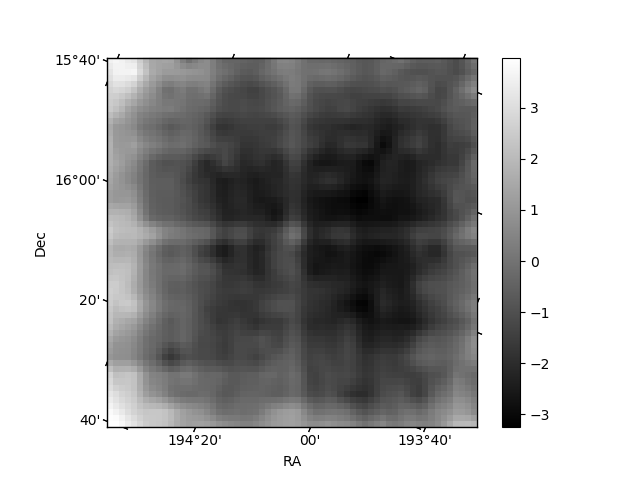
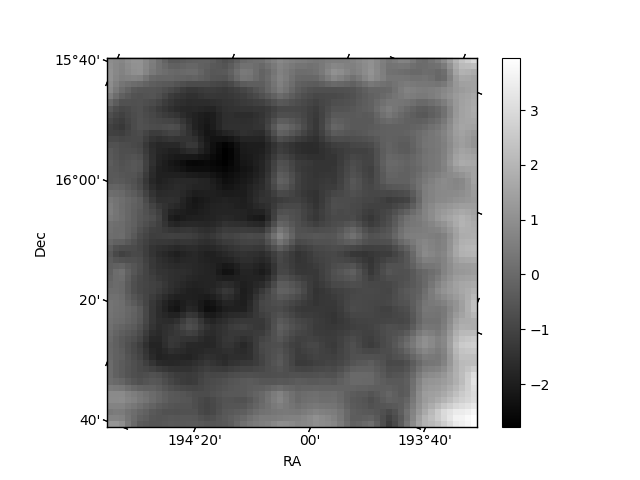
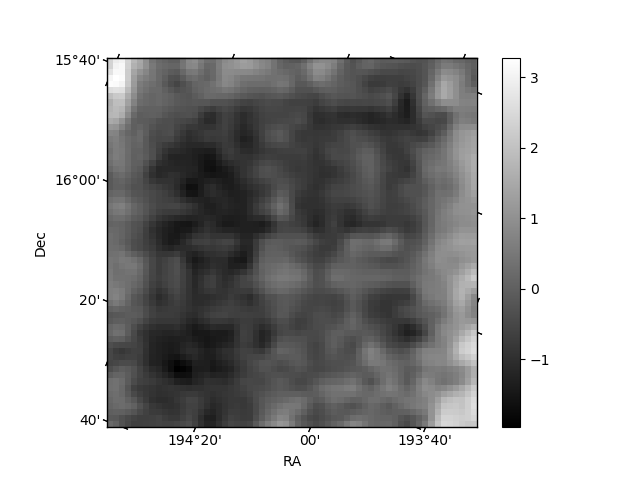
Histogram calculated using DETX and DETY for each event in the final _common_clean file
| Quadrant A | 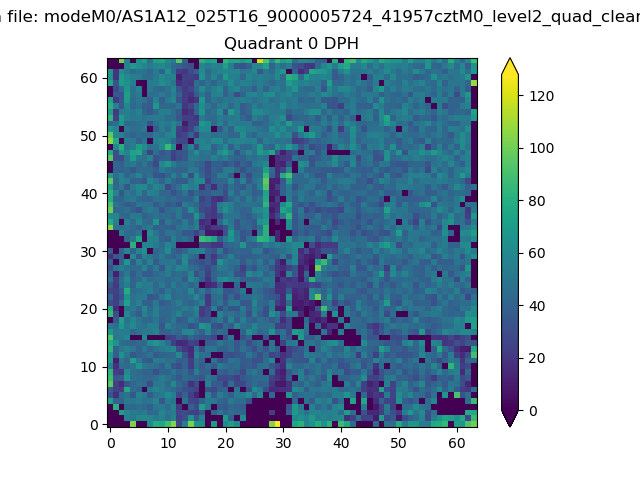 |
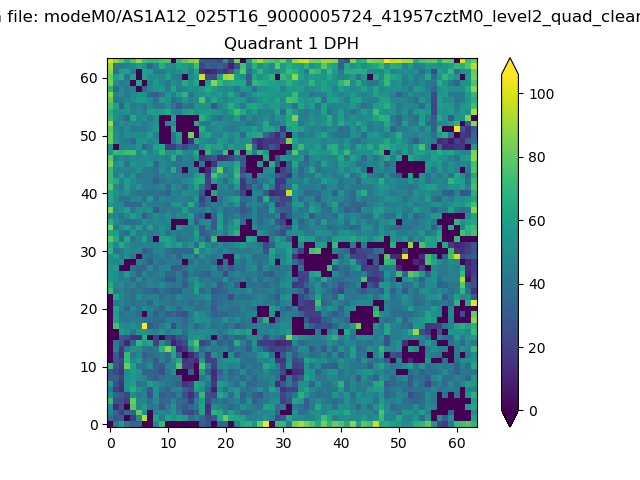 |
Quadrant B |
|---|---|---|---|
| Quadrant D | 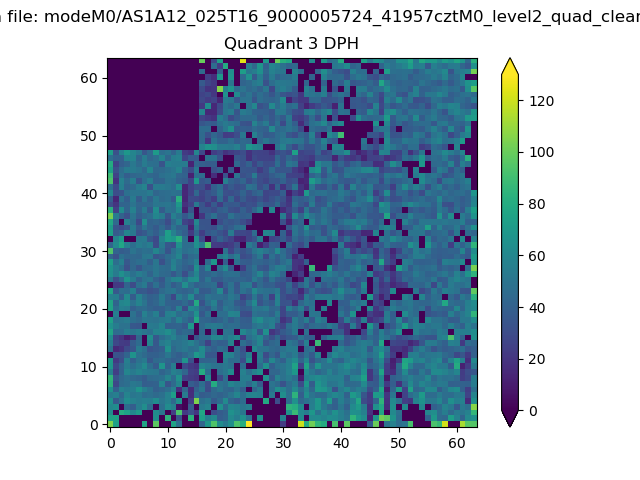 |
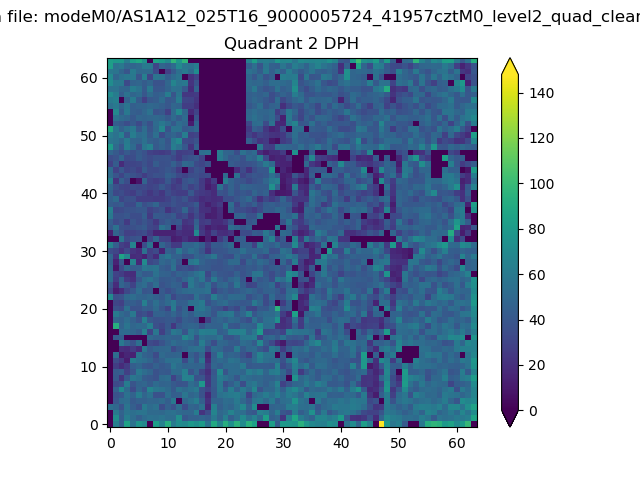 |
Quadrant C |
| Plot type | Count rate plots | Images |
|---|---|---|
| Comparison with Poisson distribution Blue bars denote a histogram of data divided into 1 sec bins. Red curve is a Poisson curve with rate = median count rate of data. |
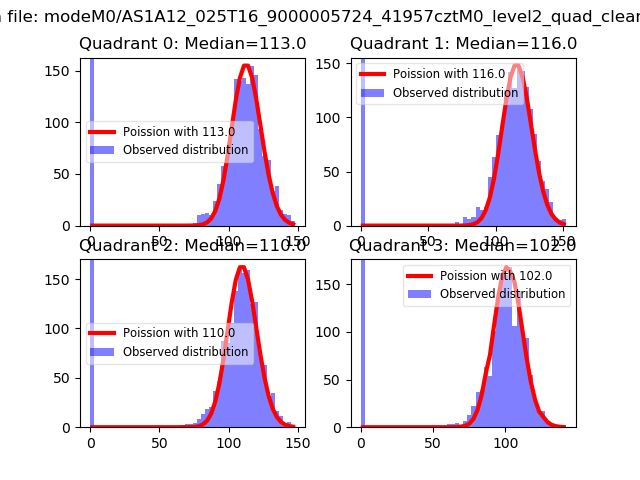 |
 |
| Quadrant-wise count rates Data is divided into 100 sec bins |
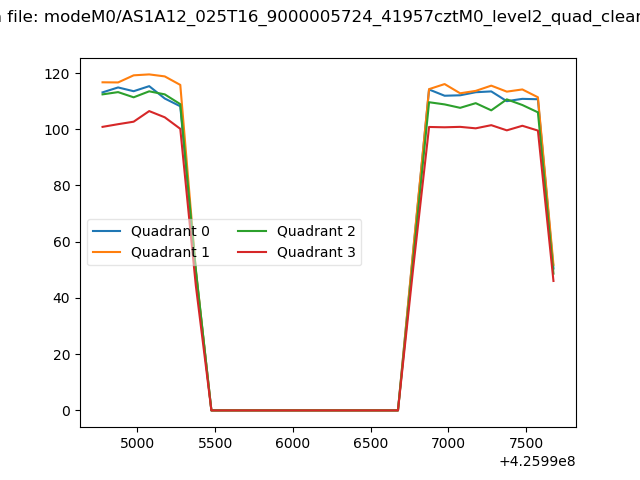 |
|
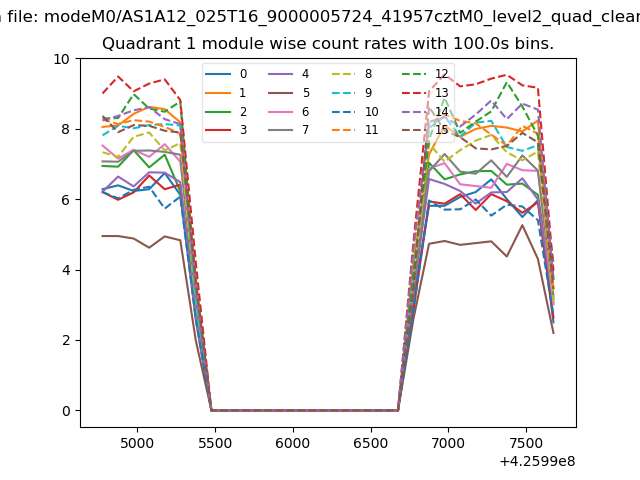
| Module-wise count rates for Quadrant A Data is divided into 100 sec bins |
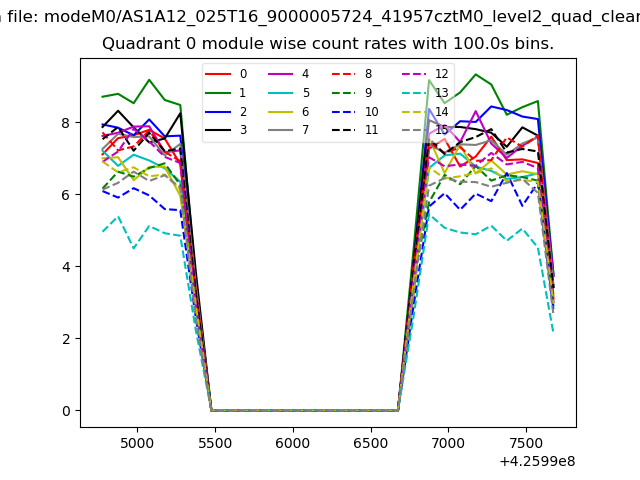 |
 |
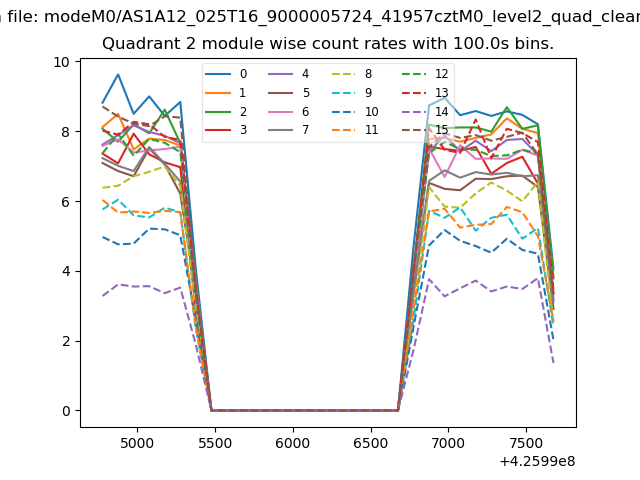
| Module-wise count rates for Quadrant B Data is divided into 100 sec bins |
 |
 |
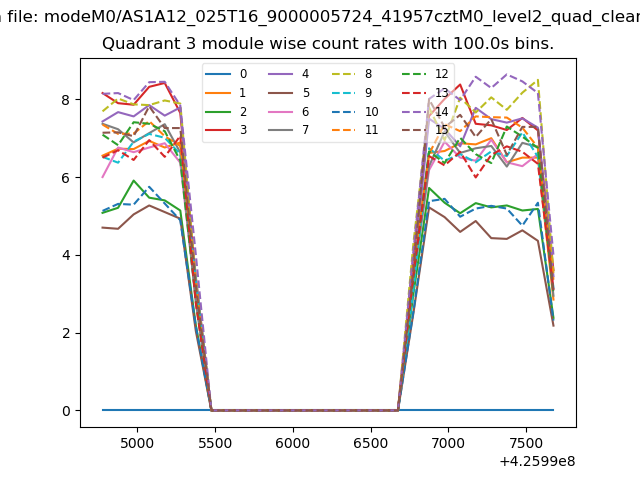
| Module-wise count rates for Quadrant C Data is divided into 100 sec bins |
 |
 |
| Module-wise count rates for Quadrant D Data is divided into 100 sec bins |
 |
 |
| Parameter | Plot |
|---|---|
| CZT HV Monitor | 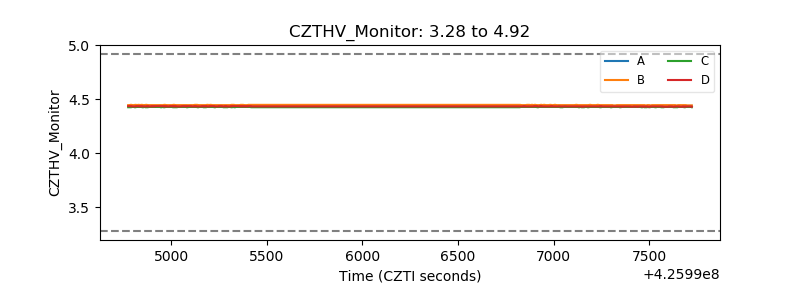 |
| D_VDD | 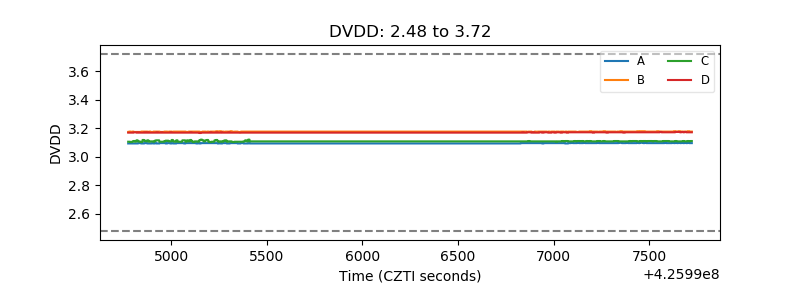 |
| Temperature 1 |  |
| Veto HV Monitor | 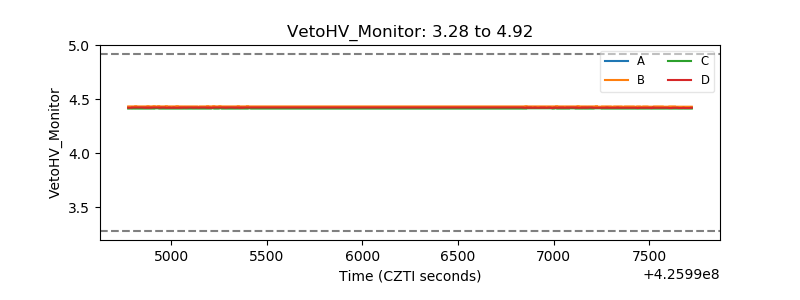 |
| Veto LLD | 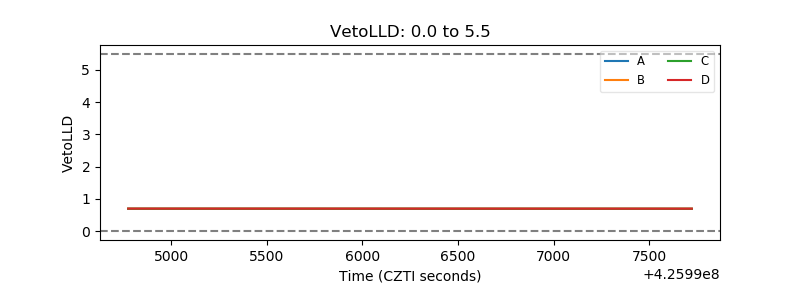 |
| Alpha Counter | 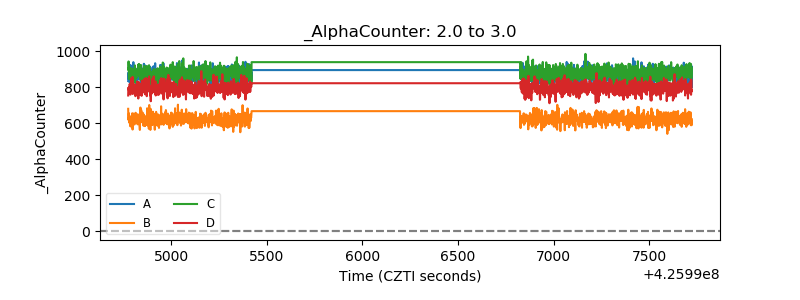 |
| _CPM_Rate | 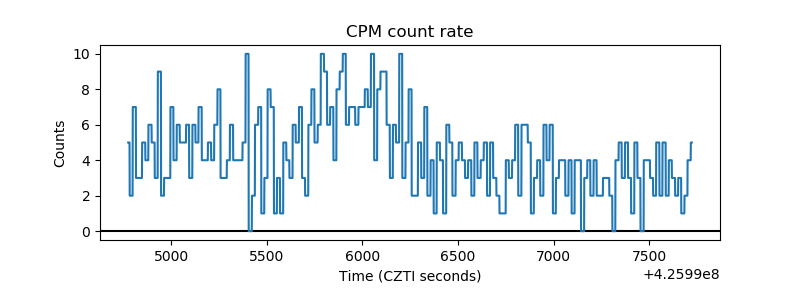 |
| CZT Counter | 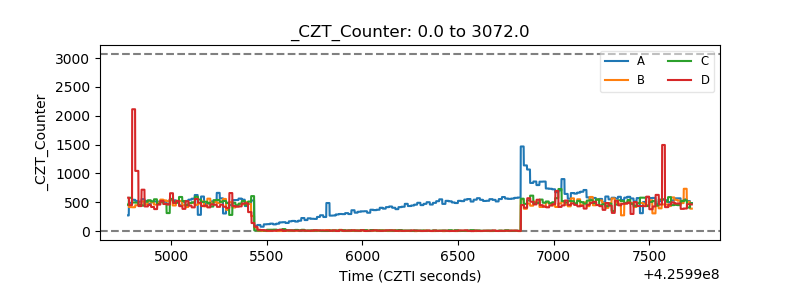 |
| +2.5 Volts monitor | 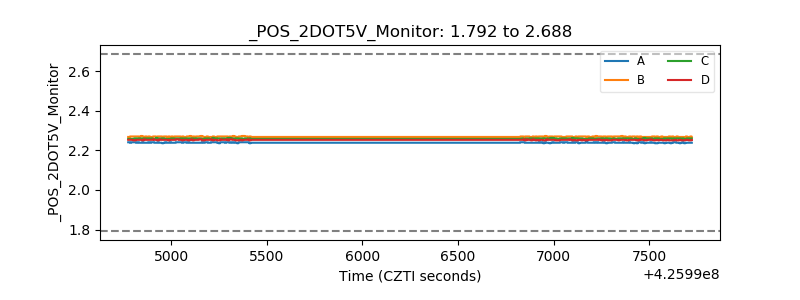 |
| +5 Volts monitor | 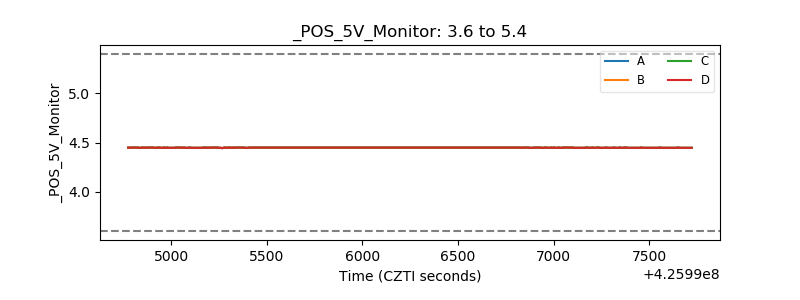 |
| _ROLL_ROT | 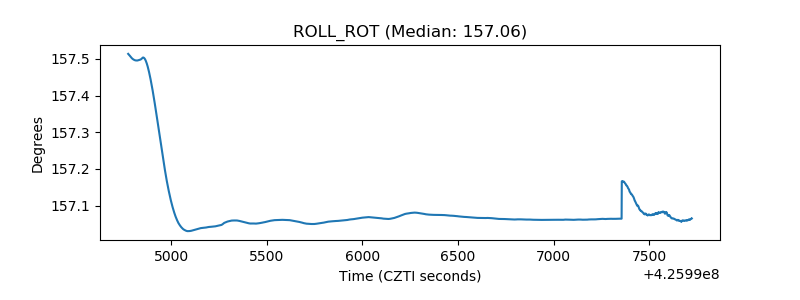 |
| _Roll_DEC | 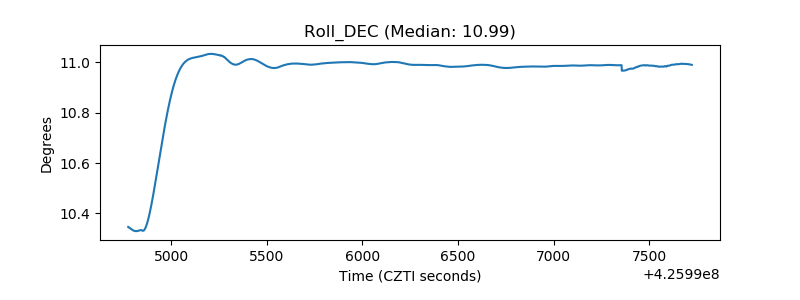 |
| _Roll_RA | 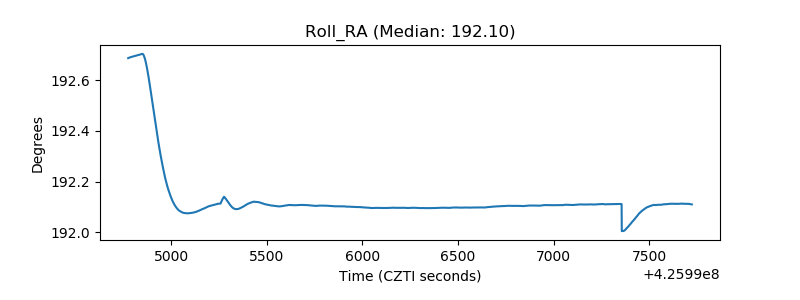 |
| Veto Counter | 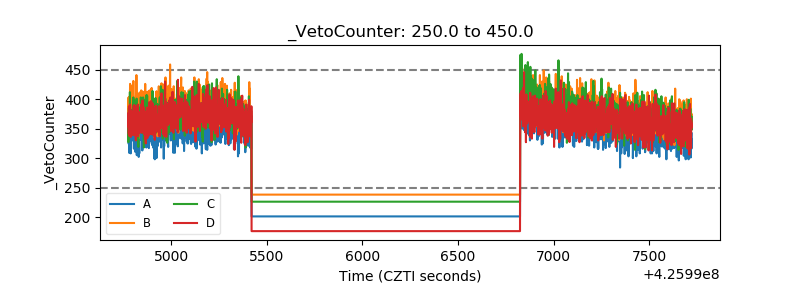 |