| Param | Original file | Final file |
|---|---|---|
| Filename | modeM0/AS1A12_025T16_9000005724_41958cztM0_level2.fits | modeM0/AS1A12_025T16_9000005724_41958cztM0_level2_quad_clean.evt |
| Size (bytes) | 331,724,160 | 94,694,400 |
| Size | 316.4 MB | 90.3 MB |
| Events in quadrant A | 3,183,649 | 635,144 |
| Events in quadrant B | 2,859,176 | 641,555 |
| Events in quadrant C | 2,722,035 | 616,260 |
| Events in quadrant D | 3,062,877 | 569,037 |
| Mode M0 | |||
|---|---|---|---|
| Quadrant | BADHDUFLAG | Total packets | Discarded packets |
| A | 0 | 12944 | 7 |
| B | 0 | 12351 | 10 |
| C | 0 | 11778 | 6 |
| D | 0 | 13128 | 9 |
| Mode M9 | |||
|---|---|---|---|
| Quadrant | BADHDUFLAG | Total packets | Discarded packets |
| A | 0 | 20 | 0 |
| B | 0 | 20 | 0 |
| C | 0 | 20 | 0 |
| D | 0 | 21 | 0 |
| Mode SS | |||
|---|---|---|---|
| Quadrant | BADHDUFLAG | Total packets | Discarded packets |
| A | 0 | 118 | 0 |
| B | 0 | 118 | 0 |
| C | 0 | 118 | 0 |
| D | 0 | 118 | 0 |
| Quadrant | Total seconds | Saturated seconds | Saturation percentage |
|---|---|---|---|
| A | 5797 | 12 | 0.207004% |
| B | 5793 | 54 | 0.932160% |
| C | 5796 | 7 | 0.120773% |
| D | 5798 | 65 | 1.121076% |
Noise dominated data is calculated using 1-second bins in cleaned event files. If a bin has >2000 counts, and if more than 50% of those come from <1% of pixels, then it is considered to be noise-dominated and hence unusable.
| Quadrant | # 1 sec bins | Bins with >0 counts | Bins with >2000 counts | High rate bins dominated by noise | Noise dominated (total time) | Noise dominated (detector-on time) | Marked lightcurve |
|---|---|---|---|---|---|---|---|
| A | 7114 | 5800 | 4 | 4 | 0.06% | 0.07% | 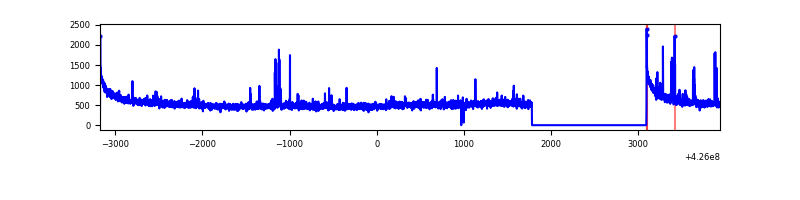 |
| B | 7114 | 5799 | 31 | 31 | 0.44% | 0.53% | 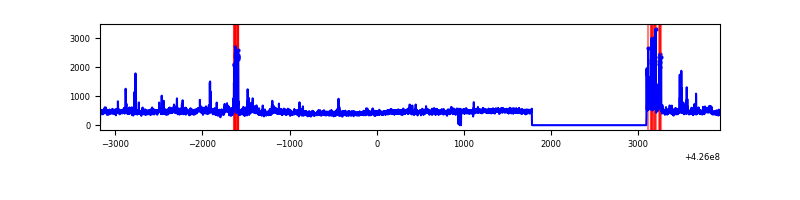 |
| C | 7114 | 5799 | 10 | 10 | 0.14% | 0.17% | 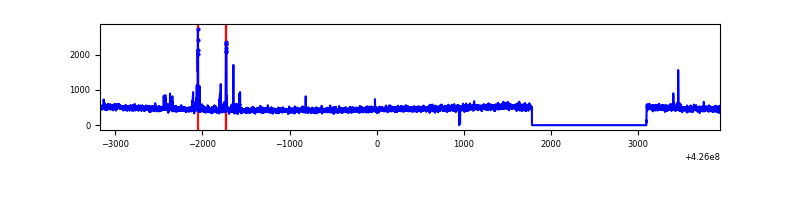 |
| D | 7114 | 5801 | 49 | 49 | 0.69% | 0.84% | 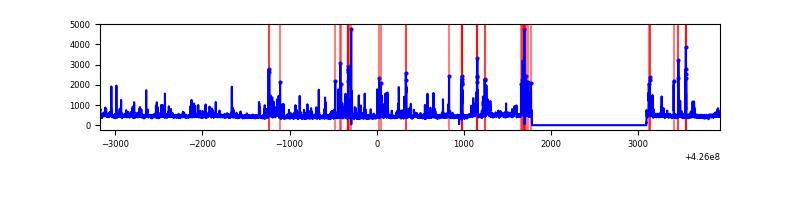 |
Top three noisy pixels from each quadrant. If the there are fewer than three noisy pixels in the level2.evt file, extra rows are filled as -1
| Pixel properties | Quadrant properties | ||||||
|---|---|---|---|---|---|---|---|
| Quadrant | DetID | PixID | Counts | Sigma | Mean | Median | Sigma |
| A | 10 | 83 | 605352 | 4657.69 | 635 | 622 | 129.8 |
| A | 2 | 79 | 54147 | 412.25 | 635 | 622 | 129.8 |
| A | 13 | 248 | 44739 | 339.79 | 635 | 622 | 129.8 |
| B | 5 | 255 | 113429 | 912.84 | 628 | 611 | 123.6 |
| B | 0 | 156 | 82507 | 662.64 | 628 | 611 | 123.6 |
| B | 0 | 190 | 73220 | 587.5 | 628 | 611 | 123.6 |
| C | 15 | 214 | 253295 | 1743.82 | 617 | 621 | 144.9 |
| C | 15 | 111 | 55589 | 379.36 | 617 | 621 | 144.9 |
| C | 8 | 79 | 6145 | 38.12 | 617 | 621 | 144.9 |
| D | 5 | 222 | 125562 | 831.82 | 616 | 601 | 150.2 |
| D | 13 | 249 | 112003 | 741.56 | 616 | 601 | 150.2 |
| D | 10 | 199 | 94005 | 621.75 | 616 | 601 | 150.2 |
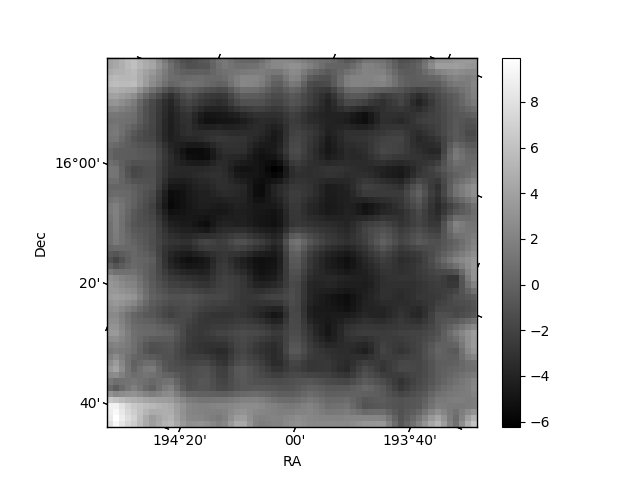
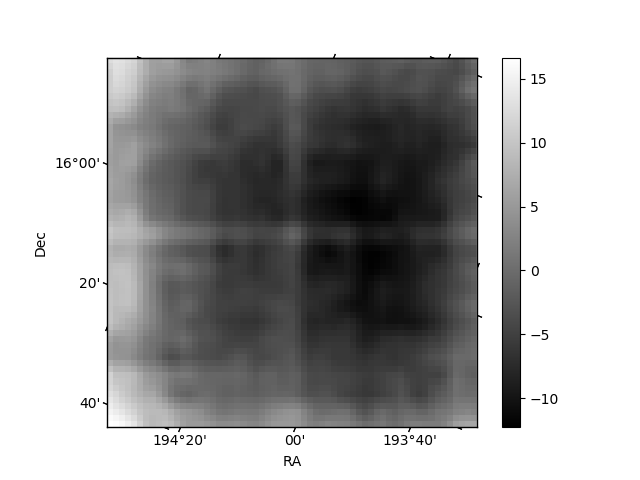
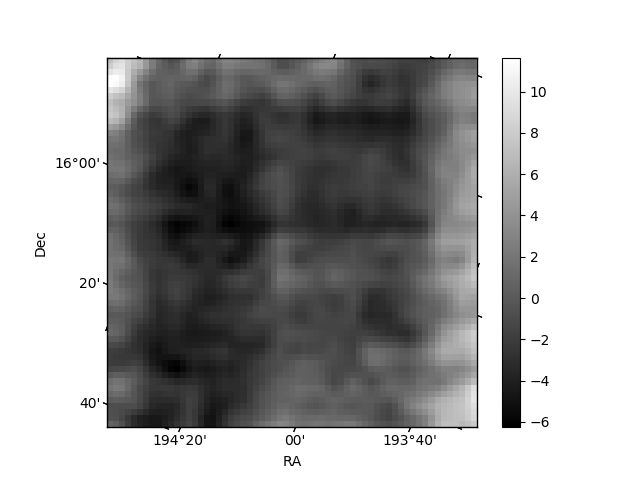
Histogram calculated using DETX and DETY for each event in the final _common_clean file
| Quadrant A | 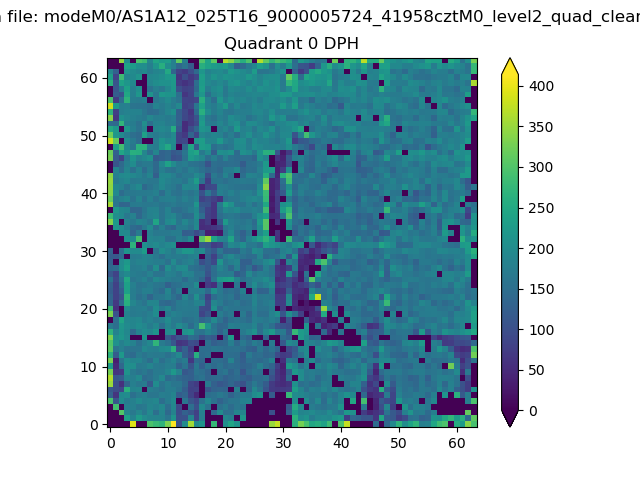 |
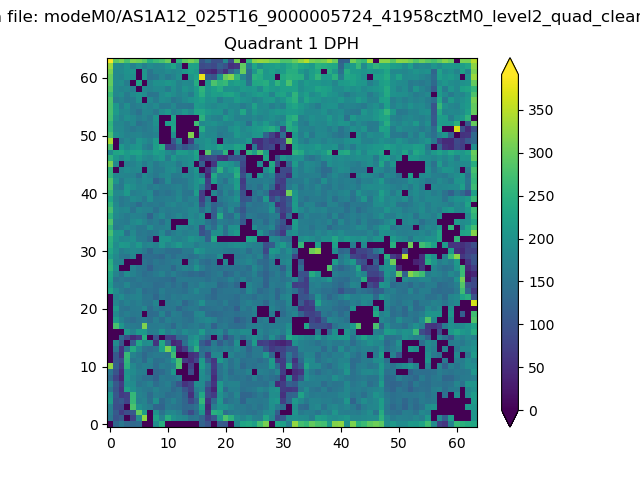 |
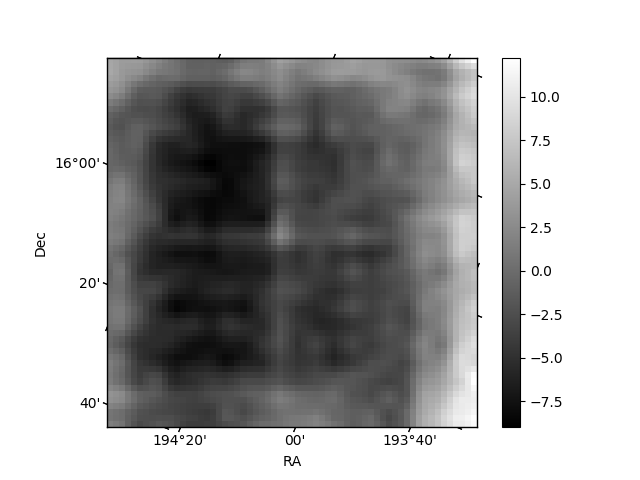
Quadrant B |
|---|---|---|---|
| Quadrant D | 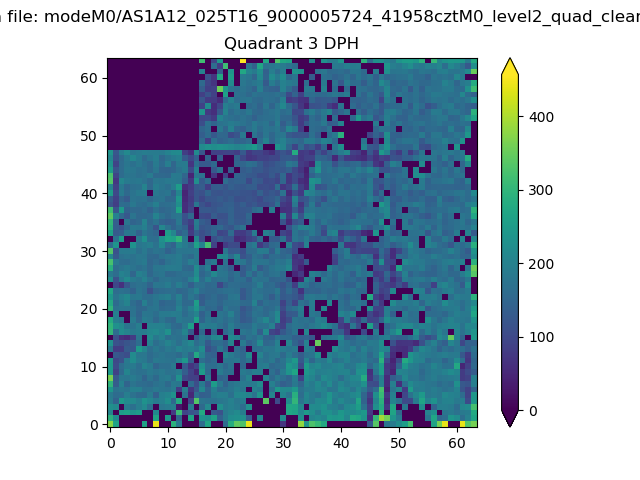 |
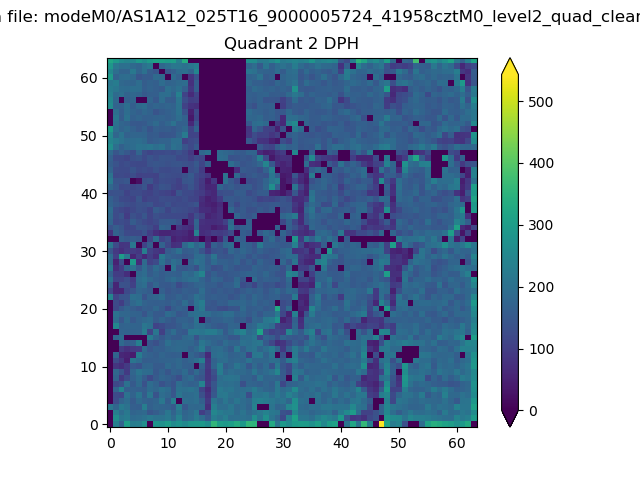 |
Quadrant C |
| Plot type | Count rate plots | Images |
|---|---|---|
| Comparison with Poisson distribution Blue bars denote a histogram of data divided into 1 sec bins. Red curve is a Poisson curve with rate = median count rate of data. |
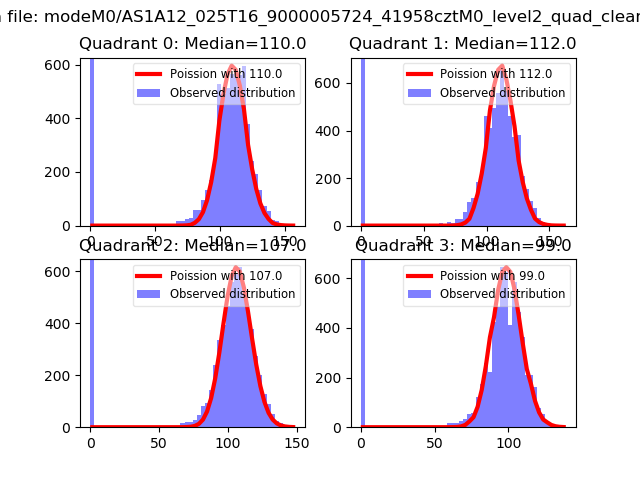 |
 |
| Quadrant-wise count rates Data is divided into 100 sec bins |
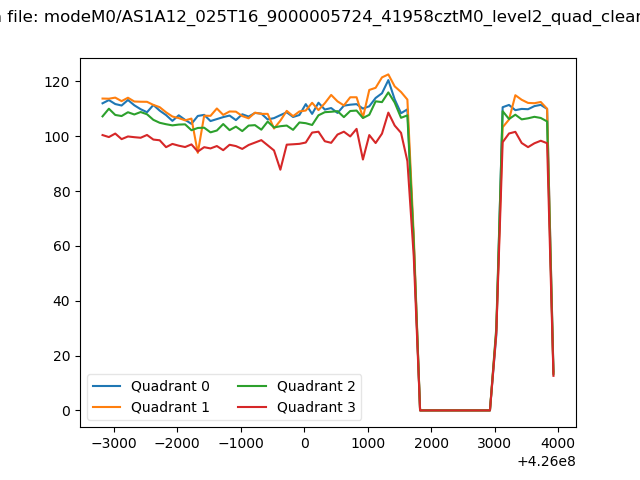 |
|
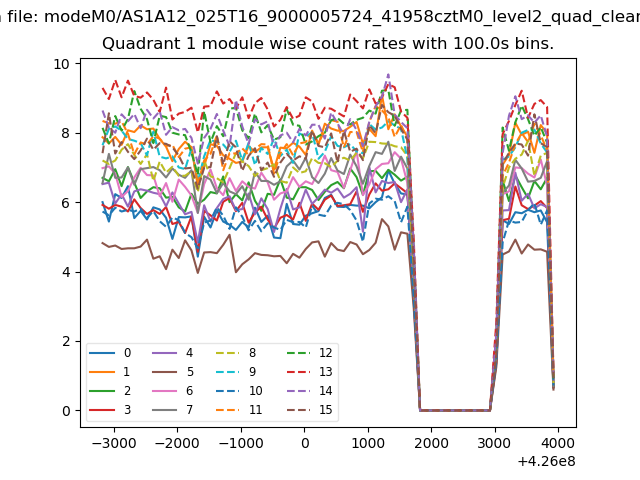
| Module-wise count rates for Quadrant A Data is divided into 100 sec bins |
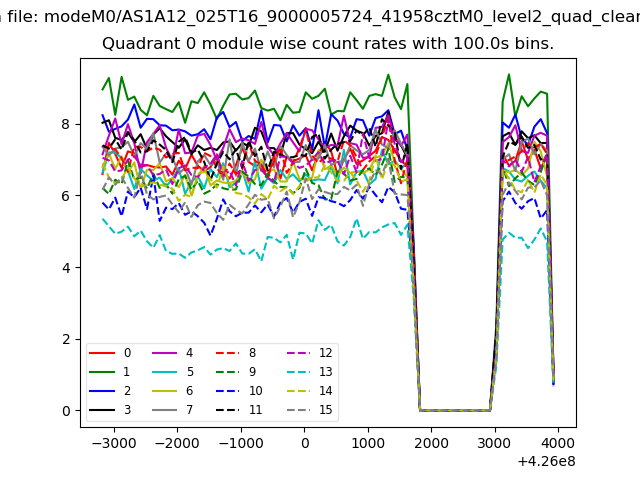 |
 |
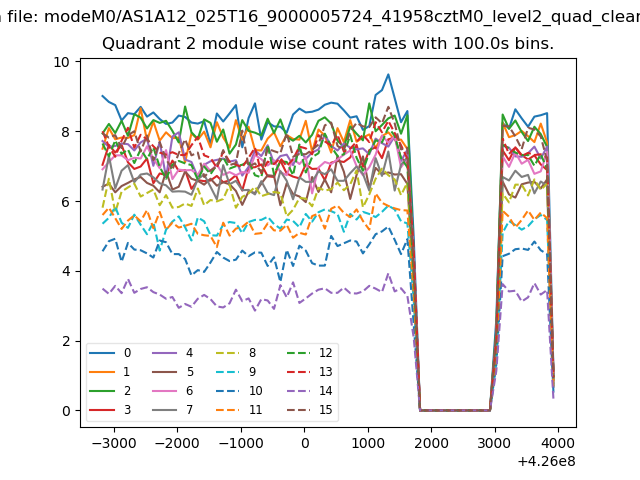
| Module-wise count rates for Quadrant B Data is divided into 100 sec bins |
 |
 |
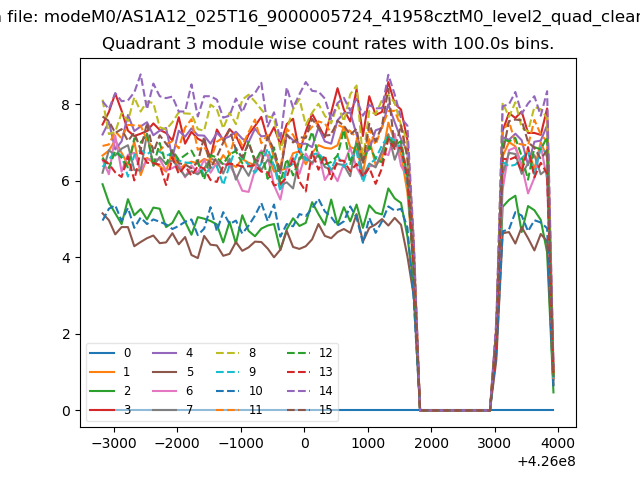
| Module-wise count rates for Quadrant C Data is divided into 100 sec bins |
 |
 |
| Module-wise count rates for Quadrant D Data is divided into 100 sec bins |
 |
 |
| Parameter | Plot |
|---|---|
| CZT HV Monitor |  |
| D_VDD | 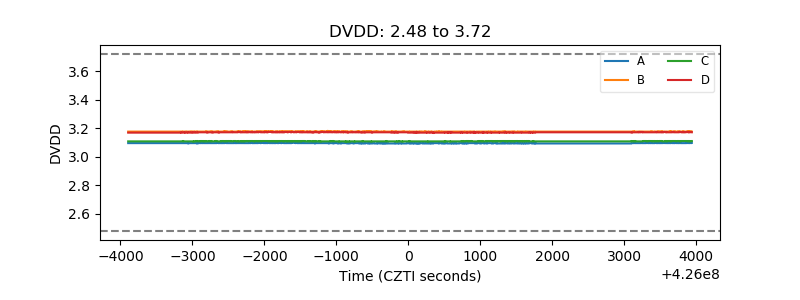 |
| Temperature 1 | 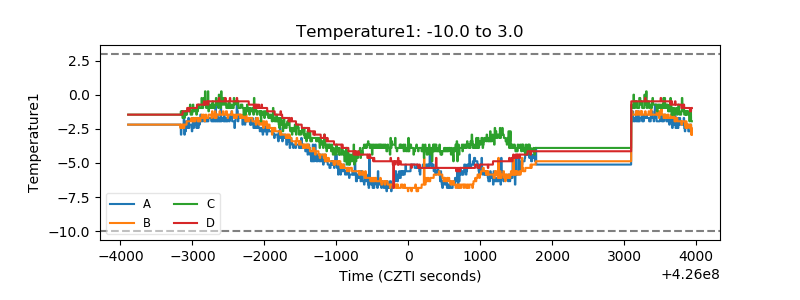 |
| Veto HV Monitor | 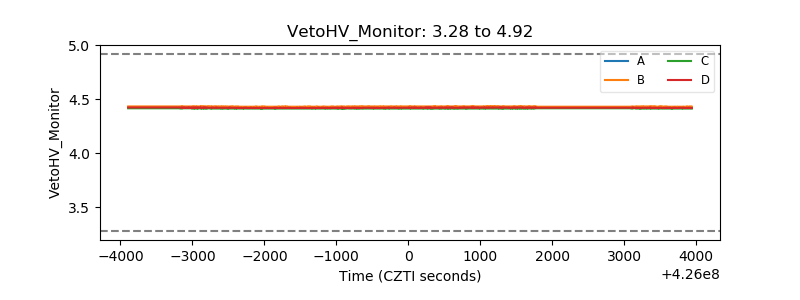 |
| Veto LLD | 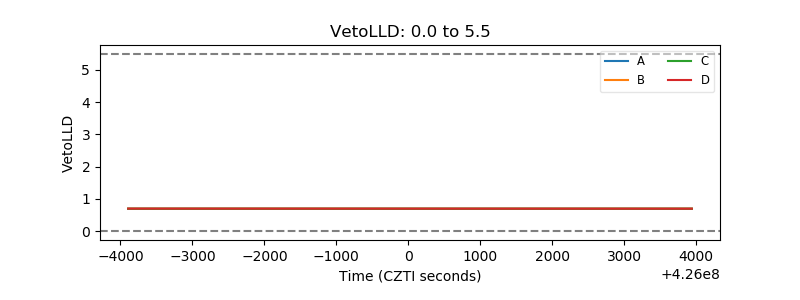 |
| Alpha Counter | 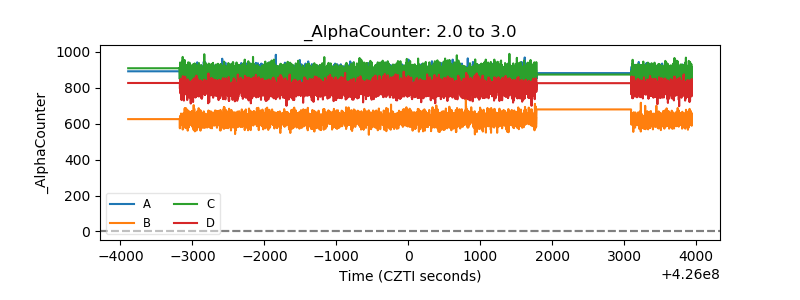 |
| _CPM_Rate | 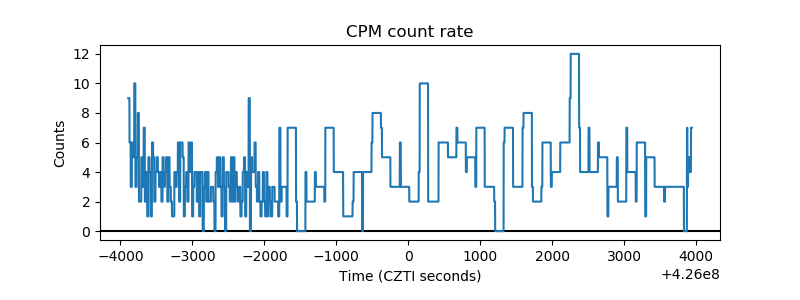 |
| CZT Counter | 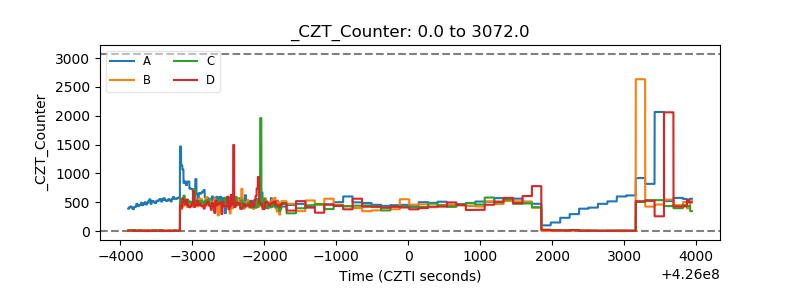 |
| +2.5 Volts monitor | 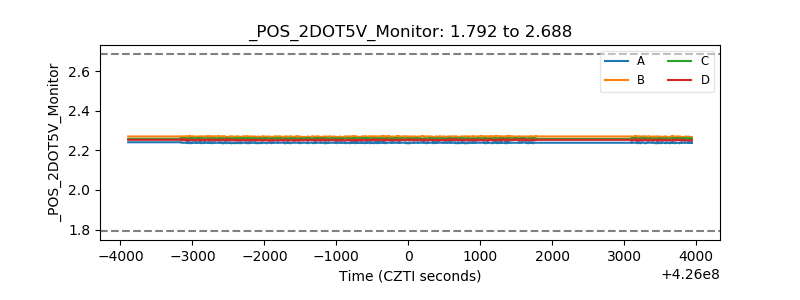 |
| +5 Volts monitor | 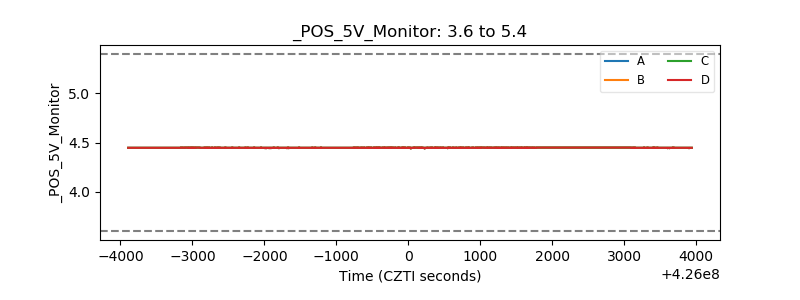 |
| _ROLL_ROT | 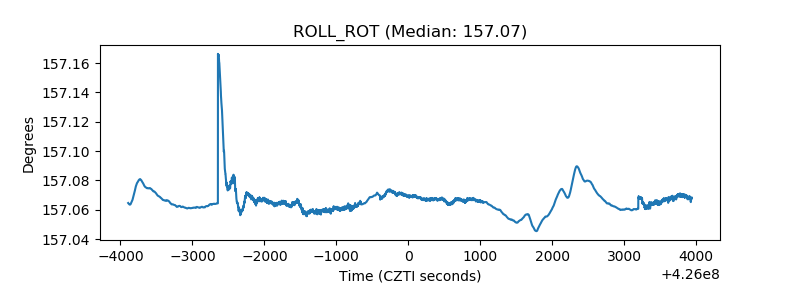 |
| _Roll_DEC | 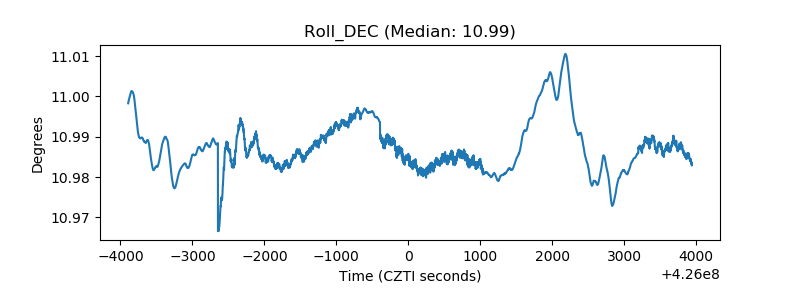 |
| _Roll_RA | 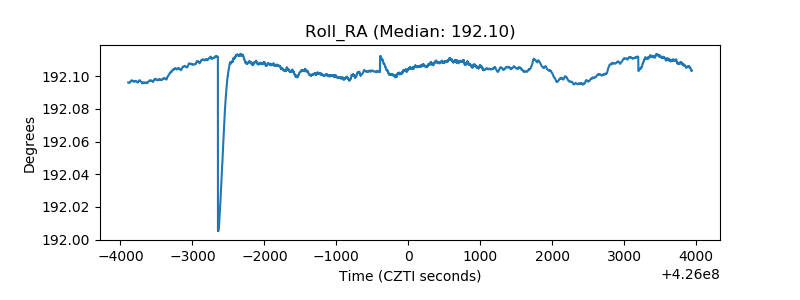 |
| Veto Counter | 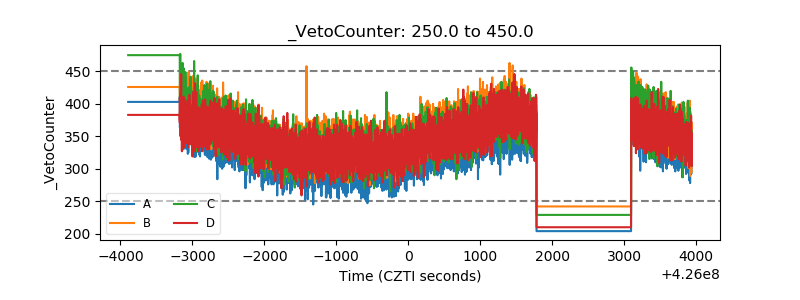 |