| Param | Original file | Final file |
|---|---|---|
| Filename | modeM0/AS1A12_025T16_9000005724_41961cztM0_level2.fits | modeM0/AS1A12_025T16_9000005724_41961cztM0_level2_quad_clean.evt |
| Size (bytes) | 667,687,680 | 171,446,400 |
| Size | 636.8 MB | 163.5 MB |
| Events in quadrant A | 5,806,273 | 1,157,456 |
| Events in quadrant B | 5,242,849 | 1,177,558 |
| Events in quadrant C | 4,954,431 | 1,128,237 |
| Events in quadrant D | 7,874,306 | 979,525 |
| Mode M0 | |||
|---|---|---|---|
| Quadrant | BADHDUFLAG | Total packets | Discarded packets |
| A | 0 | 23800 | 3 |
| B | 0 | 23127 | 3 |
| C | 0 | 21768 | 3 |
| D | 0 | 31039 | 3 |
| Mode M9 | |||
|---|---|---|---|
| Quadrant | BADHDUFLAG | Total packets | Discarded packets |
| A | 0 | 34 | 0 |
| B | 0 | 35 | 0 |
| C | 0 | 35 | 0 |
| D | 0 | 35 | 0 |
| Mode SS | |||
|---|---|---|---|
| Quadrant | BADHDUFLAG | Total packets | Discarded packets |
| A | 0 | 222 | 0 |
| B | 0 | 222 | 0 |
| C | 0 | 222 | 0 |
| D | 0 | 222 | 0 |
| Quadrant | Total seconds | Saturated seconds | Saturation percentage |
|---|---|---|---|
| A | 10800 | 45 | 0.416667% |
| B | 10800 | 95 | 0.879630% |
| C | 10800 | 4 | 0.037037% |
| D | 10800 | 765 | 7.083333% |
Noise dominated data is calculated using 1-second bins in cleaned event files. If a bin has >2000 counts, and if more than 50% of those come from <1% of pixels, then it is considered to be noise-dominated and hence unusable.
| Quadrant | # 1 sec bins | Bins with >0 counts | Bins with >2000 counts | High rate bins dominated by noise | Noise dominated (total time) | Noise dominated (detector-on time) | Marked lightcurve |
|---|---|---|---|---|---|---|---|
| A | 13486 | 10802 | 23 | 23 | 0.17% | 0.21% | 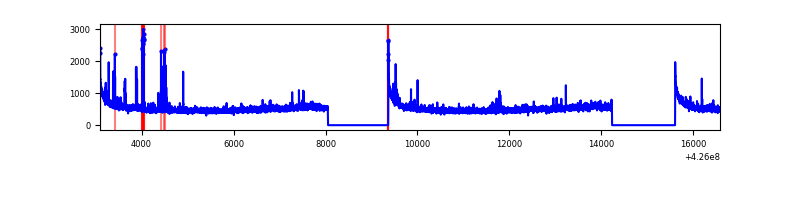 |
| B | 13486 | 10802 | 47 | 47 | 0.35% | 0.44% | 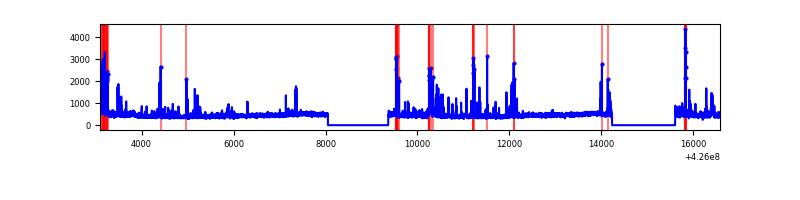 |
| C | 13486 | 10802 | 0 | 0 | 0.00% | 0.00% | 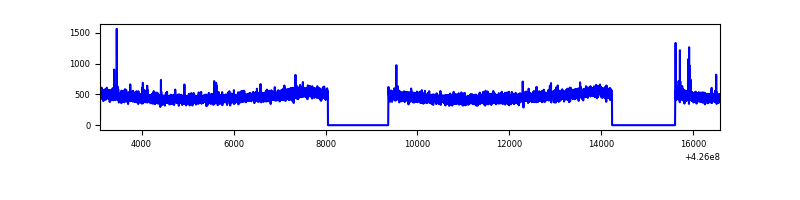 |
| D | 13486 | 10802 | 714 | 714 | 5.29% | 6.61% | 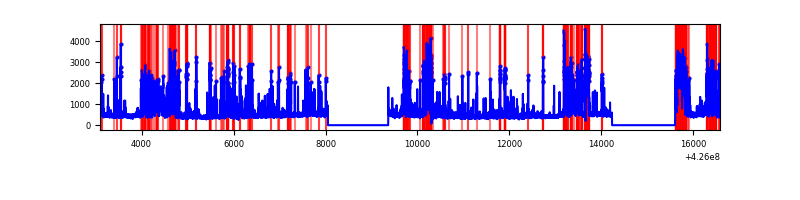 |
Top three noisy pixels from each quadrant. If the there are fewer than three noisy pixels in the level2.evt file, extra rows are filled as -1
| Pixel properties | Quadrant properties | ||||||
|---|---|---|---|---|---|---|---|
| Quadrant | DetID | PixID | Counts | Sigma | Mean | Median | Sigma |
| A | 10 | 83 | 1055659 | 4405.88 | 1172 | 1147 | 239.3 |
| A | 15 | 223 | 113330 | 468.71 | 1172 | 1147 | 239.3 |
| A | 2 | 79 | 64160 | 263.28 | 1172 | 1147 | 239.3 |
| B | 5 | 255 | 326207 | 1444.82 | 1166 | 1135 | 225.0 |
| B | 0 | 190 | 116637 | 513.36 | 1166 | 1135 | 225.0 |
| B | 15 | 85 | 62823 | 274.18 | 1166 | 1135 | 225.0 |
| C | 15 | 214 | 465498 | 1731.11 | 1144 | 1151 | 268.2 |
| C | 15 | 111 | 23939 | 84.95 | 1144 | 1151 | 268.2 |
| C | 13 | 61 | 7562 | 23.9 | 1144 | 1151 | 268.2 |
| D | 13 | 249 | 2184568 | 8029.44 | 1108 | 1078 | 271.9 |
| D | 2 | 120 | 385739 | 1414.53 | 1108 | 1078 | 271.9 |
| D | 5 | 222 | 242062 | 886.18 | 1108 | 1078 | 271.9 |
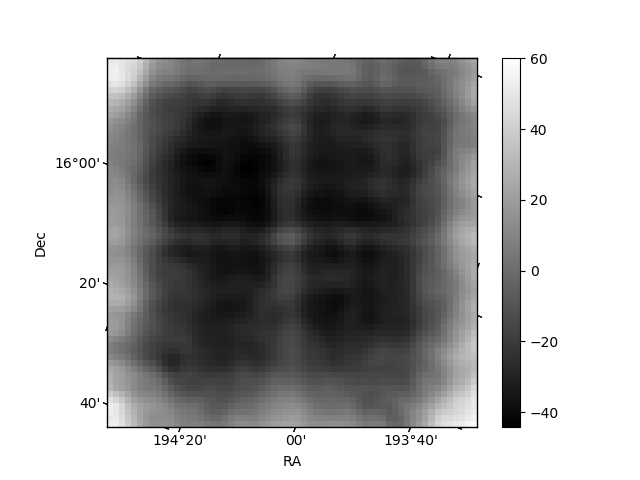
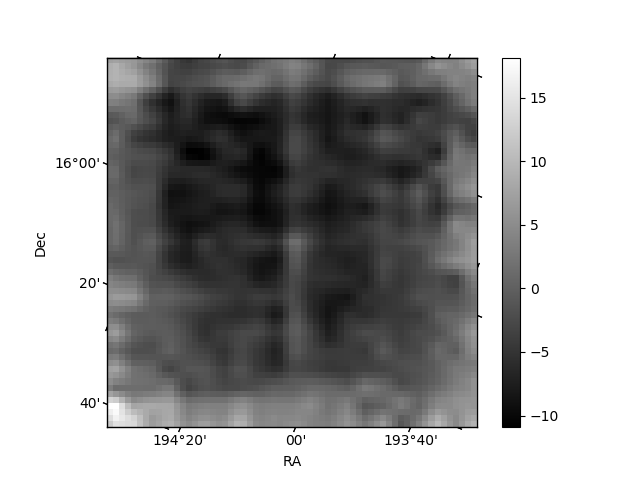
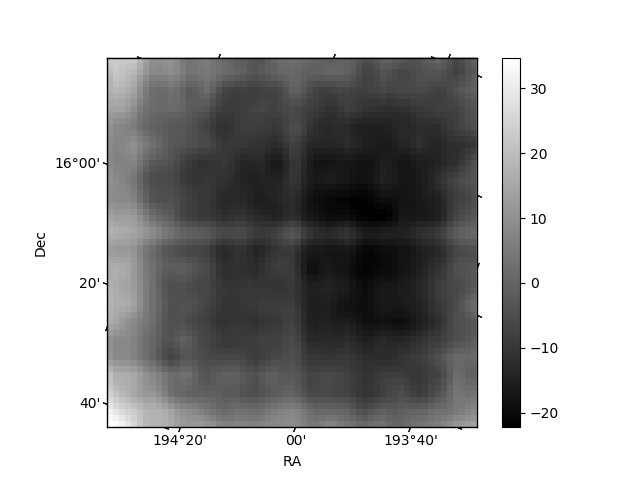
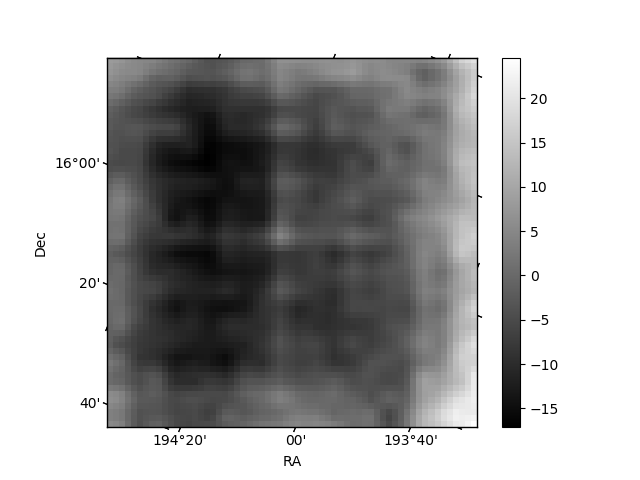
Histogram calculated using DETX and DETY for each event in the final _common_clean file
| Quadrant A | 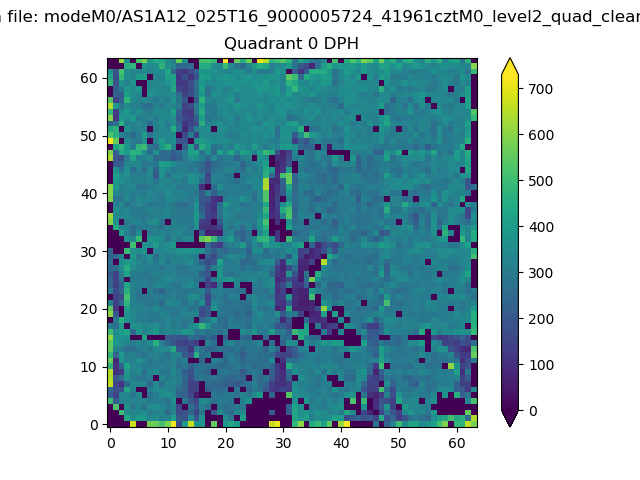 |
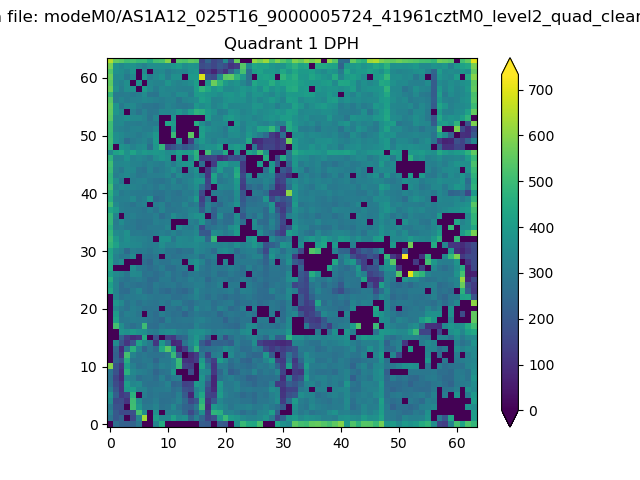 |
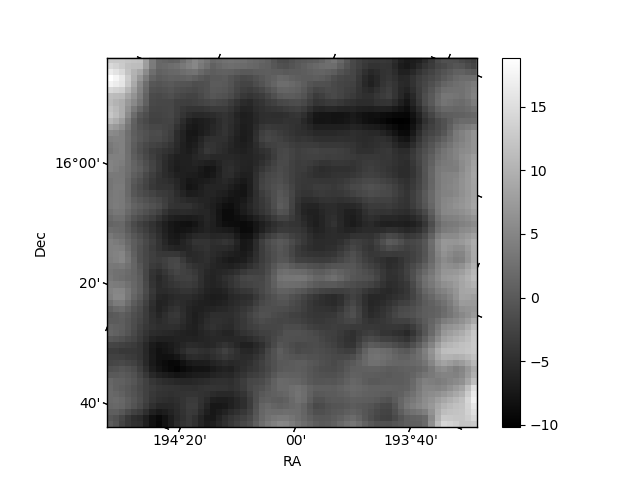
Quadrant B |
|---|---|---|---|
| Quadrant D | 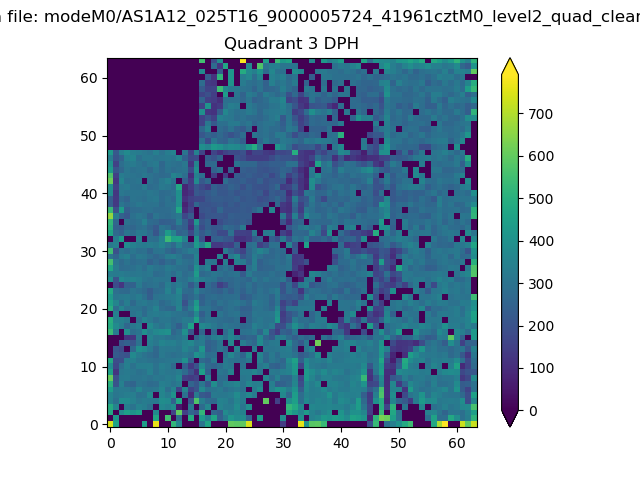 |
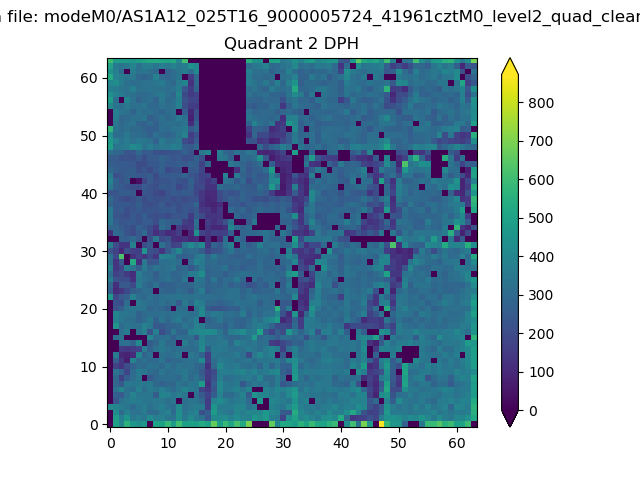 |
Quadrant C |
| Plot type | Count rate plots | Images |
|---|---|---|
| Comparison with Poisson distribution Blue bars denote a histogram of data divided into 1 sec bins. Red curve is a Poisson curve with rate = median count rate of data. |
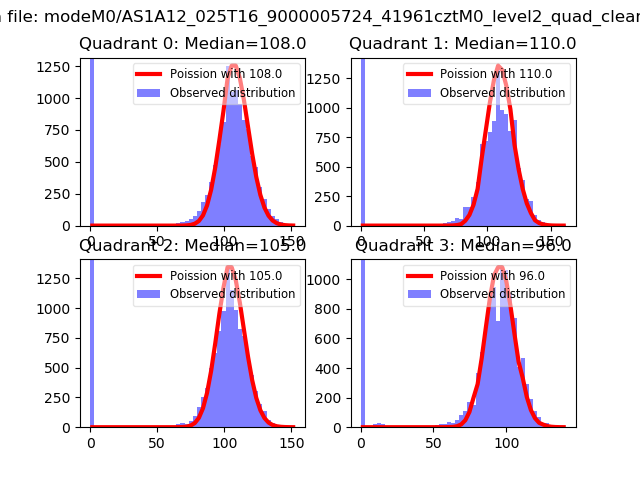 |
 |
| Quadrant-wise count rates Data is divided into 100 sec bins |
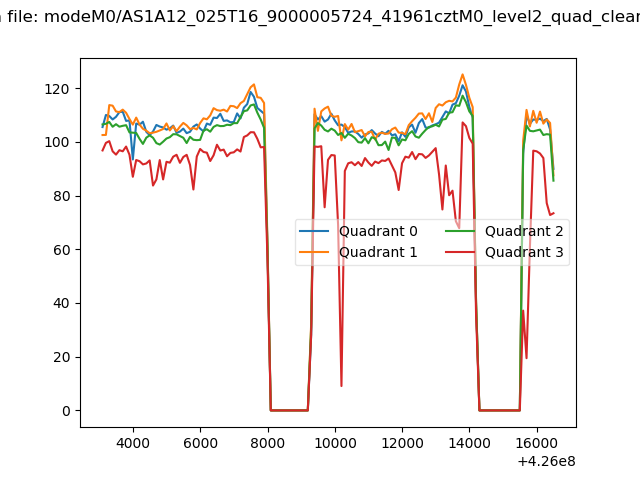 |
|
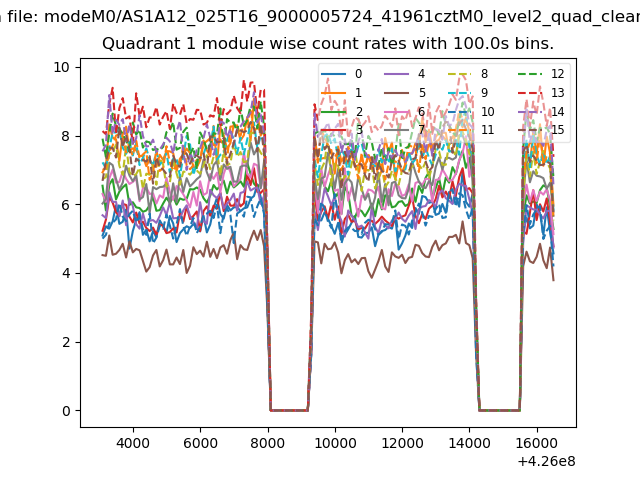
| Module-wise count rates for Quadrant A Data is divided into 100 sec bins |
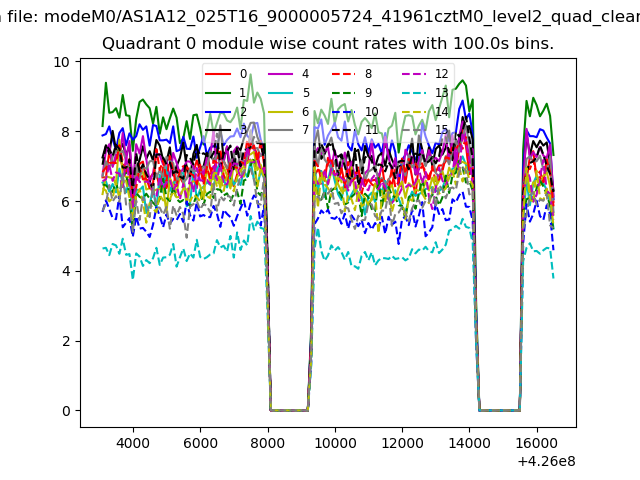 |
 |
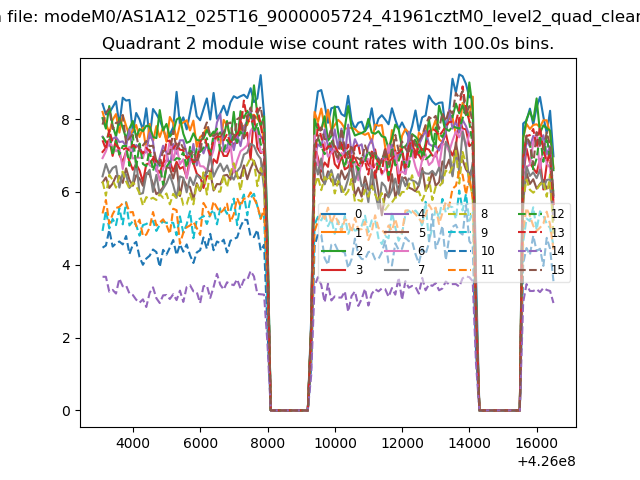
| Module-wise count rates for Quadrant B Data is divided into 100 sec bins |
 |
 |
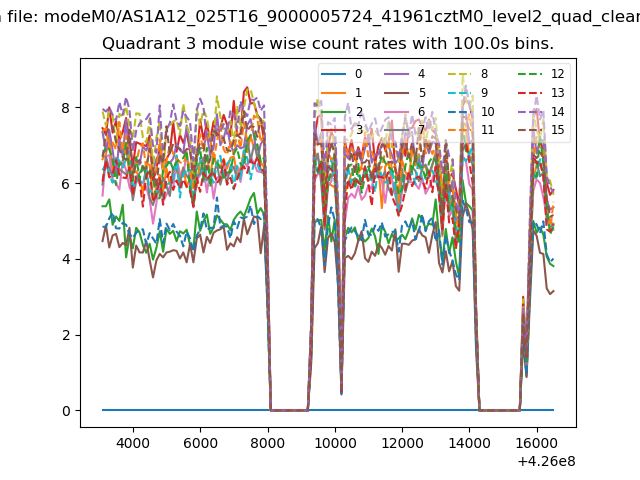
| Module-wise count rates for Quadrant C Data is divided into 100 sec bins |
 |
 |
| Module-wise count rates for Quadrant D Data is divided into 100 sec bins |
 |
 |
| Parameter | Plot |
|---|---|
| CZT HV Monitor | 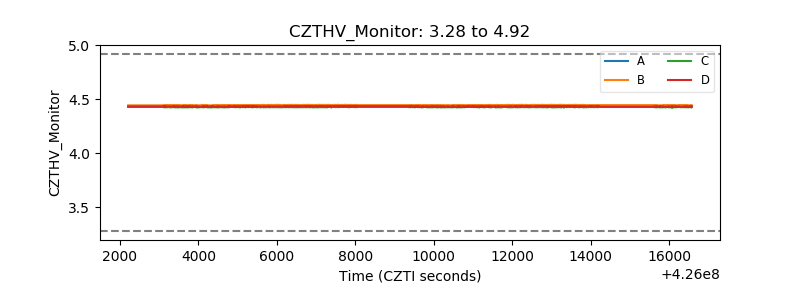 |
| D_VDD | 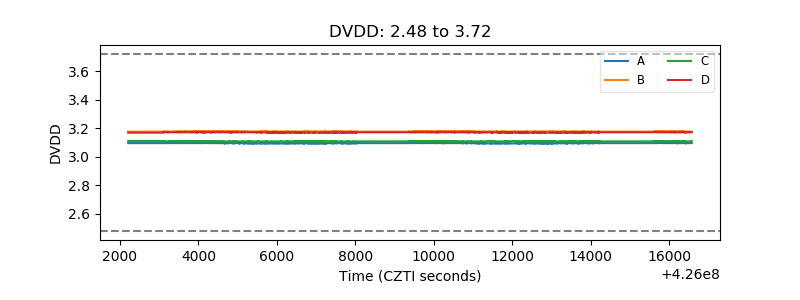 |
| Temperature 1 |  |
| Veto HV Monitor | 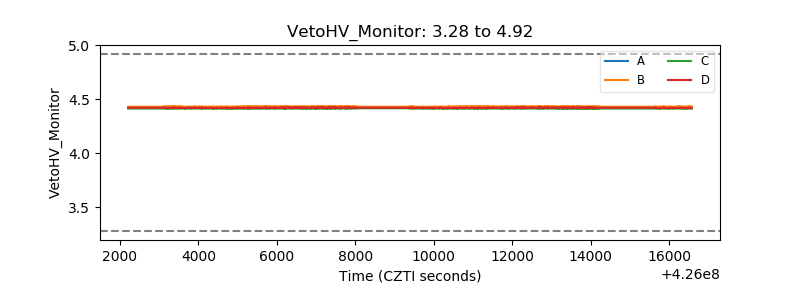 |
| Veto LLD | 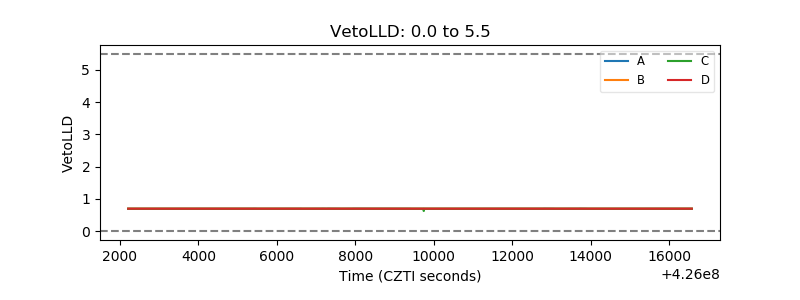 |
| Alpha Counter | 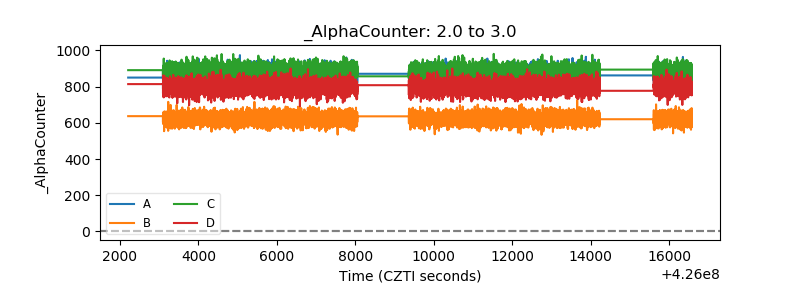 |
| _CPM_Rate | 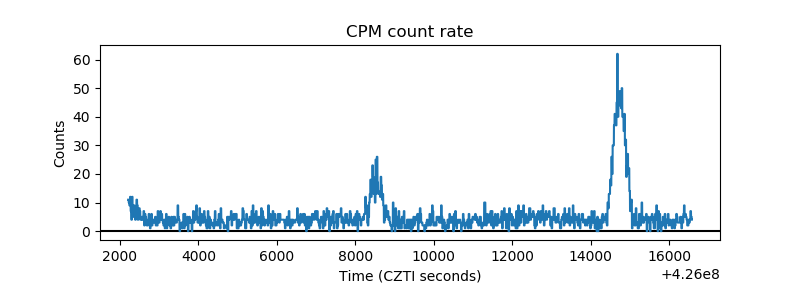 |
| CZT Counter | 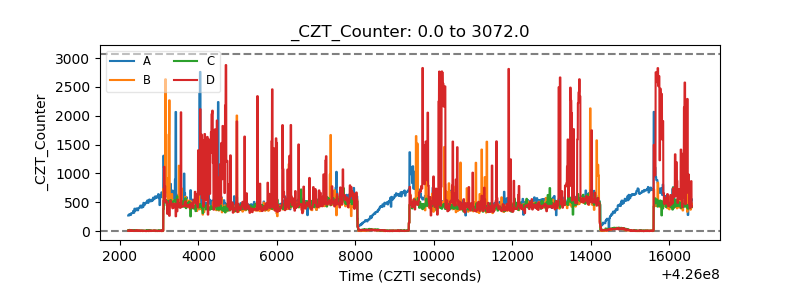 |
| +2.5 Volts monitor | 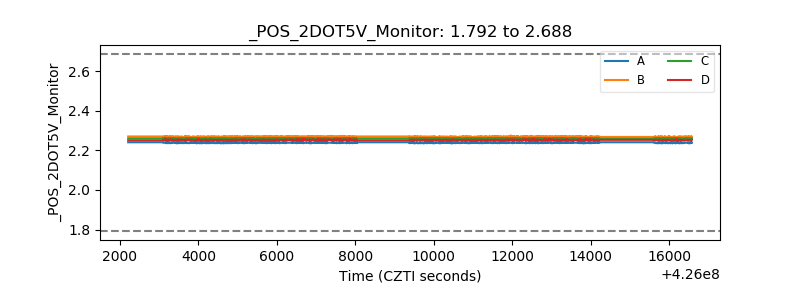 |
| +5 Volts monitor | 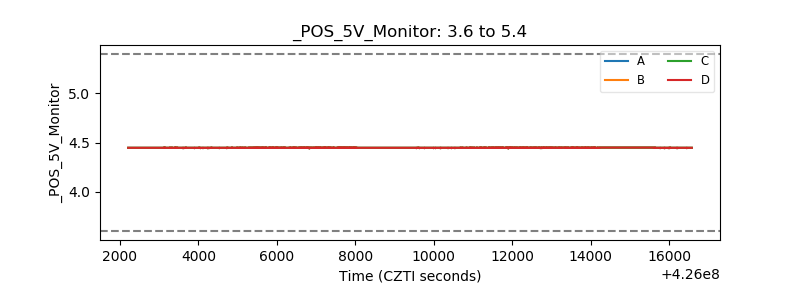 |
| _ROLL_ROT | 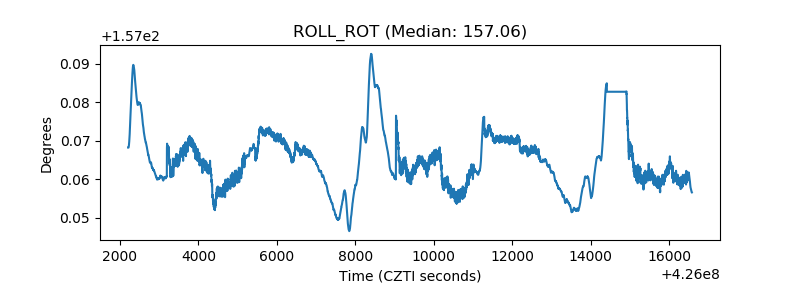 |
| _Roll_DEC | 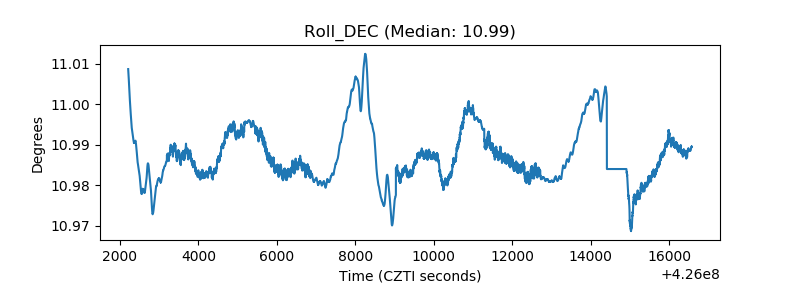 |
| _Roll_RA |  |
| Veto Counter | 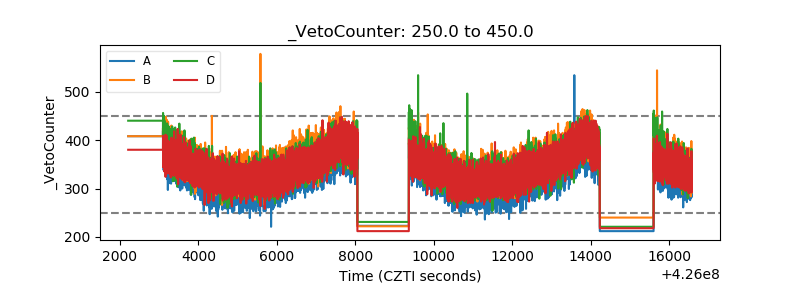 |