| Param | Original file | Final file |
|---|---|---|
| Filename | modeM0/AS1A12_104T01_9000005728_41970cztM0_level2.fits | modeM0/AS1A12_104T01_9000005728_41970cztM0_level2_quad_clean.evt |
| Size (bytes) | 64,895,040 | 18,218,880 |
| Size | 61.9 MB | 17.4 MB |
| Events in quadrant A | 654,853 | 120,465 |
| Events in quadrant B | 511,255 | 125,597 |
| Events in quadrant C | 521,396 | 116,741 |
| Events in quadrant D | 624,244 | 104,240 |
| Mode SS | |||
|---|---|---|---|
| Quadrant | BADHDUFLAG | Total packets | Discarded packets |
| A | 0 | 24 | 0 |
| B | 0 | 24 | 0 |
| C | 0 | 24 | 0 |
| D | 0 | 24 | 0 |
| Mode M0 | |||
|---|---|---|---|
| Quadrant | BADHDUFLAG | Total packets | Discarded packets |
| A | 0 | 2607 | 2 |
| B | 0 | 2283 | 1 |
| C | 0 | 2245 | 1 |
| D | 0 | 2668 | 1 |
| Mode M9 | |||
|---|---|---|---|
| Quadrant | BADHDUFLAG | Total packets | Discarded packets |
| A | 0 | 19 | 0 |
| B | 0 | 19 | 0 |
| C | 0 | 19 | 0 |
| D | 0 | 19 | 0 |
| Quadrant | Total seconds | Saturated seconds | Saturation percentage |
|---|---|---|---|
| A | 1118 | 5 | 0.447227% |
| B | 1118 | 1 | 0.089445% |
| C | 1118 | 2 | 0.178891% |
| D | 1118 | 36 | 3.220036% |
Noise dominated data is calculated using 1-second bins in cleaned event files. If a bin has >2000 counts, and if more than 50% of those come from <1% of pixels, then it is considered to be noise-dominated and hence unusable.
| Quadrant | # 1 sec bins | Bins with >0 counts | Bins with >2000 counts | High rate bins dominated by noise | Noise dominated (total time) | Noise dominated (detector-on time) | Marked lightcurve |
|---|---|---|---|---|---|---|---|
| A | 3031 | 1119 | 0 | 0 | 0.00% | 0.00% | 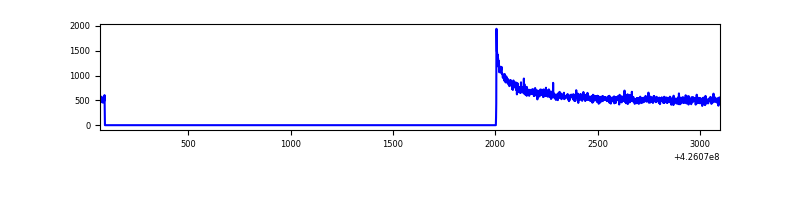 |
| B | 3031 | 1119 | 0 | 0 | 0.00% | 0.00% | 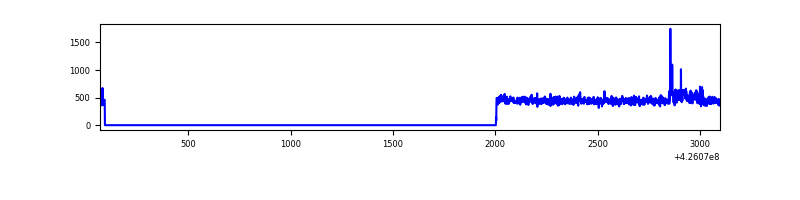 |
| C | 3031 | 1119 | 0 | 0 | 0.00% | 0.00% | 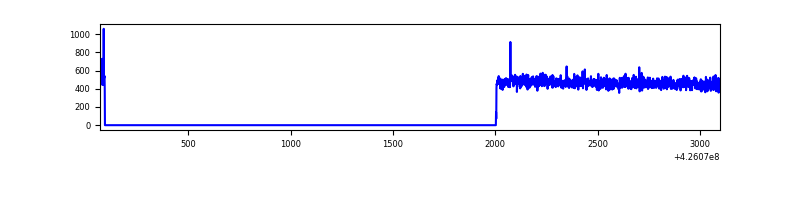 |
| D | 3031 | 1119 | 35 | 35 | 1.15% | 3.13% | 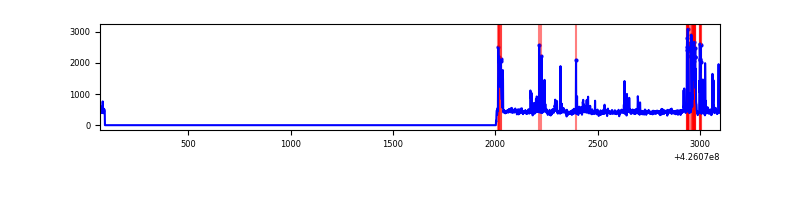 |
Top three noisy pixels from each quadrant. If the there are fewer than three noisy pixels in the level2.evt file, extra rows are filled as -1
| Pixel properties | Quadrant properties | ||||||
|---|---|---|---|---|---|---|---|
| Quadrant | DetID | PixID | Counts | Sigma | Mean | Median | Sigma |
| A | 10 | 83 | 162679 | 5889.95 | 125 | 123 | 27.6 |
| A | 13 | 6 | 3020 | 104.97 | 125 | 123 | 27.6 |
| A | 2 | 79 | 1658 | 55.62 | 125 | 123 | 27.6 |
| B | 0 | 156 | 14375 | 547.21 | 123 | 120 | 26.1 |
| B | 3 | 112 | 4976 | 186.41 | 123 | 120 | 26.1 |
| B | 12 | 111 | 3207 | 118.5 | 123 | 120 | 26.1 |
| C | 15 | 214 | 54328 | 1825.55 | 119 | 119 | 29.7 |
| C | 8 | 79 | 2796 | 90.15 | 119 | 119 | 29.7 |
| C | 13 | 61 | 798 | 22.87 | 119 | 119 | 29.7 |
| D | 13 | 249 | 94759 | 3120.26 | 117 | 113 | 30.3 |
| D | 12 | 218 | 31185 | 1024.37 | 117 | 113 | 30.3 |
| D | 12 | 6 | 22797 | 747.84 | 117 | 113 | 30.3 |
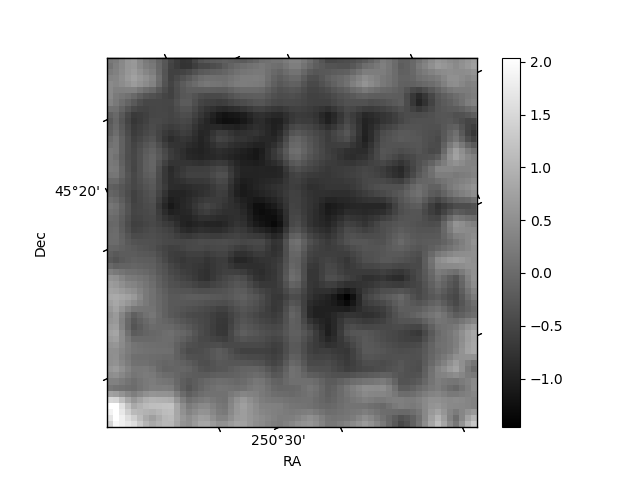
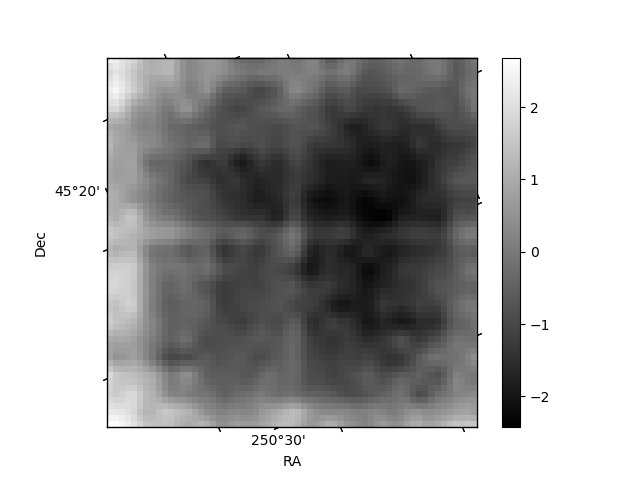
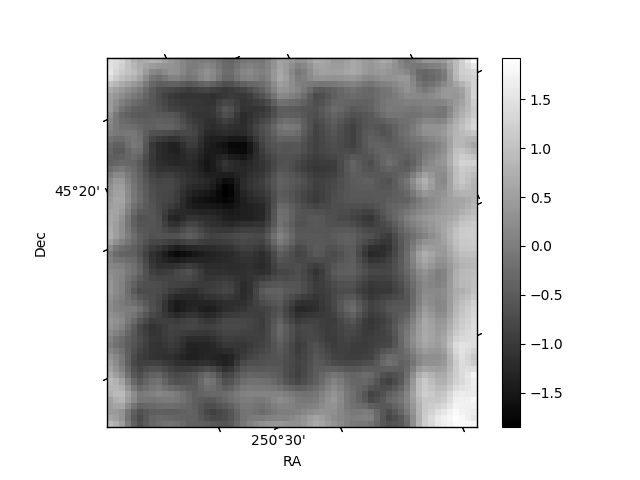
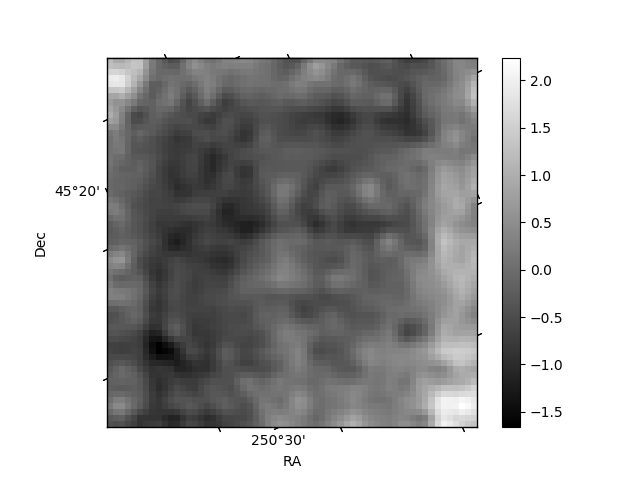
Histogram calculated using DETX and DETY for each event in the final _common_clean file
| Quadrant A | 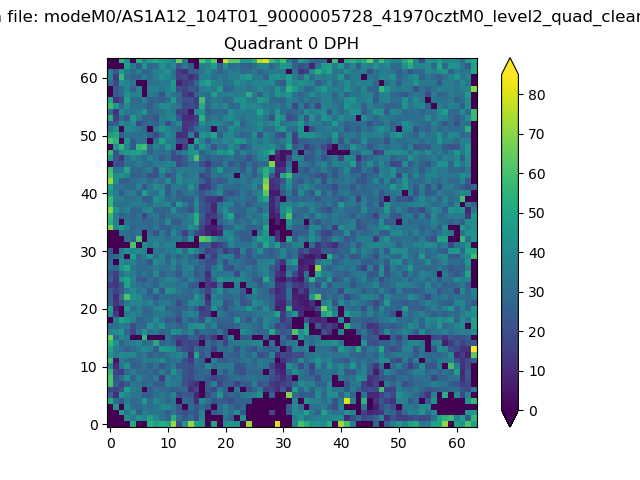 |
 |
Quadrant B |
|---|---|---|---|
| Quadrant D |  |
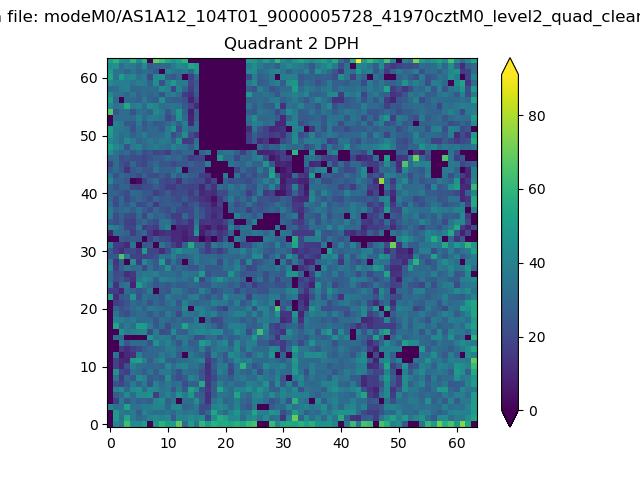 |
Quadrant C |
| Plot type | Count rate plots | Images |
|---|---|---|
| Comparison with Poisson distribution Blue bars denote a histogram of data divided into 1 sec bins. Red curve is a Poisson curve with rate = median count rate of data. |
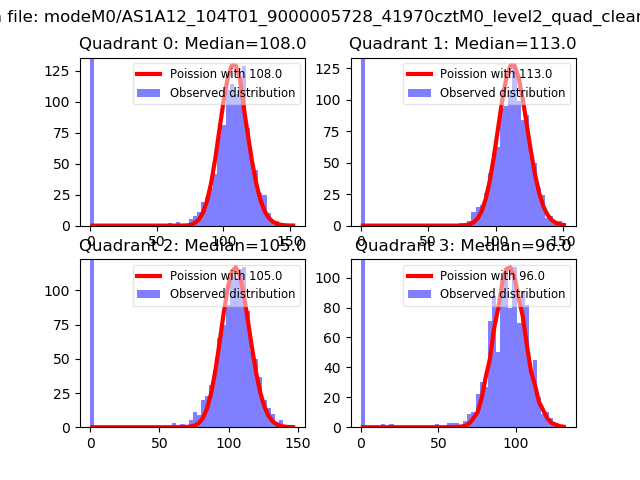 |
 |
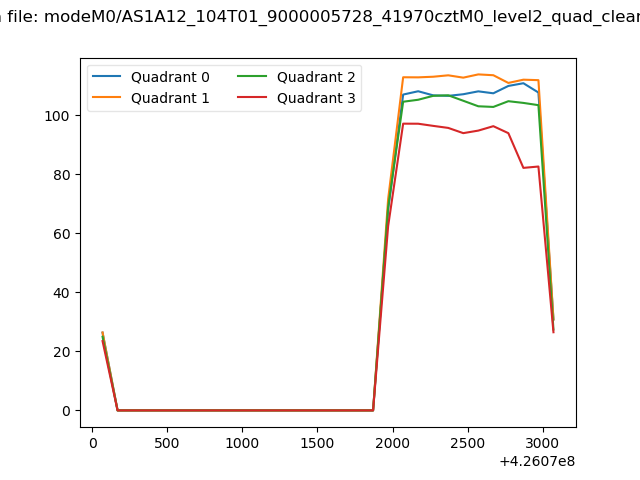
| Quadrant-wise count rates Data is divided into 100 sec bins |
 |
|
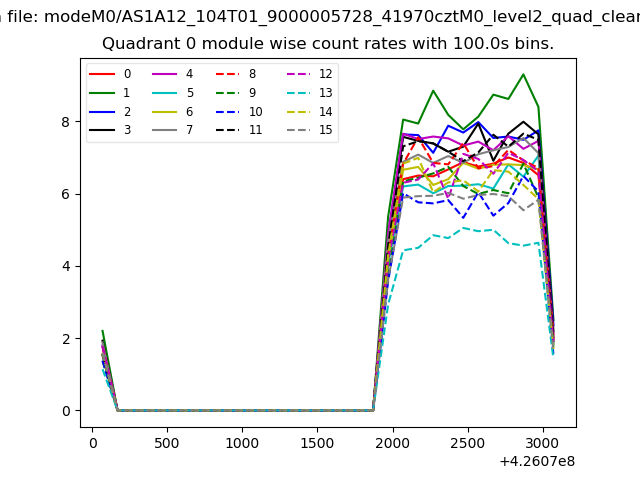
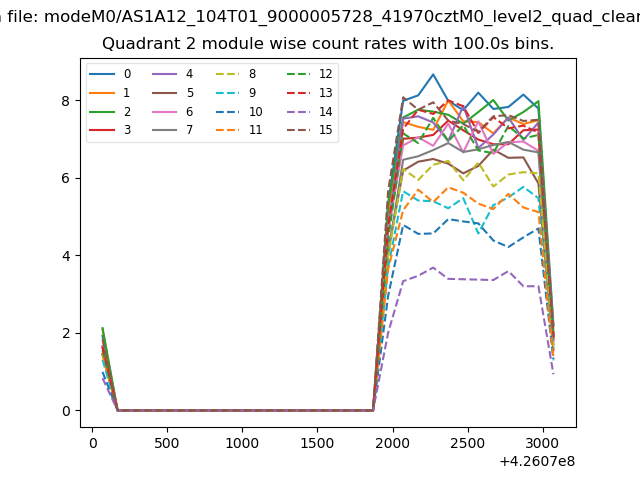
| Module-wise count rates for Quadrant A Data is divided into 100 sec bins |
 |
 |
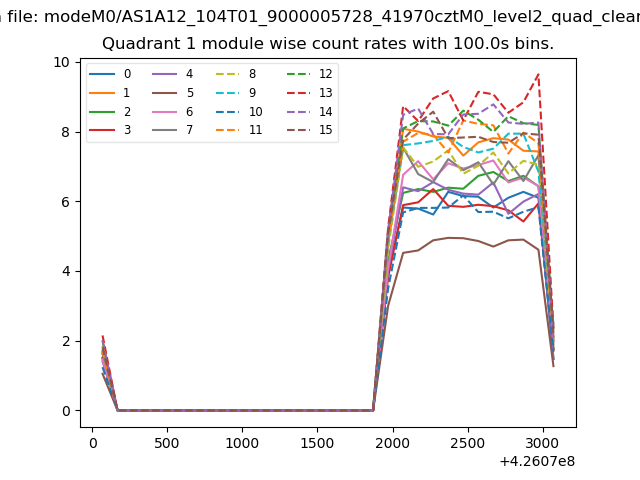
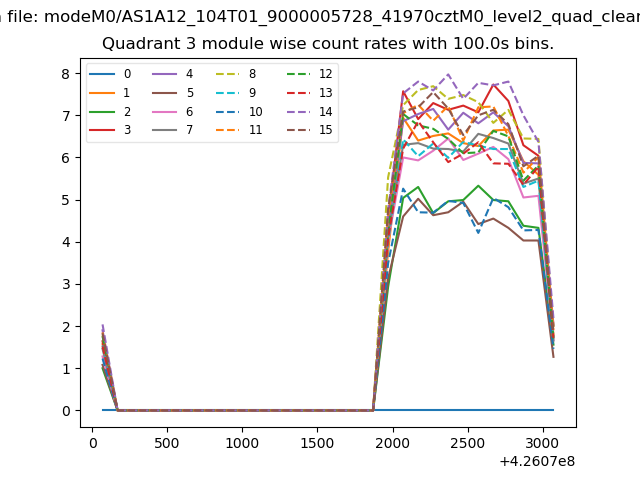
| Module-wise count rates for Quadrant B Data is divided into 100 sec bins |
 |
 |
| Module-wise count rates for Quadrant C Data is divided into 100 sec bins |
 |
 |
| Module-wise count rates for Quadrant D Data is divided into 100 sec bins |
 |
 |
| Parameter | Plot |
|---|---|
| CZT HV Monitor | 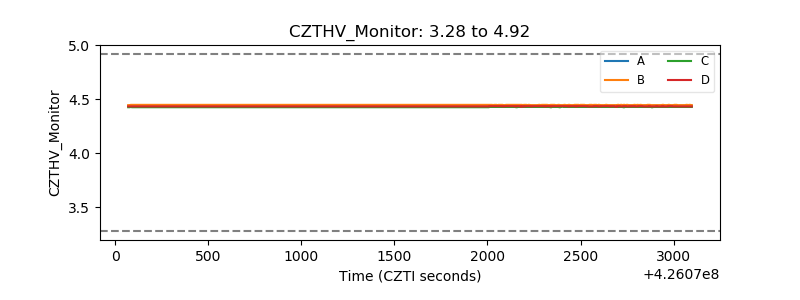 |
| D_VDD | 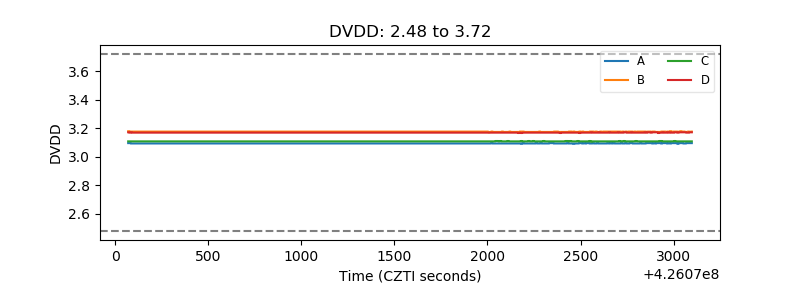 |
| Temperature 1 | 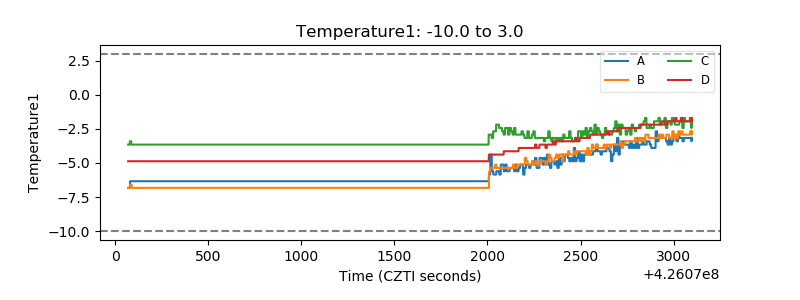 |
| Veto HV Monitor |  |
| Veto LLD | 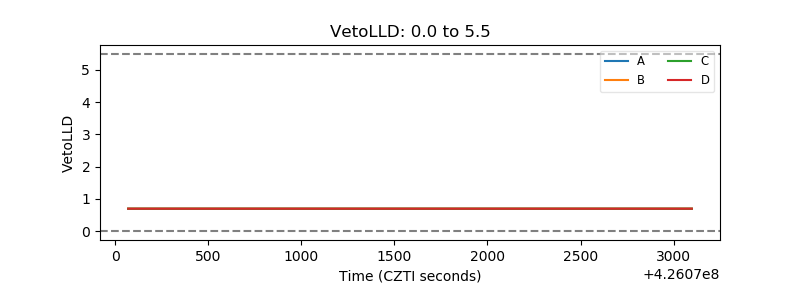 |
| Alpha Counter | 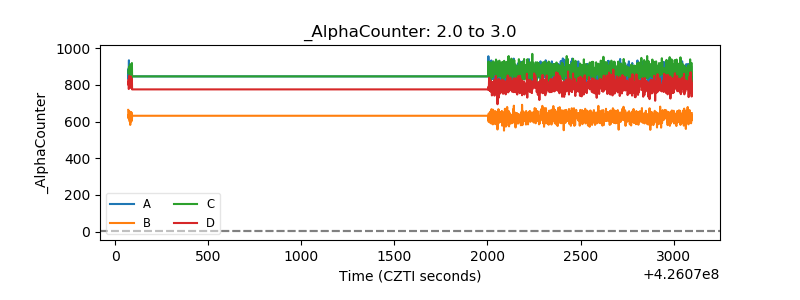 |
| _CPM_Rate |  |
| CZT Counter | 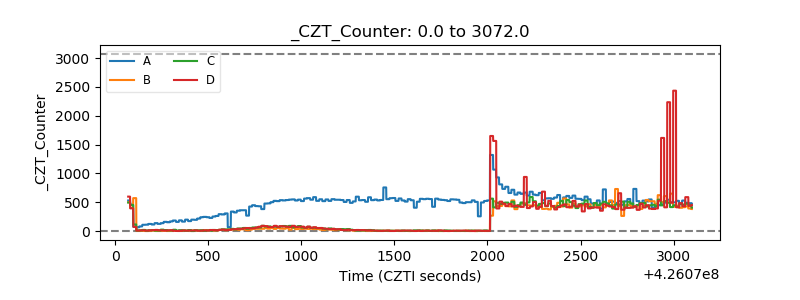 |
| +2.5 Volts monitor |  |
| +5 Volts monitor | 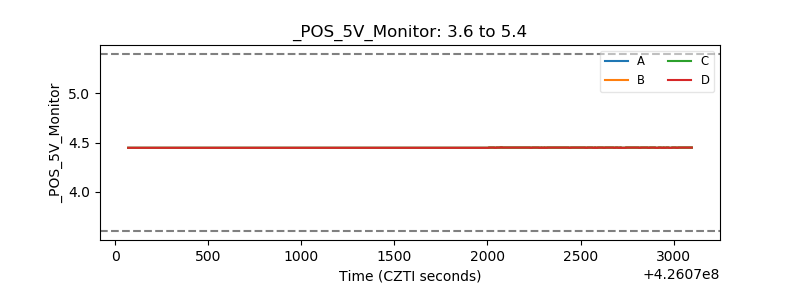 |
| _ROLL_ROT | 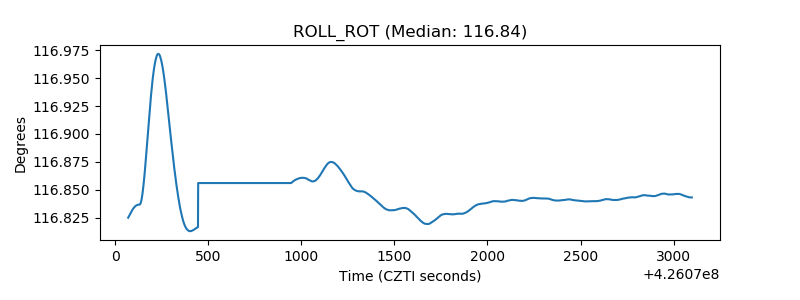 |
| _Roll_DEC | 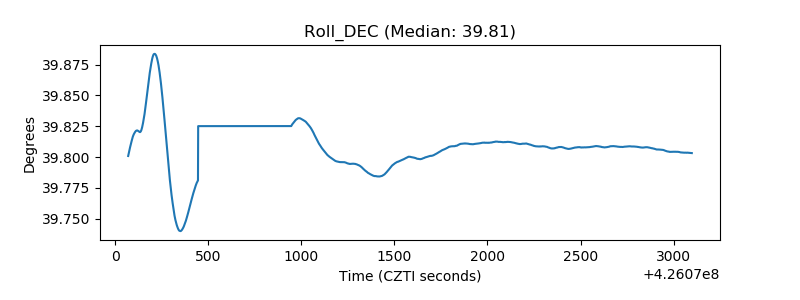 |
| _Roll_RA | 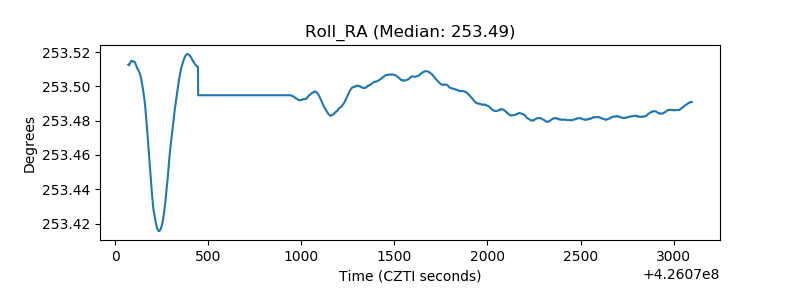 |
| Veto Counter | 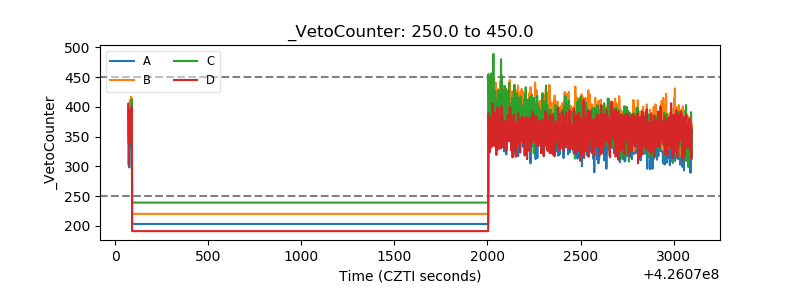 |