| Param | Original file | Final file |
|---|---|---|
| Filename | modeM0/AS1A12_104T01_9000005728_41971cztM0_level2.fits | modeM0/AS1A12_104T01_9000005728_41971cztM0_level2_quad_clean.evt |
| Size (bytes) | 306,843,840 | 93,539,520 |
| Size | 292.6 MB | 89.2 MB |
| Events in quadrant A | 2,987,321 | 627,396 |
| Events in quadrant B | 2,496,321 | 643,975 |
| Events in quadrant C | 2,613,823 | 607,478 |
| Events in quadrant D | 2,818,101 | 556,492 |
| Mode SS | |||
|---|---|---|---|
| Quadrant | BADHDUFLAG | Total packets | Discarded packets |
| A | 0 | 116 | 0 |
| B | 0 | 116 | 0 |
| C | 0 | 116 | 0 |
| D | 0 | 116 | 0 |
| Mode M0 | |||
|---|---|---|---|
| Quadrant | BADHDUFLAG | Total packets | Discarded packets |
| A | 0 | 12211 | 3 |
| B | 0 | 11459 | 2 |
| C | 0 | 11373 | 2 |
| D | 0 | 12549 | 2 |
| Mode M9 | |||
|---|---|---|---|
| Quadrant | BADHDUFLAG | Total packets | Discarded packets |
| A | 0 | 24 | 0 |
| B | 0 | 24 | 0 |
| C | 0 | 24 | 0 |
| D | 0 | 25 | 0 |
| Quadrant | Total seconds | Saturated seconds | Saturation percentage |
|---|---|---|---|
| A | 5677 | 9 | 0.158534% |
| B | 5677 | 5 | 0.088075% |
| C | 5677 | 4 | 0.070460% |
| D | 5677 | 80 | 1.409195% |
Noise dominated data is calculated using 1-second bins in cleaned event files. If a bin has >2000 counts, and if more than 50% of those come from <1% of pixels, then it is considered to be noise-dominated and hence unusable.
| Quadrant | # 1 sec bins | Bins with >0 counts | Bins with >2000 counts | High rate bins dominated by noise | Noise dominated (total time) | Noise dominated (detector-on time) | Marked lightcurve |
|---|---|---|---|---|---|---|---|
| A | 7200 | 5678 | 2 | 2 | 0.03% | 0.04% | 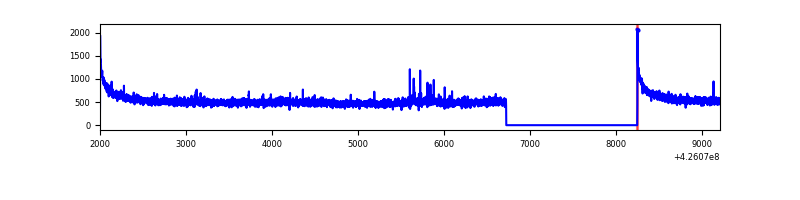 |
| B | 7200 | 5678 | 1 | 1 | 0.01% | 0.02% | 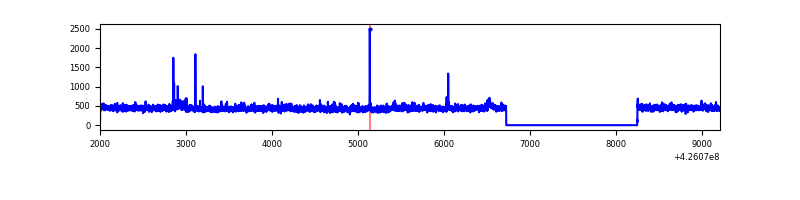 |
| C | 7200 | 5678 | 0 | 0 | 0.00% | 0.00% |  |
| D | 7200 | 5678 | 68 | 68 | 0.94% | 1.20% | 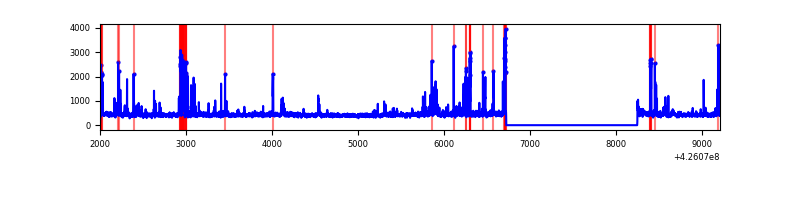 |
Top three noisy pixels from each quadrant. If the there are fewer than three noisy pixels in the level2.evt file, extra rows are filled as -1
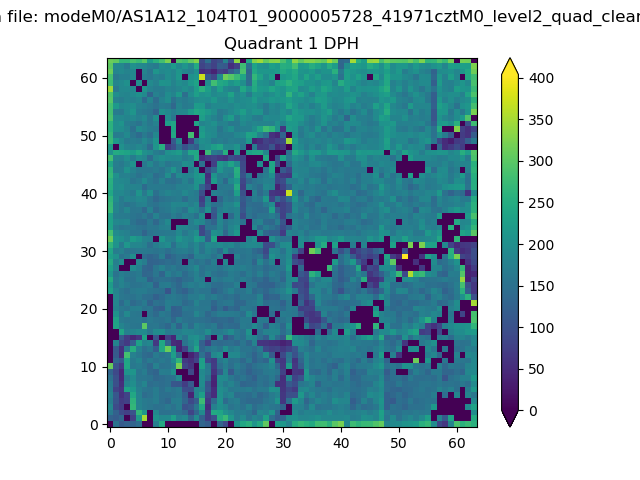
| Pixel properties | Quadrant properties | ||||||
|---|---|---|---|---|---|---|---|
| Quadrant | DetID | PixID | Counts | Sigma | Mean | Median | Sigma |
| A | 10 | 83 | 548787 | 4292.99 | 622 | 609 | 127.7 |
| A | 2 | 79 | 23646 | 180.41 | 622 | 609 | 127.7 |
| A | 13 | 6 | 9731 | 71.43 | 622 | 609 | 127.7 |
| B | 0 | 190 | 44995 | 372.04 | 614 | 598 | 119.3 |
| B | 5 | 255 | 17795 | 144.11 | 614 | 598 | 119.3 |
| B | 12 | 111 | 15204 | 122.39 | 614 | 598 | 119.3 |
| C | 15 | 214 | 251376 | 1778.7 | 605 | 606 | 141.0 |
| C | 13 | 61 | 4016 | 24.19 | 605 | 606 | 141.0 |
| C | 8 | 79 | 3964 | 23.82 | 605 | 606 | 141.0 |
| D | 13 | 249 | 227830 | 1527.24 | 602 | 585 | 148.8 |
| D | 2 | 120 | 78402 | 522.98 | 602 | 585 | 148.8 |
| D | 12 | 6 | 51264 | 340.6 | 602 | 585 | 148.8 |
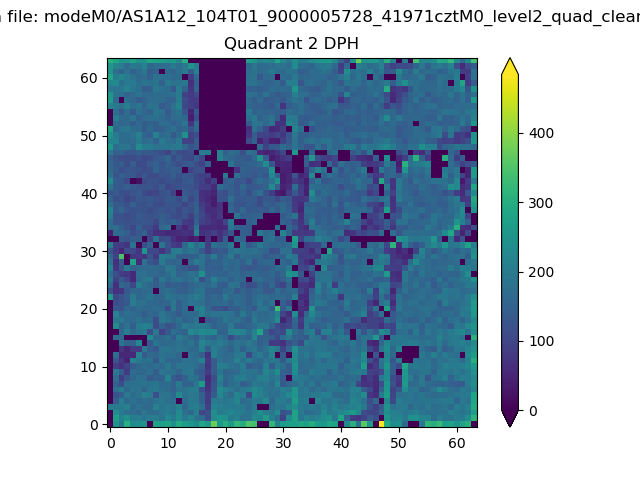
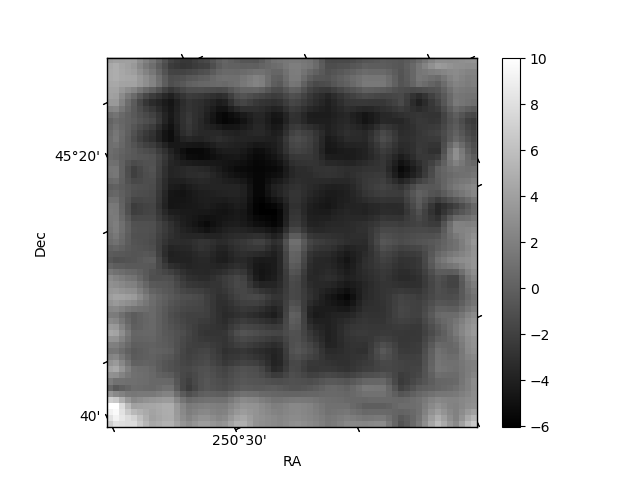
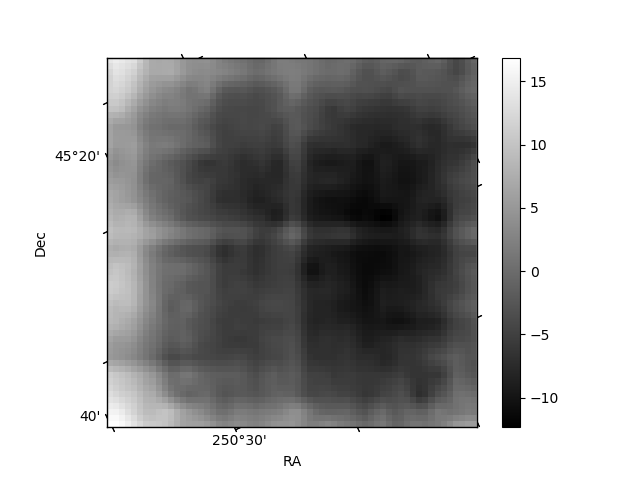
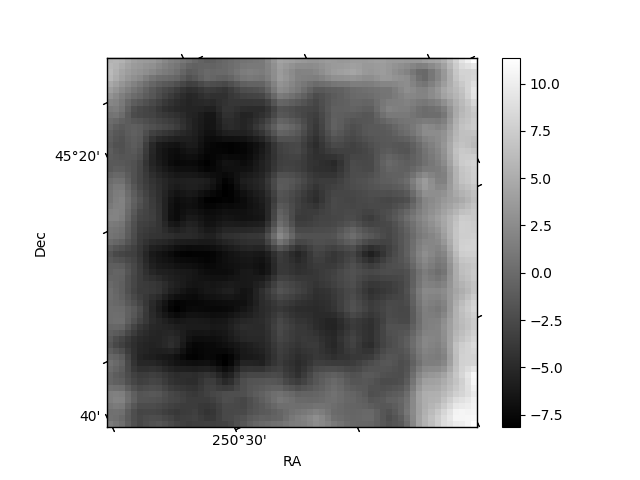
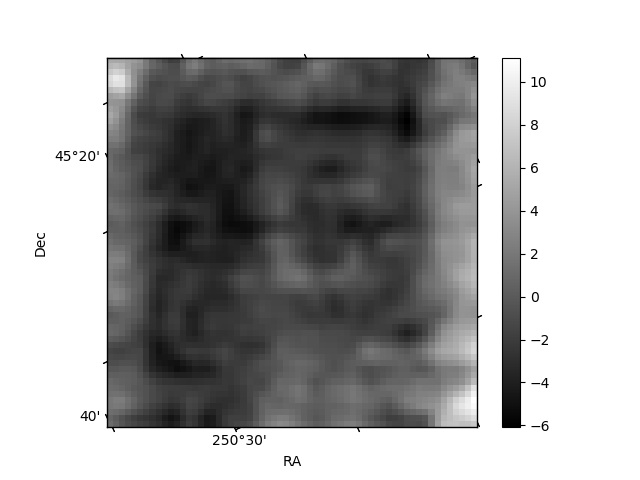
Histogram calculated using DETX and DETY for each event in the final _common_clean file
| Quadrant A |  |
 |
Quadrant B |
|---|---|---|---|
| Quadrant D | 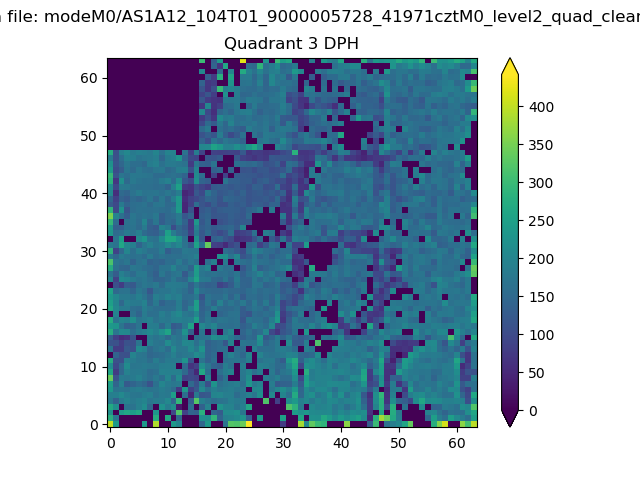 |
 |
Quadrant C |
| Plot type | Count rate plots | Images |
|---|---|---|
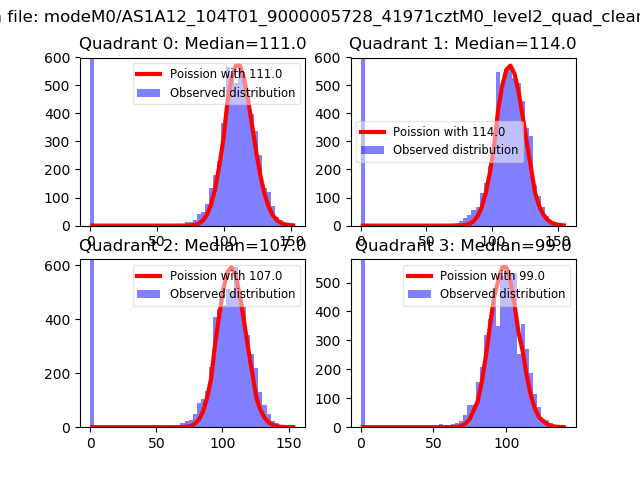
| Comparison with Poisson distribution Blue bars denote a histogram of data divided into 1 sec bins. Red curve is a Poisson curve with rate = median count rate of data. |
 |
 |
| Quadrant-wise count rates Data is divided into 100 sec bins |
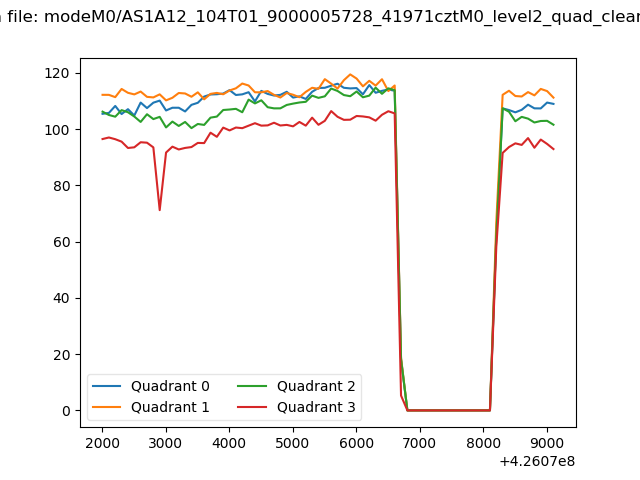 |
|
| Module-wise count rates for Quadrant A Data is divided into 100 sec bins |
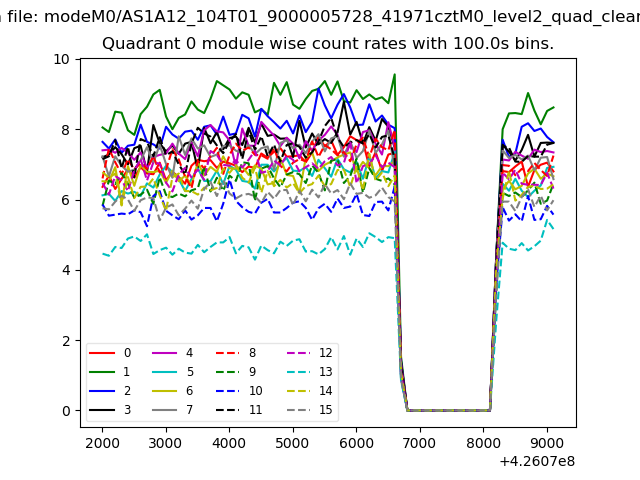 |
 |
| Module-wise count rates for Quadrant B Data is divided into 100 sec bins |
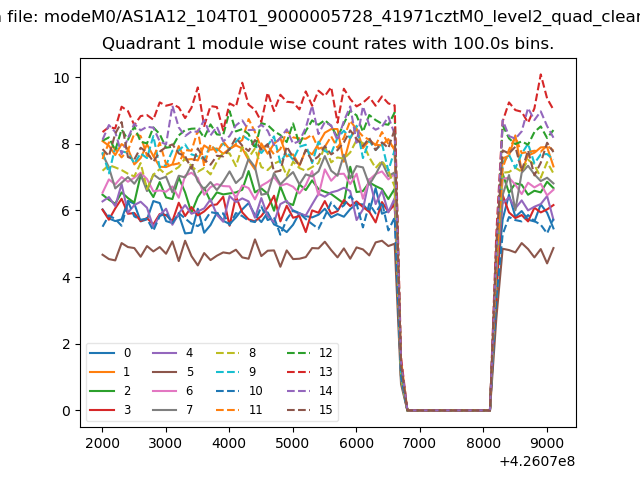 |
 |
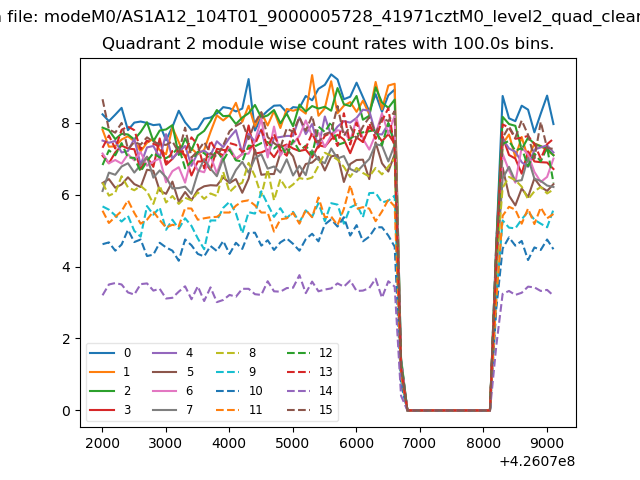
| Module-wise count rates for Quadrant C Data is divided into 100 sec bins |
 |
 |
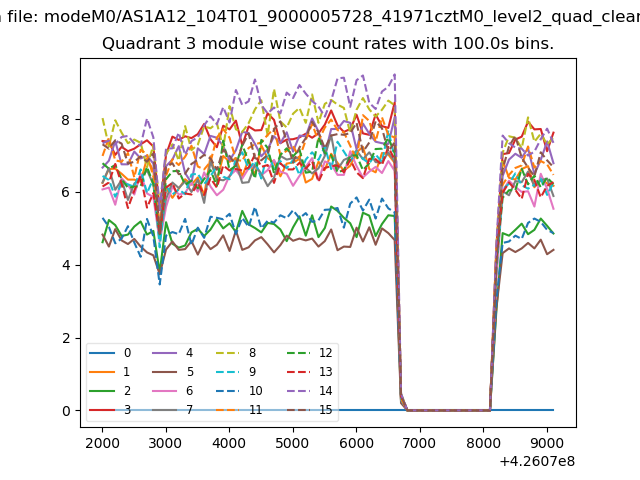
| Module-wise count rates for Quadrant D Data is divided into 100 sec bins |
 |
 |
| Parameter | Plot |
|---|---|
| CZT HV Monitor | 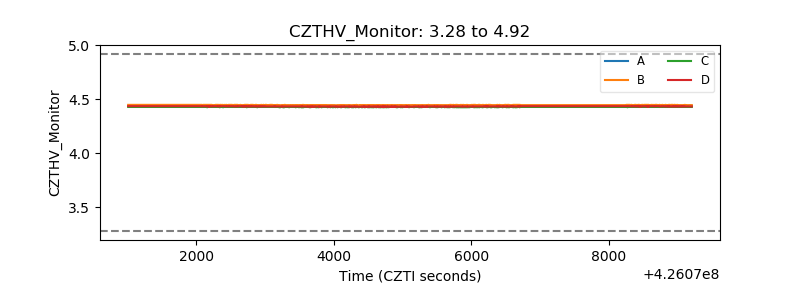 |
| D_VDD | 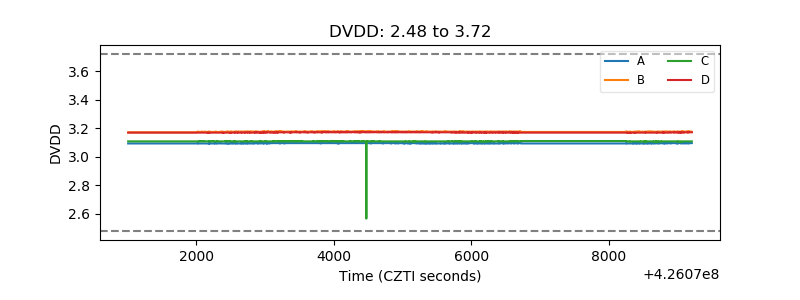 |
| Temperature 1 | 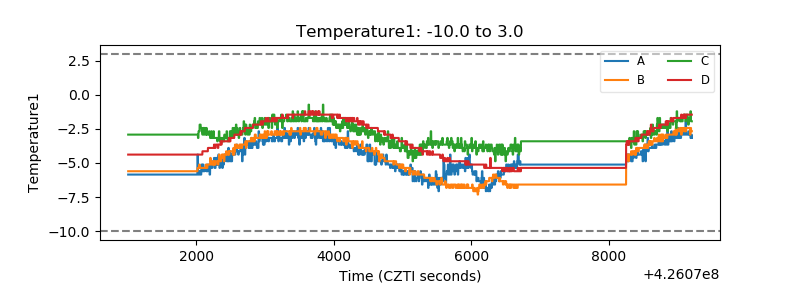 |
| Veto HV Monitor | 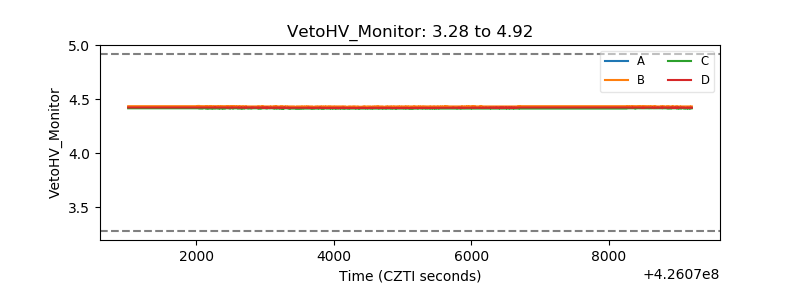 |
| Veto LLD | 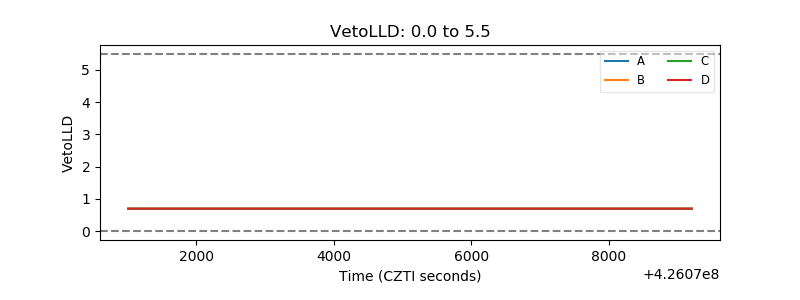 |
| Alpha Counter | 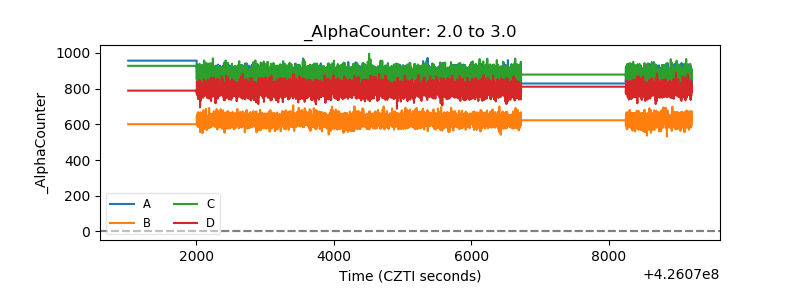 |
| _CPM_Rate |  |
| CZT Counter | 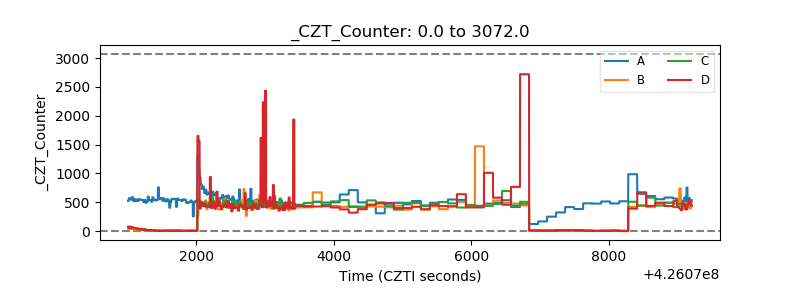 |
| +2.5 Volts monitor |  |
| +5 Volts monitor | 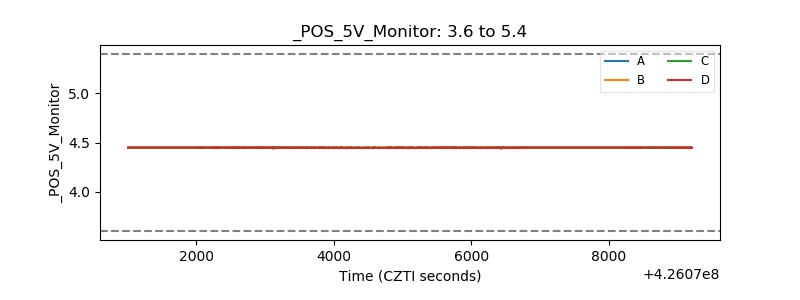 |
| _ROLL_ROT | 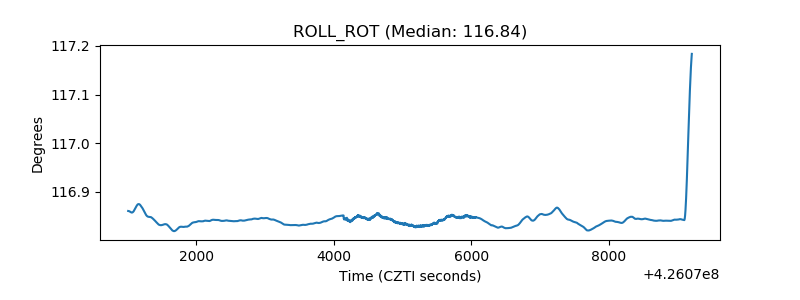 |
| _Roll_DEC | 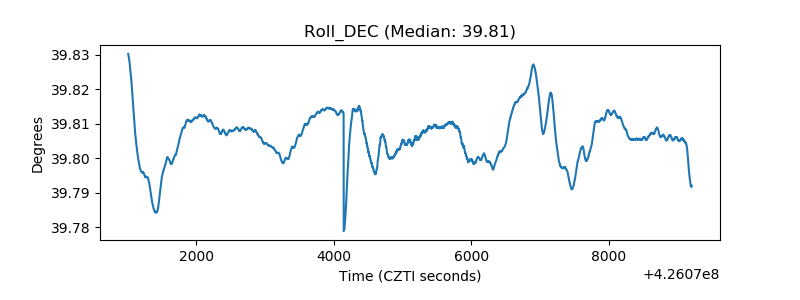 |
| _Roll_RA | 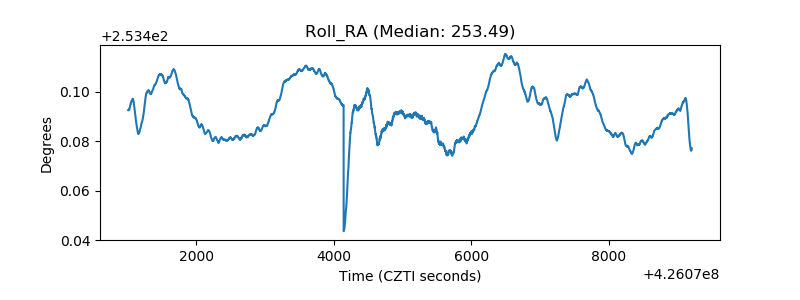 |
| Veto Counter | 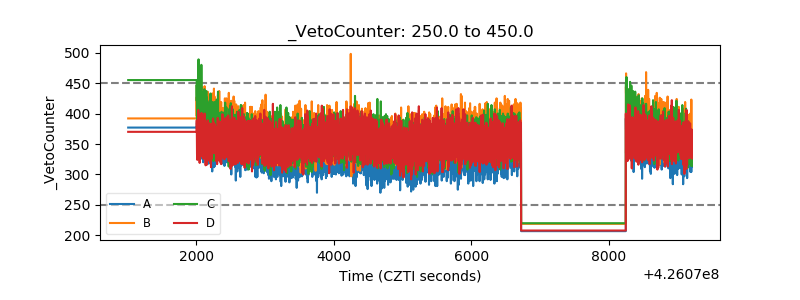 |