| Param | Original file | Final file |
|---|---|---|
| Filename | modeM0/AS1A12_104T01_9000005728_41973cztM0_level2.fits | modeM0/AS1A12_104T01_9000005728_41973cztM0_level2_quad_clean.evt |
| Size (bytes) | 328,628,160 | 97,565,760 |
| Size | 313.4 MB | 93.0 MB |
| Events in quadrant A | 3,150,567 | 653,567 |
| Events in quadrant B | 2,627,280 | 664,922 |
| Events in quadrant C | 2,749,317 | 635,074 |
| Events in quadrant D | 3,172,297 | 583,244 |
| Mode SS | |||
|---|---|---|---|
| Quadrant | BADHDUFLAG | Total packets | Discarded packets |
| A | 0 | 122 | 0 |
| B | 0 | 122 | 0 |
| C | 0 | 122 | 0 |
| D | 0 | 122 | 0 |
| Mode M0 | |||
|---|---|---|---|
| Quadrant | BADHDUFLAG | Total packets | Discarded packets |
| A | 0 | 13046 | 3 |
| B | 0 | 12088 | 2 |
| C | 0 | 11993 | 2 |
| D | 0 | 13702 | 2 |
| Mode M9 | |||
|---|---|---|---|
| Quadrant | BADHDUFLAG | Total packets | Discarded packets |
| A | 0 | 13 | 0 |
| B | 0 | 13 | 0 |
| C | 0 | 13 | 0 |
| D | 0 | 13 | 0 |
| Quadrant | Total seconds | Saturated seconds | Saturation percentage |
|---|---|---|---|
| A | 5971 | 22 | 0.368447% |
| B | 5971 | 10 | 0.167476% |
| C | 5971 | 1 | 0.016748% |
| D | 5971 | 92 | 1.540780% |
Noise dominated data is calculated using 1-second bins in cleaned event files. If a bin has >2000 counts, and if more than 50% of those come from <1% of pixels, then it is considered to be noise-dominated and hence unusable.
| Quadrant | # 1 sec bins | Bins with >0 counts | Bins with >2000 counts | High rate bins dominated by noise | Noise dominated (total time) | Noise dominated (detector-on time) | Marked lightcurve |
|---|---|---|---|---|---|---|---|
| A | 7255 | 5972 | 8 | 8 | 0.11% | 0.13% | 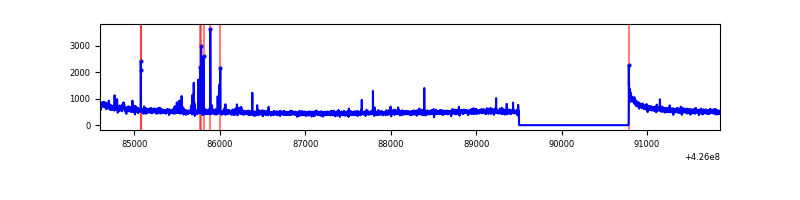 |
| B | 7255 | 5972 | 3 | 3 | 0.04% | 0.05% | 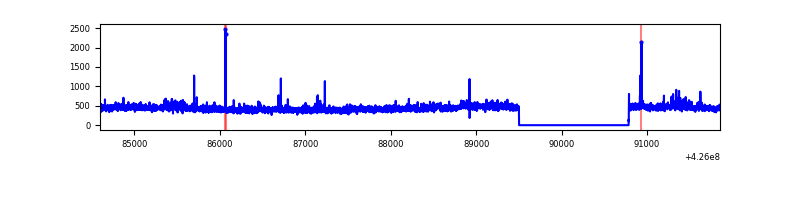 |
| C | 7255 | 5972 | 0 | 0 | 0.00% | 0.00% | 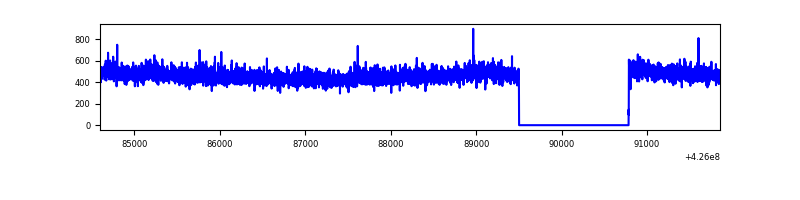 |
| D | 7255 | 5972 | 73 | 73 | 1.01% | 1.22% | 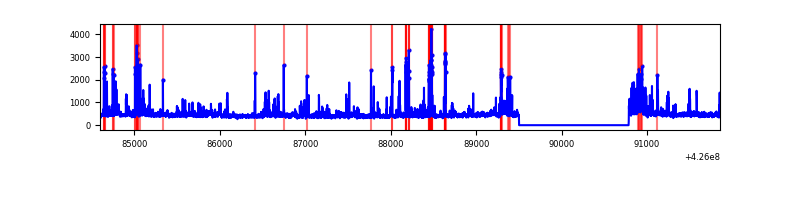 |
Top three noisy pixels from each quadrant. If the there are fewer than three noisy pixels in the level2.evt file, extra rows are filled as -1
| Pixel properties | Quadrant properties | ||||||
|---|---|---|---|---|---|---|---|
| Quadrant | DetID | PixID | Counts | Sigma | Mean | Median | Sigma |
| A | 10 | 83 | 547795 | 4114.8 | 648 | 635 | 133.0 |
| A | 14 | 250 | 49785 | 369.62 | 648 | 635 | 133.0 |
| A | 2 | 79 | 42564 | 315.32 | 648 | 635 | 133.0 |
| B | 0 | 190 | 58267 | 461.26 | 642 | 622 | 125.0 |
| B | 0 | 156 | 30504 | 239.11 | 642 | 622 | 125.0 |
| B | 12 | 111 | 16113 | 123.96 | 642 | 622 | 125.0 |
| C | 15 | 214 | 259871 | 1749.52 | 634 | 637 | 148.2 |
| C | 8 | 79 | 17297 | 112.44 | 634 | 637 | 148.2 |
| C | 13 | 61 | 4251 | 24.39 | 634 | 637 | 148.2 |
| D | 13 | 249 | 347952 | 2238.01 | 632 | 614 | 155.2 |
| D | 2 | 120 | 100487 | 643.51 | 632 | 614 | 155.2 |
| D | 12 | 6 | 84548 | 540.81 | 632 | 614 | 155.2 |
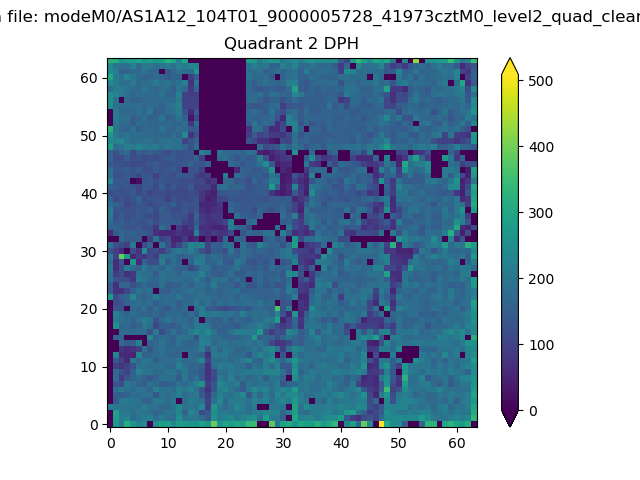
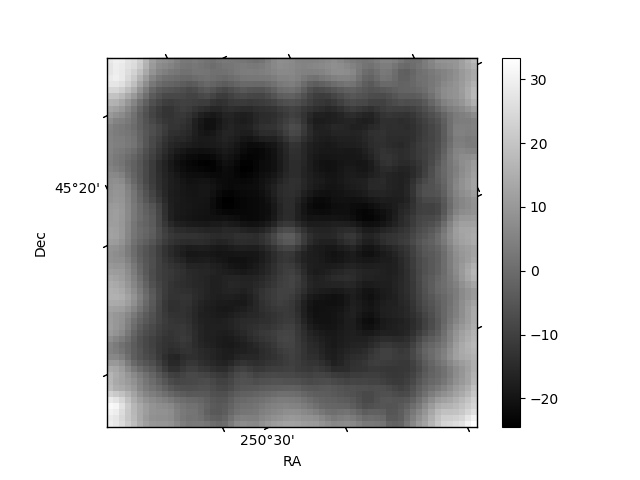
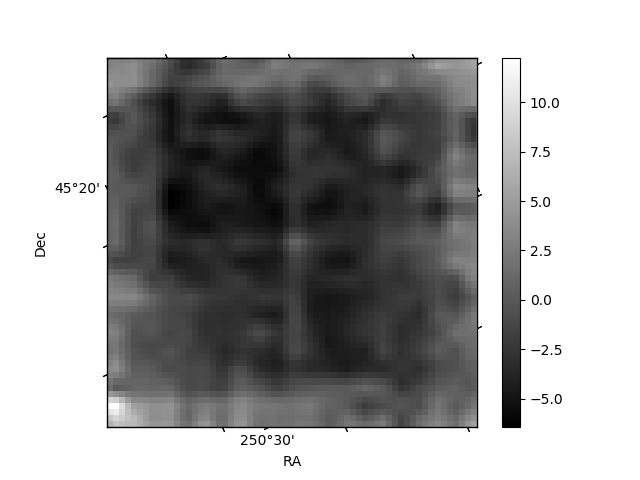
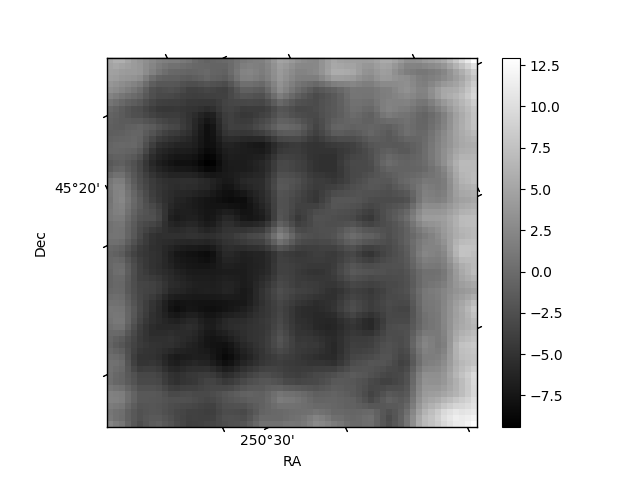
Histogram calculated using DETX and DETY for each event in the final _common_clean file
| Quadrant A | 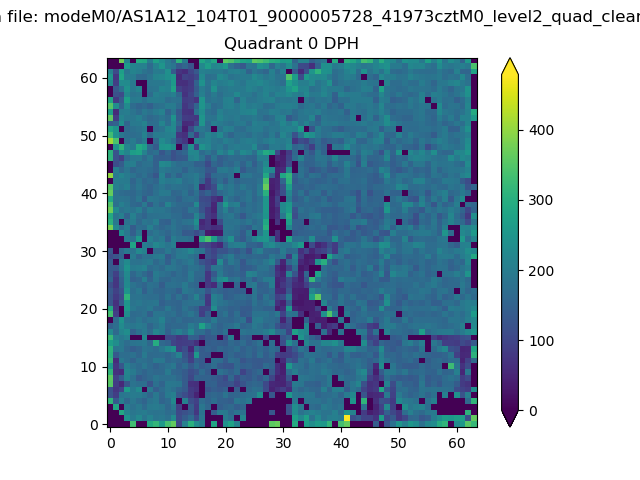 |
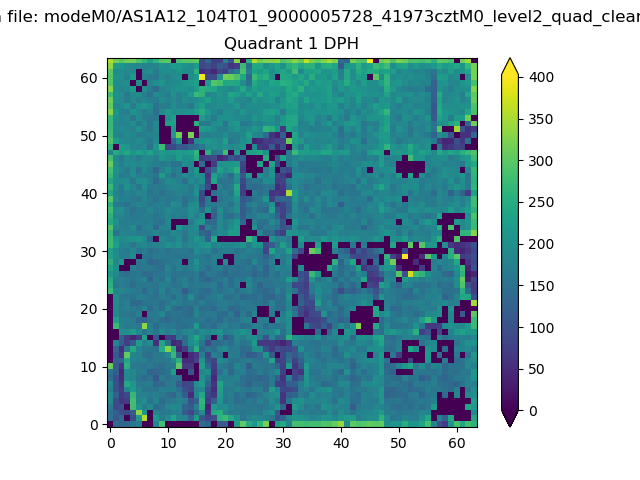 |
Quadrant B |
|---|---|---|---|
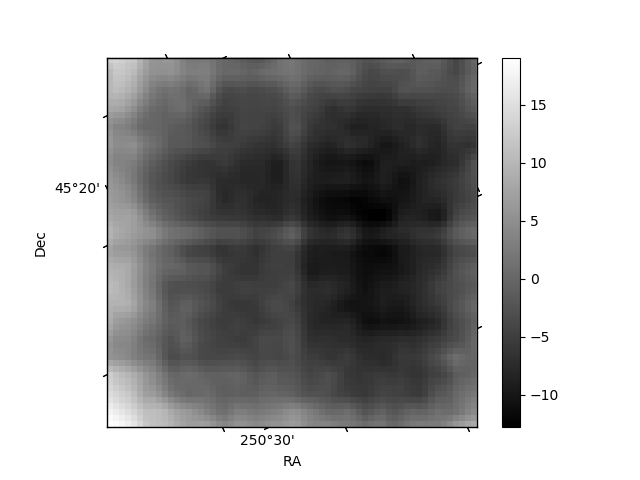
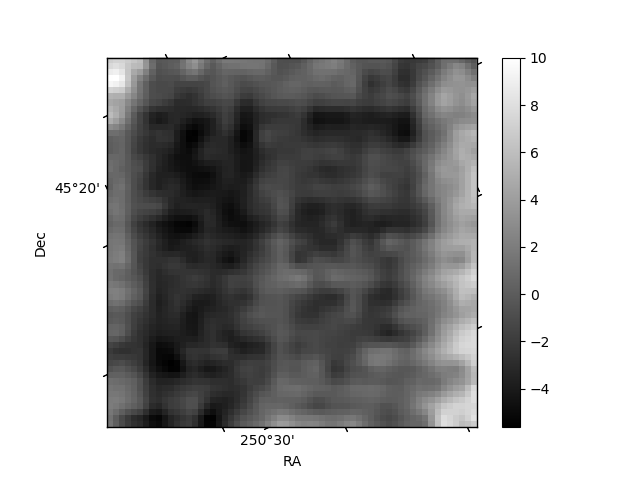
| Quadrant D | 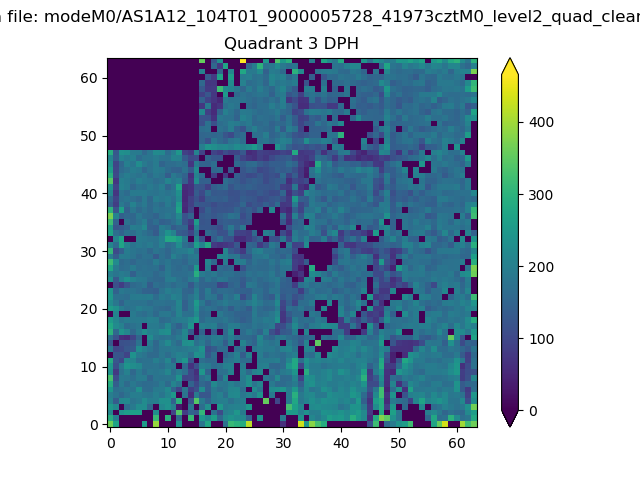 |
 |
Quadrant C |
| Plot type | Count rate plots | Images |
|---|---|---|
| Comparison with Poisson distribution Blue bars denote a histogram of data divided into 1 sec bins. Red curve is a Poisson curve with rate = median count rate of data. |
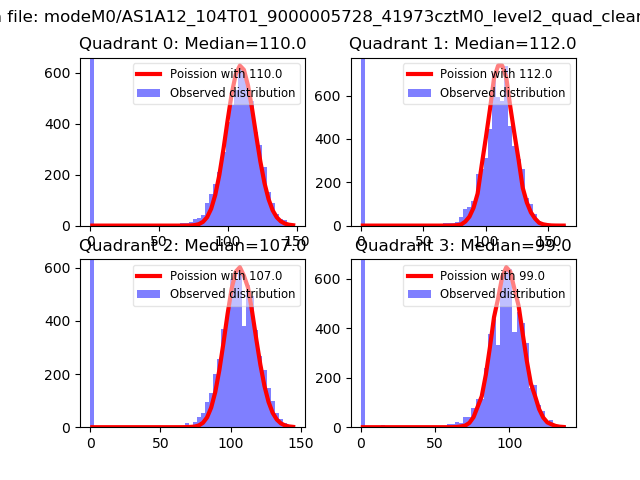 |
 |
| Quadrant-wise count rates Data is divided into 100 sec bins |
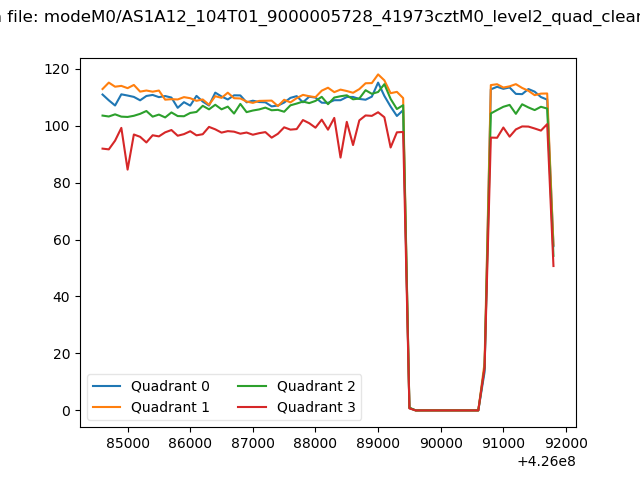 |
|
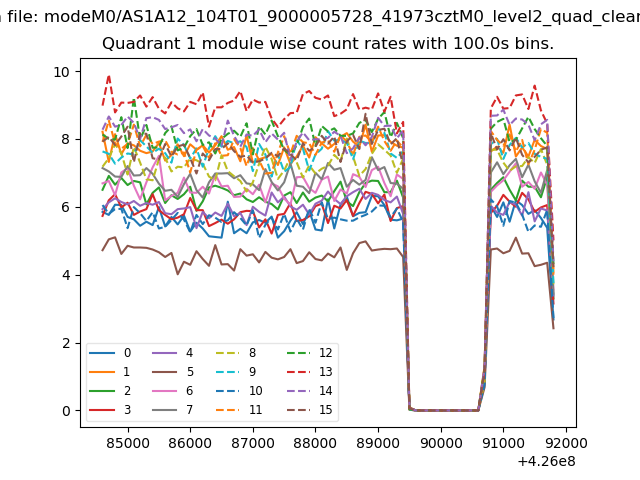
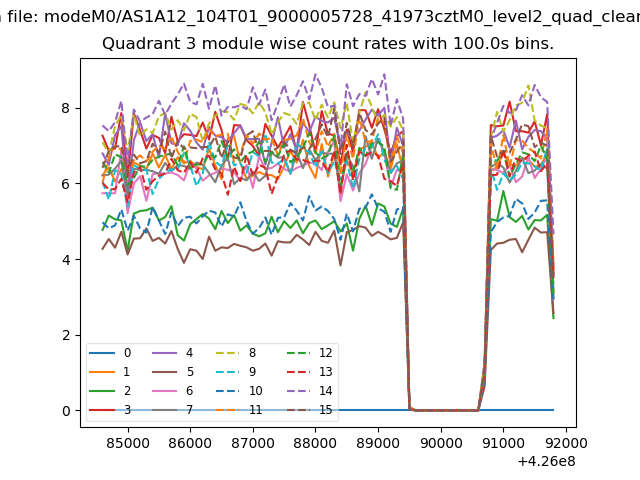
| Module-wise count rates for Quadrant A Data is divided into 100 sec bins |
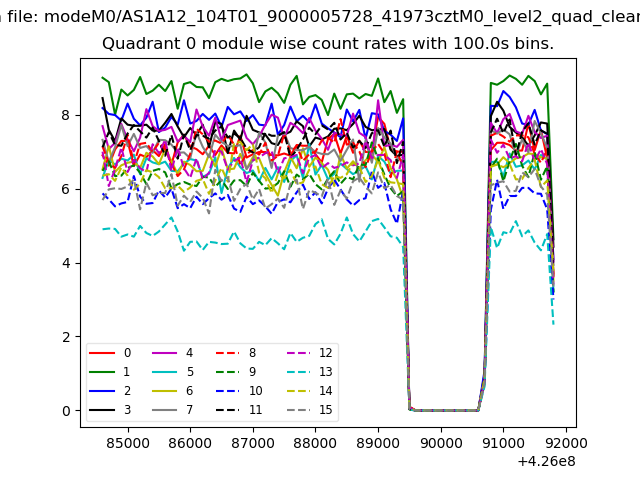 |
 |
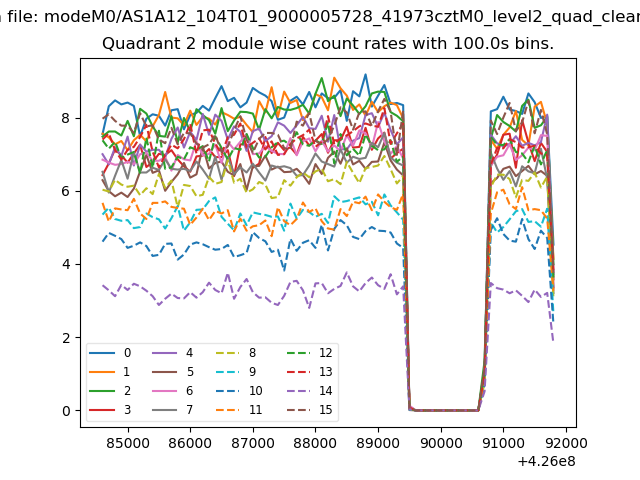
| Module-wise count rates for Quadrant B Data is divided into 100 sec bins |
 |
 |
| Module-wise count rates for Quadrant C Data is divided into 100 sec bins |
 |
 |
| Module-wise count rates for Quadrant D Data is divided into 100 sec bins |
 |
 |
| Parameter | Plot |
|---|---|
| CZT HV Monitor | 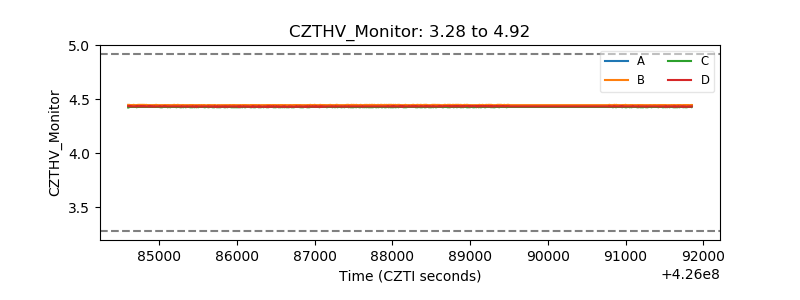 |
| D_VDD | 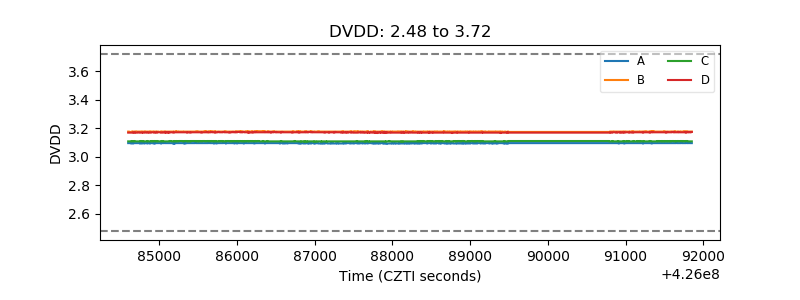 |
| Temperature 1 | 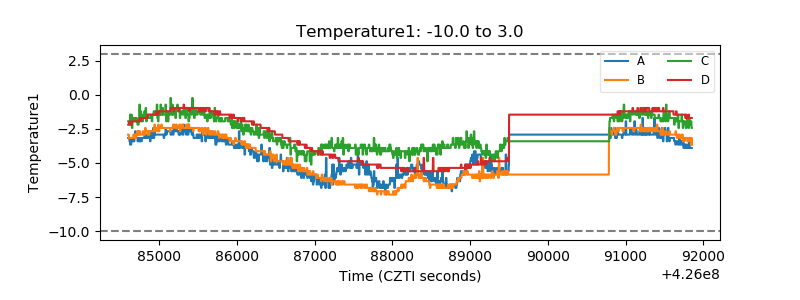 |
| Veto HV Monitor |  |
| Veto LLD | 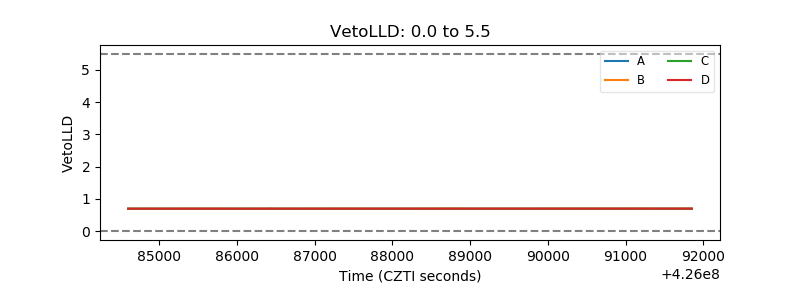 |
| Alpha Counter | 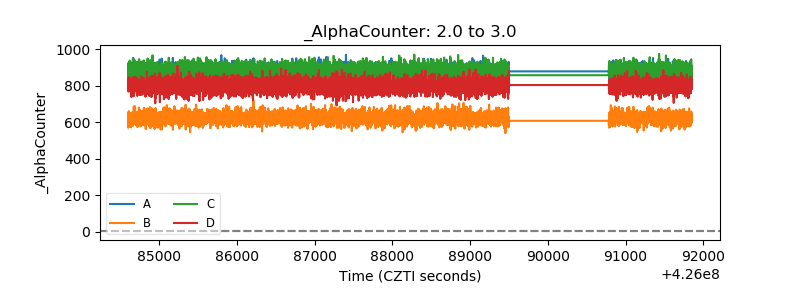 |
| _CPM_Rate | 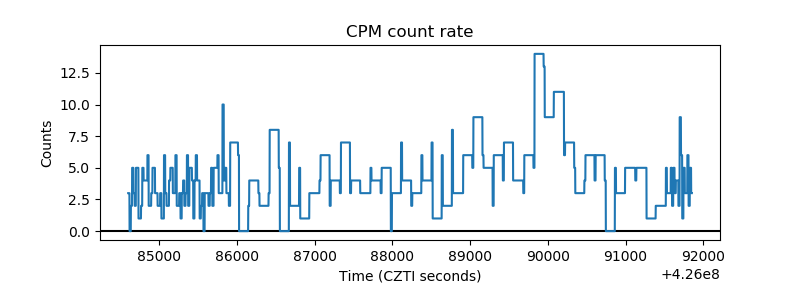 |
| CZT Counter | 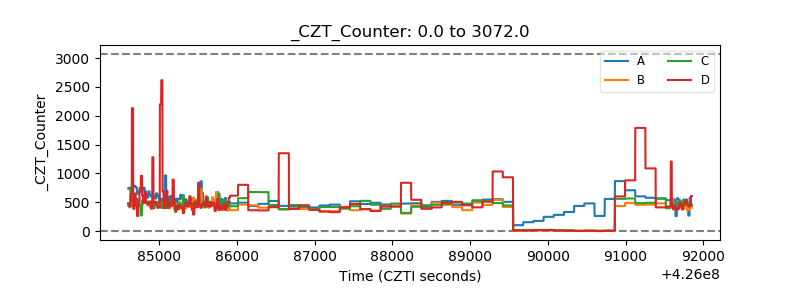 |
| +2.5 Volts monitor | 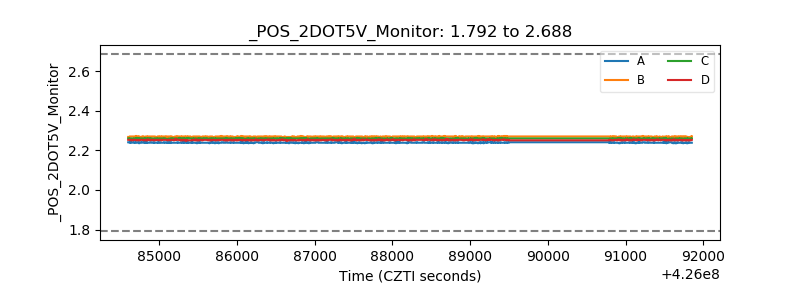 |
| +5 Volts monitor | 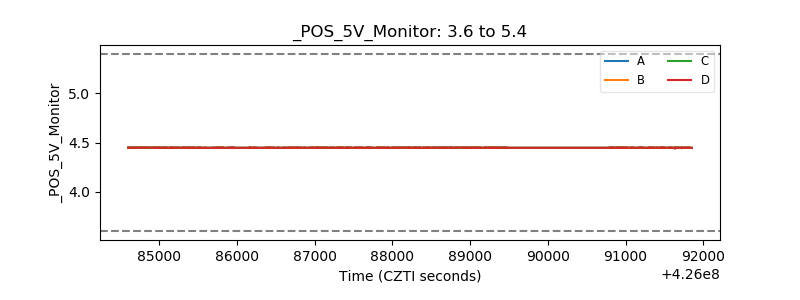 |
| _ROLL_ROT | 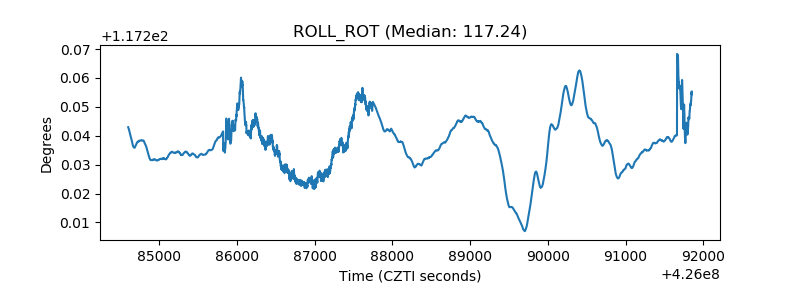 |
| _Roll_DEC | 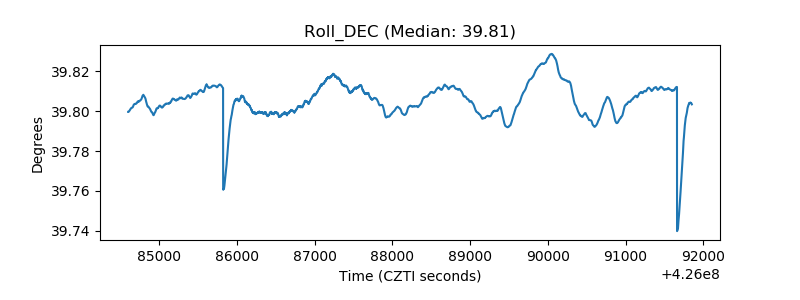 |
| _Roll_RA | 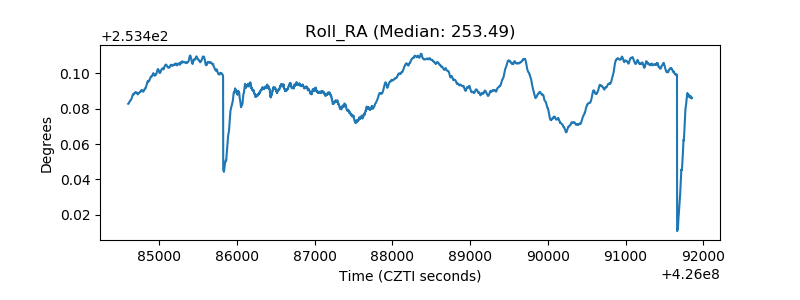 |
| Veto Counter | 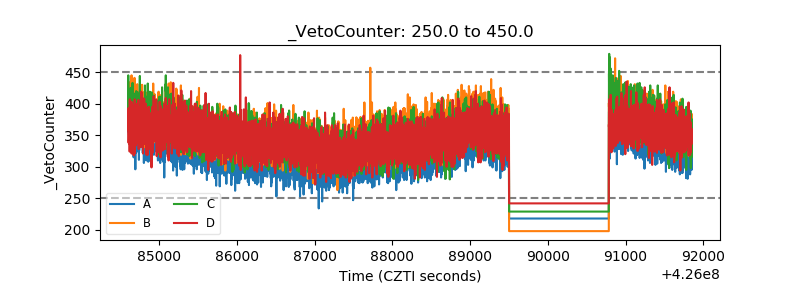 |