| Param | Original file | Final file |
|---|---|---|
| Filename | modeM0/AS1A12_104T01_9000005728_41975cztM0_level2.fits | modeM0/AS1A12_104T01_9000005728_41975cztM0_level2_quad_clean.evt |
| Size (bytes) | 567,956,160 | 172,762,560 |
| Size | 541.6 MB | 164.8 MB |
| Events in quadrant A | 5,454,796 | 1,142,664 |
| Events in quadrant B | 4,743,268 | 1,170,810 |
| Events in quadrant C | 4,876,872 | 1,130,117 |
| Events in quadrant D | 5,114,222 | 1,043,400 |
| Mode SS | |||
|---|---|---|---|
| Quadrant | BADHDUFLAG | Total packets | Discarded packets |
| A | 0 | 218 | 0 |
| B | 0 | 218 | 0 |
| C | 0 | 218 | 0 |
| D | 0 | 218 | 0 |
| Mode M0 | |||
|---|---|---|---|
| Quadrant | BADHDUFLAG | Total packets | Discarded packets |
| A | 0 | 22960 | 4 |
| B | 0 | 21839 | 3 |
| C | 0 | 21576 | 3 |
| D | 0 | 23202 | 3 |
| Mode M9 | |||
|---|---|---|---|
| Quadrant | BADHDUFLAG | Total packets | Discarded packets |
| A | 0 | 39 | 0 |
| B | 0 | 39 | 0 |
| C | 0 | 39 | 0 |
| D | 0 | 40 | 0 |
| Quadrant | Total seconds | Saturated seconds | Saturation percentage |
|---|---|---|---|
| A | 10745 | 17 | 0.158213% |
| B | 10745 | 18 | 0.167520% |
| C | 10745 | 3 | 0.027920% |
| D | 10745 | 77 | 0.716612% |
Noise dominated data is calculated using 1-second bins in cleaned event files. If a bin has >2000 counts, and if more than 50% of those come from <1% of pixels, then it is considered to be noise-dominated and hence unusable.
| Quadrant | # 1 sec bins | Bins with >0 counts | Bins with >2000 counts | High rate bins dominated by noise | Noise dominated (total time) | Noise dominated (detector-on time) | Marked lightcurve |
|---|---|---|---|---|---|---|---|
| A | 13522 | 10747 | 3 | 3 | 0.02% | 0.03% | 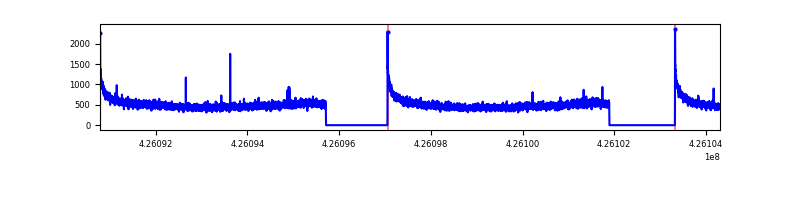 |
| B | 13522 | 10747 | 2 | 2 | 0.01% | 0.02% | 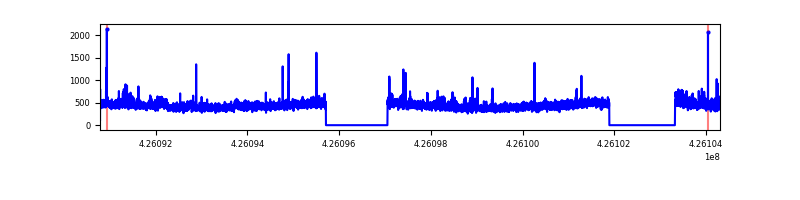 |
| C | 13522 | 10747 | 0 | 0 | 0.00% | 0.00% | 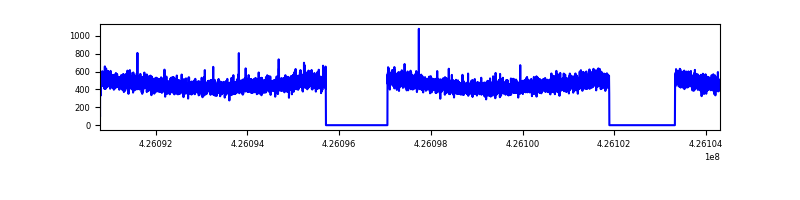 |
| D | 13522 | 10747 | 53 | 53 | 0.39% | 0.49% | 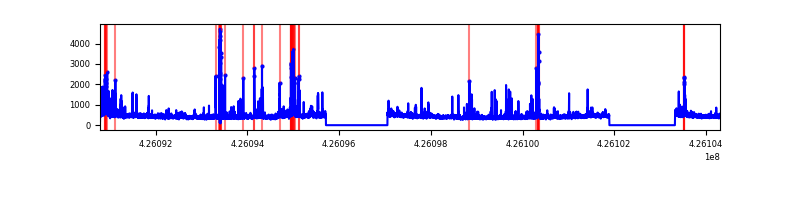 |
Top three noisy pixels from each quadrant. If the there are fewer than three noisy pixels in the level2.evt file, extra rows are filled as -1
| Pixel properties | Quadrant properties | ||||||
|---|---|---|---|---|---|---|---|
| Quadrant | DetID | PixID | Counts | Sigma | Mean | Median | Sigma |
| A | 10 | 83 | 985263 | 4214.12 | 1149 | 1128 | 233.5 |
| A | 13 | 6 | 17166 | 68.68 | 1149 | 1128 | 233.5 |
| A | 2 | 79 | 16665 | 66.53 | 1149 | 1128 | 233.5 |
| B | 0 | 190 | 126583 | 573.59 | 1143 | 1112 | 218.7 |
| B | 0 | 156 | 64413 | 289.38 | 1143 | 1112 | 218.7 |
| B | 0 | 229 | 29155 | 128.2 | 1143 | 1112 | 218.7 |
| C | 15 | 214 | 467802 | 1790.11 | 1129 | 1136 | 260.7 |
| C | 13 | 61 | 7632 | 24.92 | 1129 | 1136 | 260.7 |
| C | 0 | 207 | 4798 | 14.05 | 1129 | 1136 | 260.7 |
| D | 13 | 249 | 173516 | 635.99 | 1124 | 1095 | 271.1 |
| D | 12 | 6 | 165072 | 604.84 | 1124 | 1095 | 271.1 |
| D | 2 | 120 | 109769 | 400.85 | 1124 | 1095 | 271.1 |
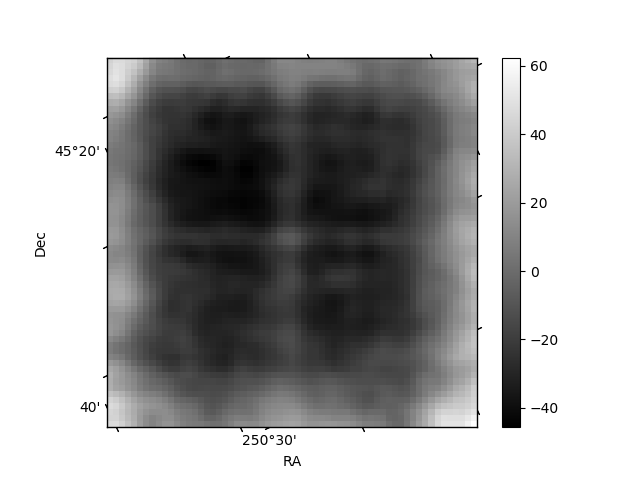
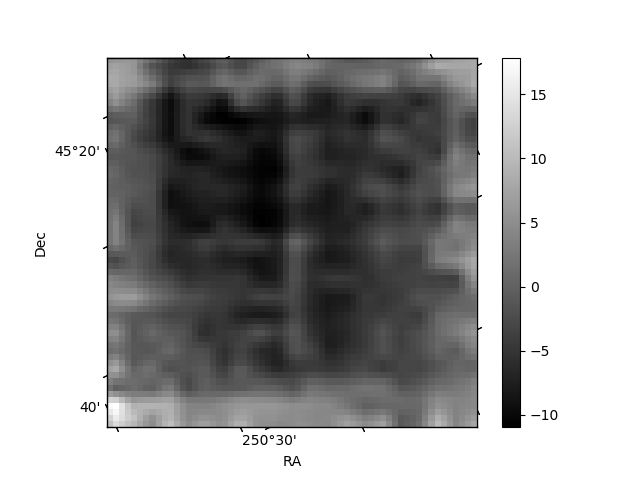
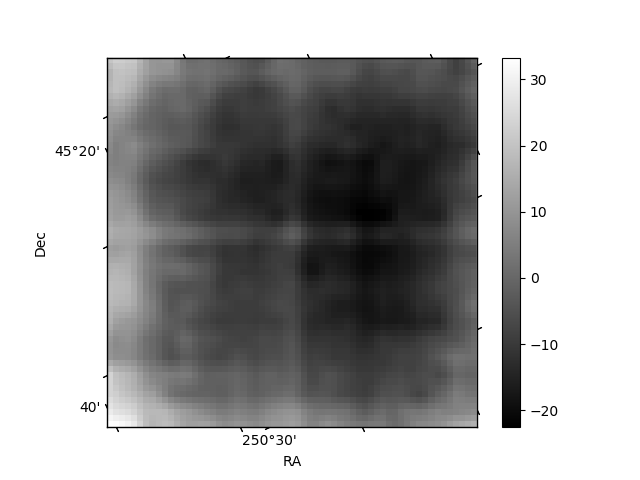
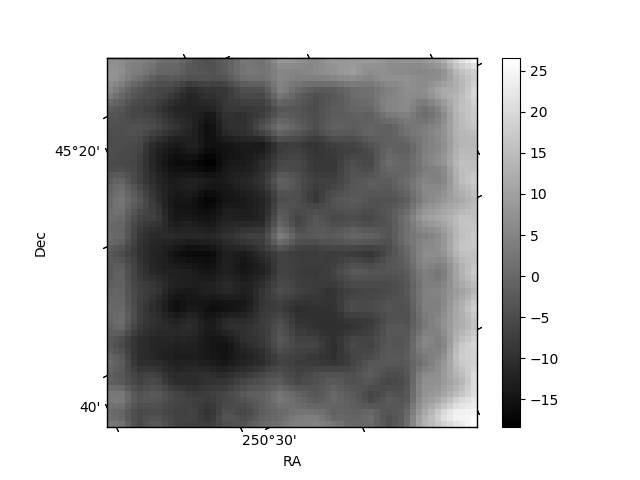
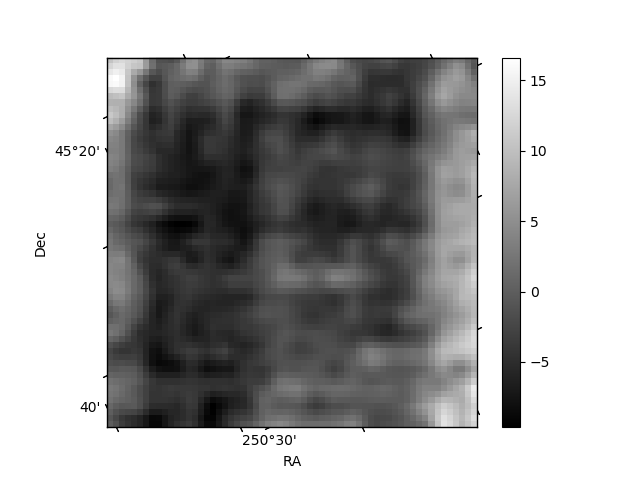
Histogram calculated using DETX and DETY for each event in the final _common_clean file
| Quadrant A | 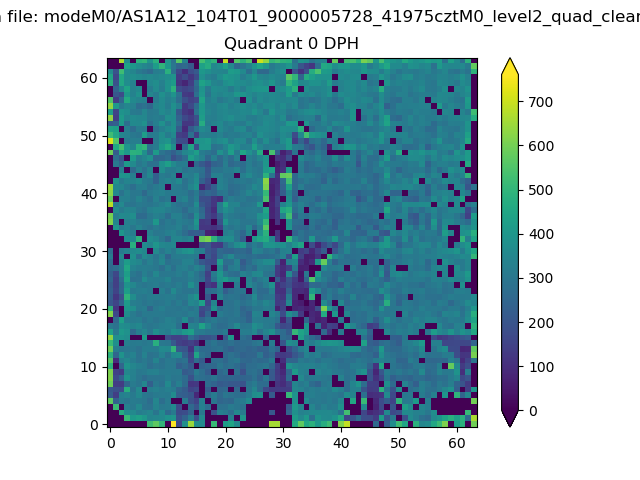 |
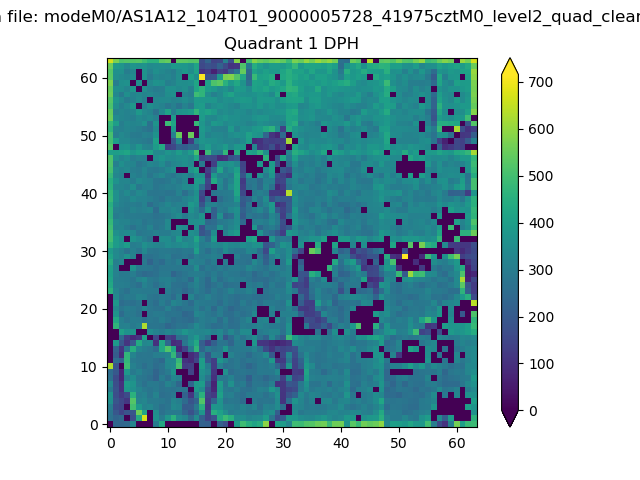 |
Quadrant B |
|---|---|---|---|
| Quadrant D | 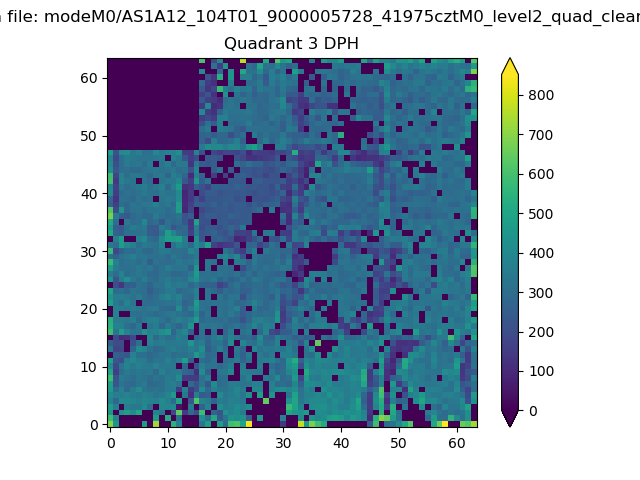 |
 |
Quadrant C |
| Plot type | Count rate plots | Images |
|---|---|---|
| Comparison with Poisson distribution Blue bars denote a histogram of data divided into 1 sec bins. Red curve is a Poisson curve with rate = median count rate of data. |
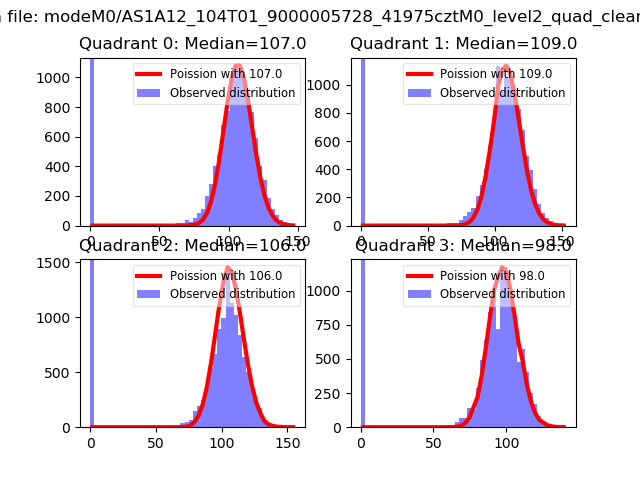 |
 |
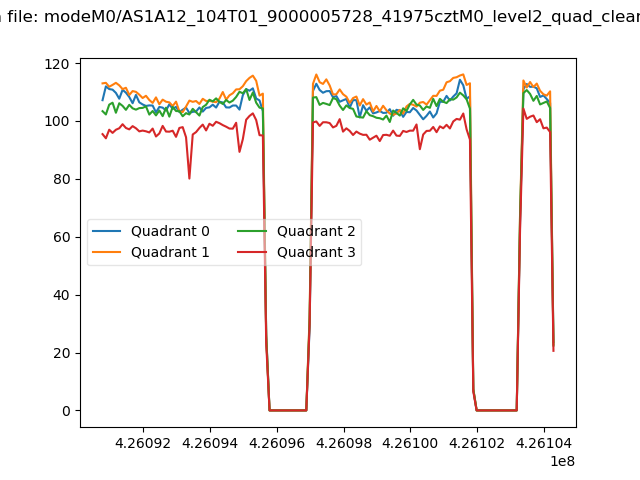
| Quadrant-wise count rates Data is divided into 100 sec bins |
 |
|
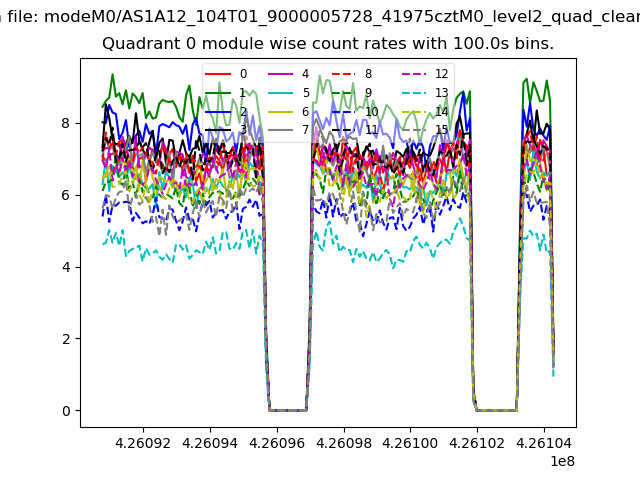
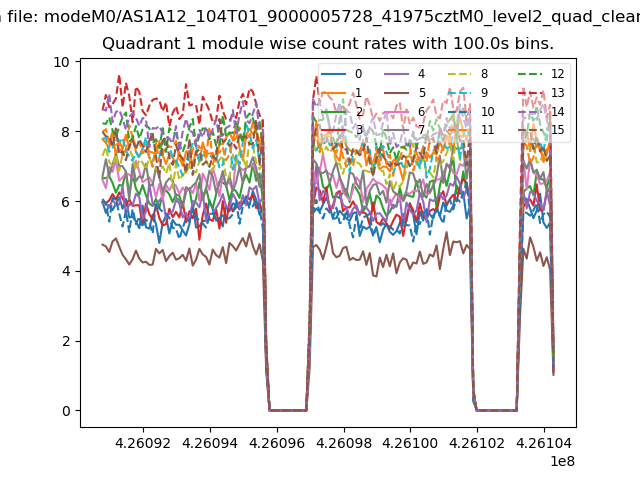
| Module-wise count rates for Quadrant A Data is divided into 100 sec bins |
 |
 |
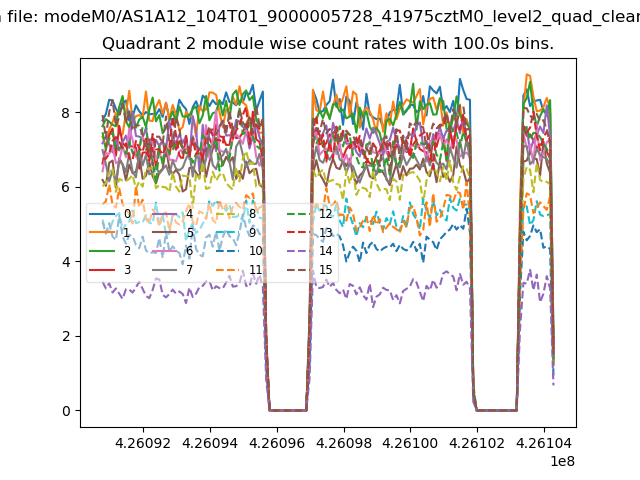
| Module-wise count rates for Quadrant B Data is divided into 100 sec bins |
 |
 |
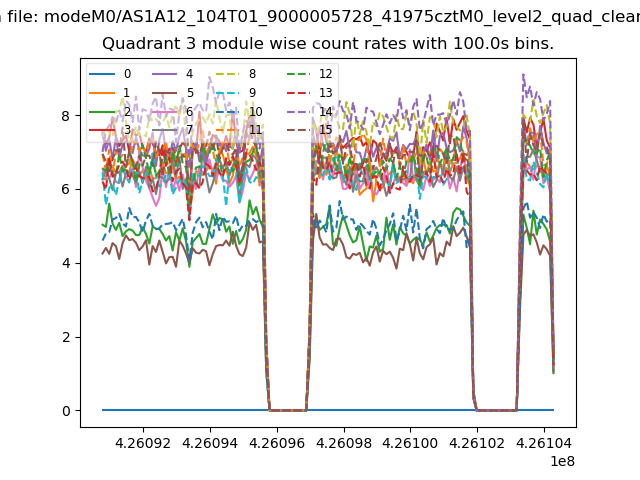
| Module-wise count rates for Quadrant C Data is divided into 100 sec bins |
 |
 |
| Module-wise count rates for Quadrant D Data is divided into 100 sec bins |
 |
 |
| Parameter | Plot |
|---|---|
| CZT HV Monitor | 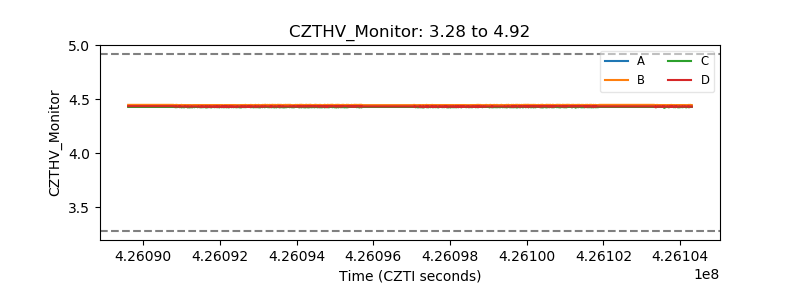 |
| D_VDD | 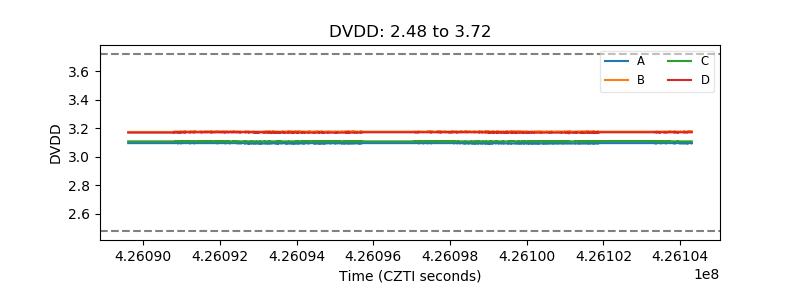 |
| Temperature 1 | 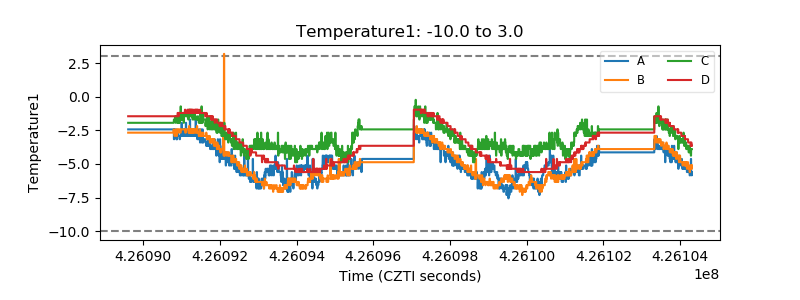 |
| Veto HV Monitor | 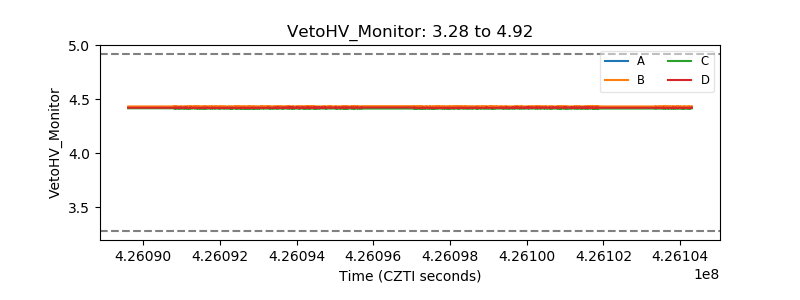 |
| Veto LLD | 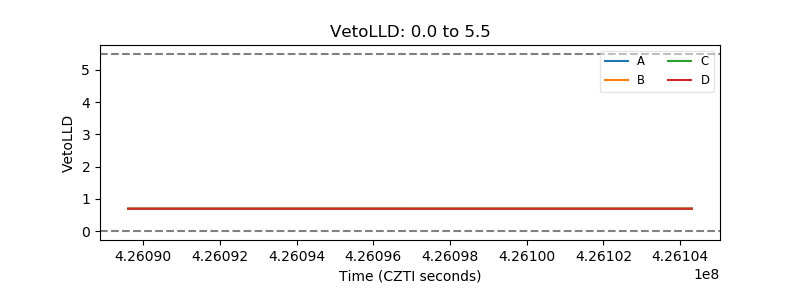 |
| Alpha Counter | 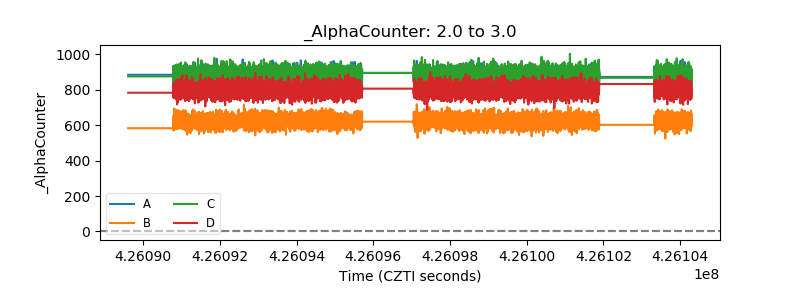 |
| _CPM_Rate | 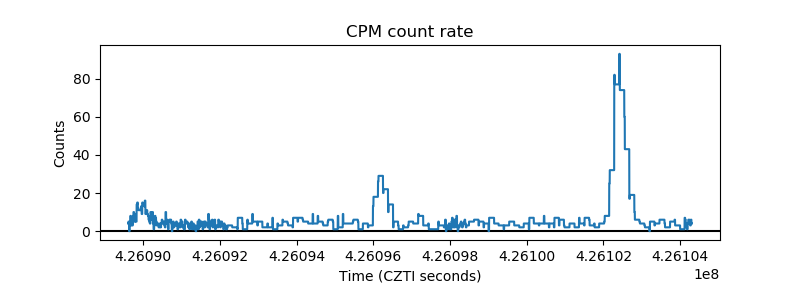 |
| CZT Counter | 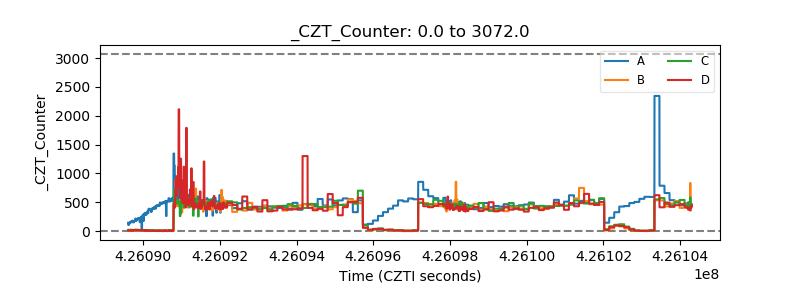 |
| +2.5 Volts monitor |  |
| +5 Volts monitor | 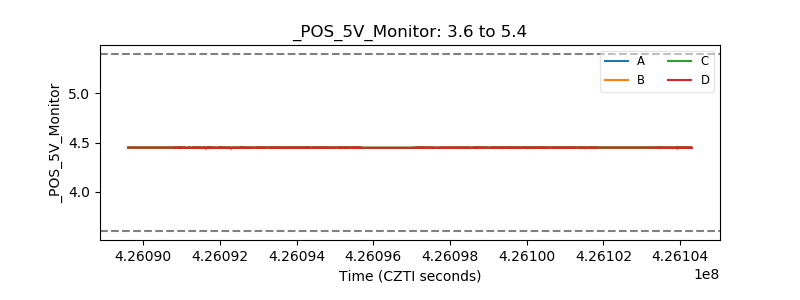 |
| _ROLL_ROT | 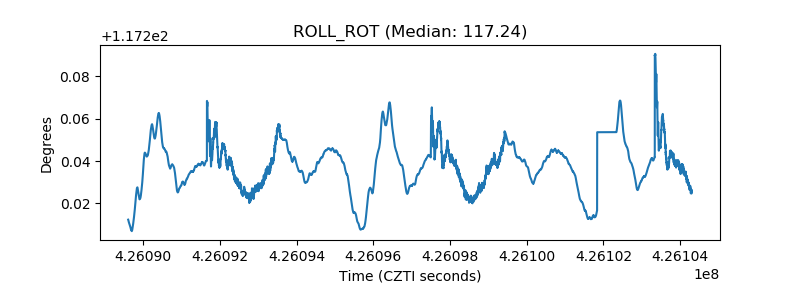 |
| _Roll_DEC | 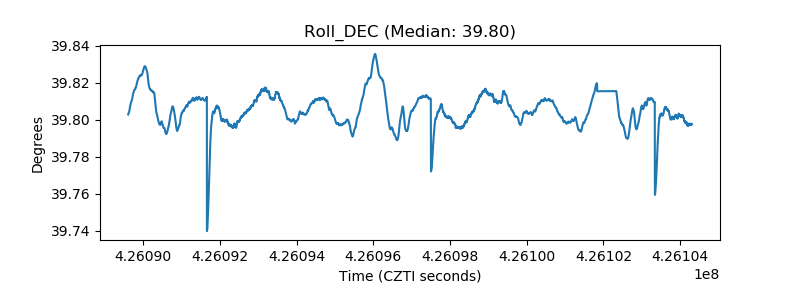 |
| _Roll_RA | 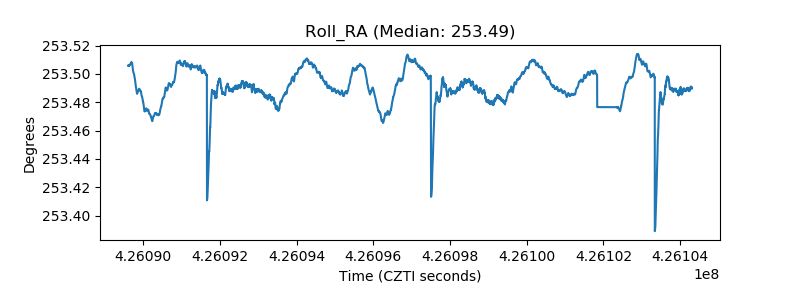 |
| Veto Counter | 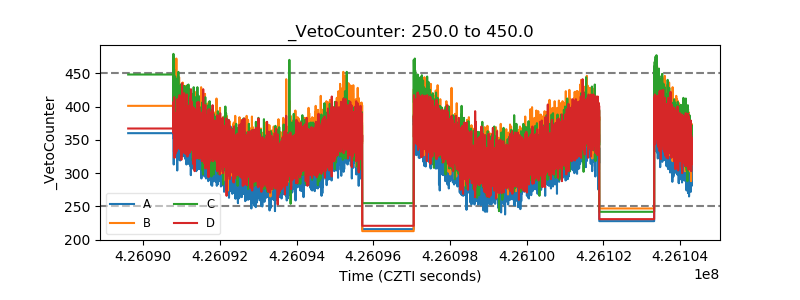 |