| Param | Original file | Final file |
|---|---|---|
| Filename | modeM0/AS1A12_104T01_9000005728_41976cztM0_level2.fits | modeM0/AS1A12_104T01_9000005728_41976cztM0_level2_quad_clean.evt |
| Size (bytes) | 301,956,480 | 91,656,000 |
| Size | 288.0 MB | 87.4 MB |
| Events in quadrant A | 2,874,459 | 608,074 |
| Events in quadrant B | 2,546,029 | 619,659 |
| Events in quadrant C | 2,547,312 | 600,585 |
| Events in quadrant D | 2,770,839 | 553,521 |
| Mode SS | |||
|---|---|---|---|
| Quadrant | BADHDUFLAG | Total packets | Discarded packets |
| A | 0 | 114 | 0 |
| B | 0 | 114 | 0 |
| C | 0 | 114 | 0 |
| D | 0 | 114 | 0 |
| Mode M0 | |||
|---|---|---|---|
| Quadrant | BADHDUFLAG | Total packets | Discarded packets |
| A | 0 | 12143 | 3 |
| B | 0 | 11608 | 2 |
| C | 0 | 11297 | 2 |
| D | 0 | 12378 | 2 |
| Mode M9 | |||
|---|---|---|---|
| Quadrant | BADHDUFLAG | Total packets | Discarded packets |
| A | 0 | 23 | 0 |
| B | 0 | 23 | 0 |
| C | 0 | 23 | 0 |
| D | 0 | 24 | 0 |
| Quadrant | Total seconds | Saturated seconds | Saturation percentage |
|---|---|---|---|
| A | 5625 | 12 | 0.213333% |
| B | 5625 | 12 | 0.213333% |
| C | 5625 | 2 | 0.035556% |
| D | 5625 | 53 | 0.942222% |
Noise dominated data is calculated using 1-second bins in cleaned event files. If a bin has >2000 counts, and if more than 50% of those come from <1% of pixels, then it is considered to be noise-dominated and hence unusable.
| Quadrant | # 1 sec bins | Bins with >0 counts | Bins with >2000 counts | High rate bins dominated by noise | Noise dominated (total time) | Noise dominated (detector-on time) | Marked lightcurve |
|---|---|---|---|---|---|---|---|
| A | 7178 | 5626 | 3 | 3 | 0.04% | 0.05% |  |
| B | 7178 | 5626 | 3 | 3 | 0.04% | 0.05% | 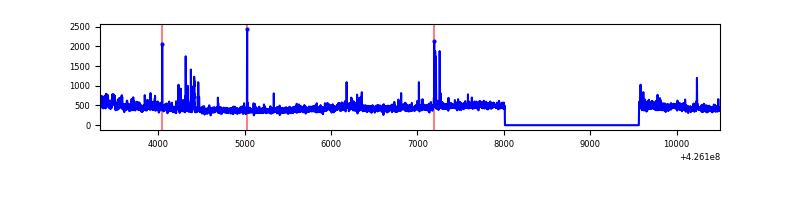 |
| C | 7178 | 5626 | 0 | 0 | 0.00% | 0.00% | 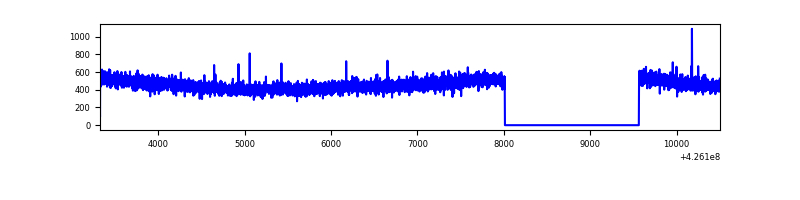 |
| D | 7178 | 5626 | 50 | 50 | 0.70% | 0.89% | 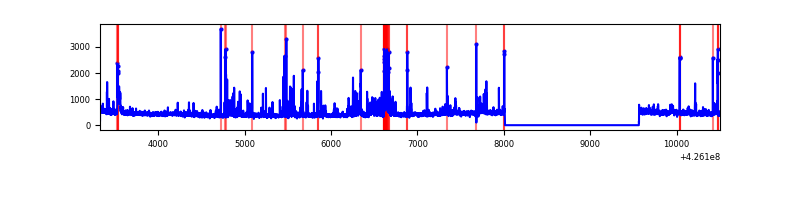 |
Top three noisy pixels from each quadrant. If the there are fewer than three noisy pixels in the level2.evt file, extra rows are filled as -1
| Pixel properties | Quadrant properties | ||||||
|---|---|---|---|---|---|---|---|
| Quadrant | DetID | PixID | Counts | Sigma | Mean | Median | Sigma |
| A | 10 | 83 | 549824 | 4434.81 | 595 | 581 | 123.8 |
| A | 15 | 223 | 20267 | 158.95 | 595 | 581 | 123.8 |
| A | 13 | 6 | 7373 | 54.84 | 595 | 581 | 123.8 |
| B | 5 | 255 | 72110 | 619.81 | 593 | 577 | 115.4 |
| B | 0 | 156 | 62006 | 532.26 | 593 | 577 | 115.4 |
| B | 0 | 190 | 54014 | 463.01 | 593 | 577 | 115.4 |
| C | 15 | 214 | 250464 | 1808.57 | 588 | 591 | 138.2 |
| C | 8 | 79 | 5840 | 37.99 | 588 | 591 | 138.2 |
| C | 13 | 61 | 3811 | 23.31 | 588 | 591 | 138.2 |
| D | 12 | 6 | 224312 | 1572.79 | 583 | 568 | 142.3 |
| D | 1 | 52 | 57225 | 398.26 | 583 | 568 | 142.3 |
| D | 13 | 249 | 47542 | 330.2 | 583 | 568 | 142.3 |
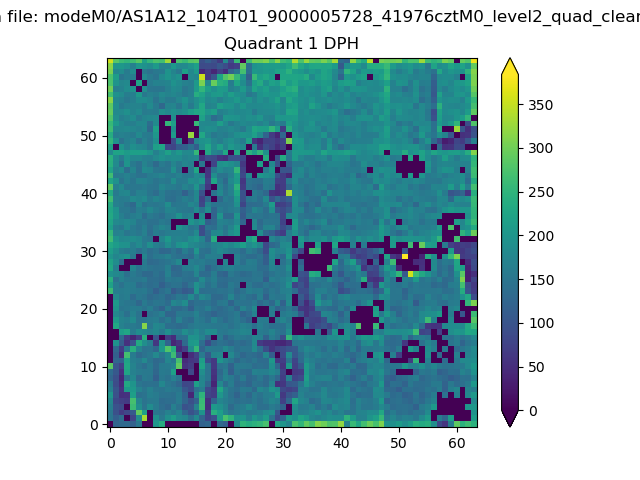
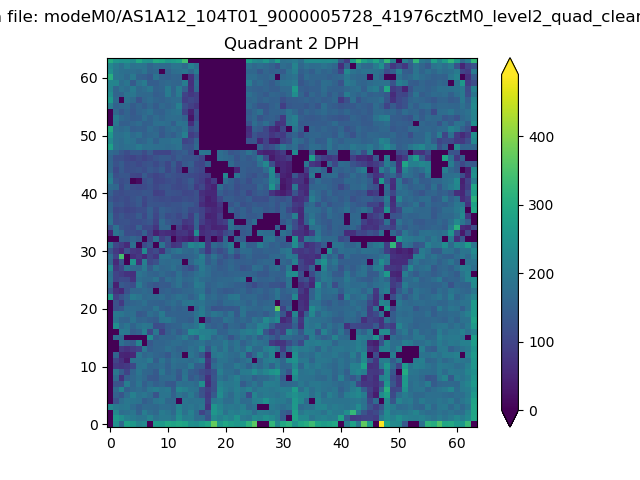
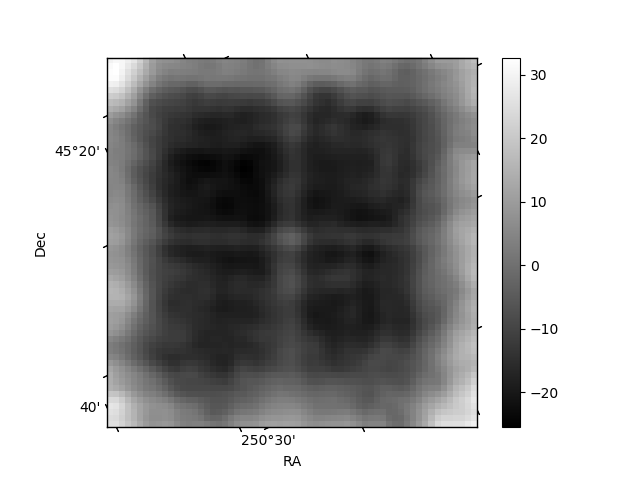
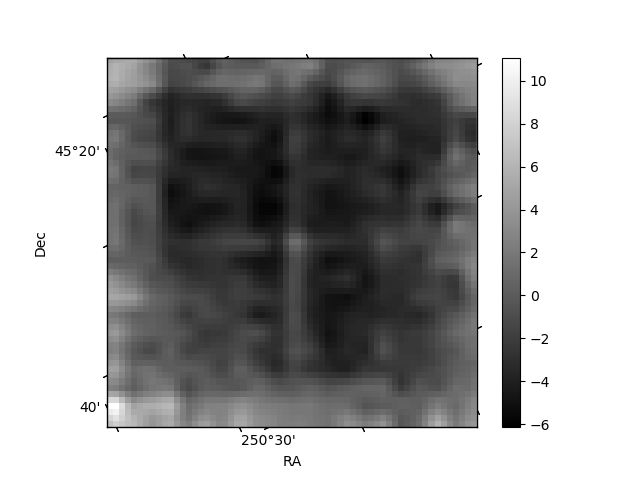
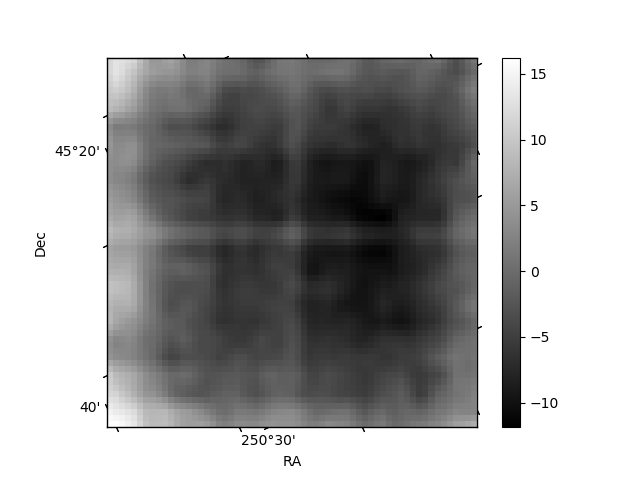
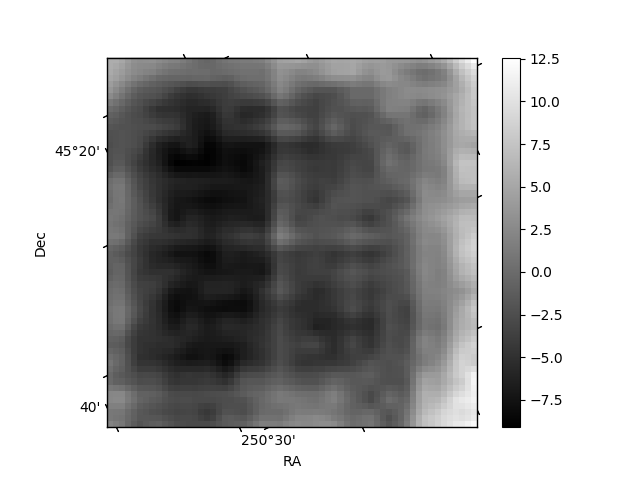
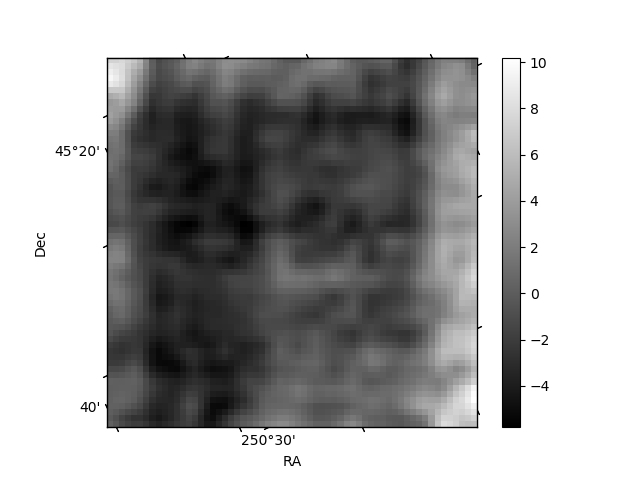
Histogram calculated using DETX and DETY for each event in the final _common_clean file
| Quadrant A | 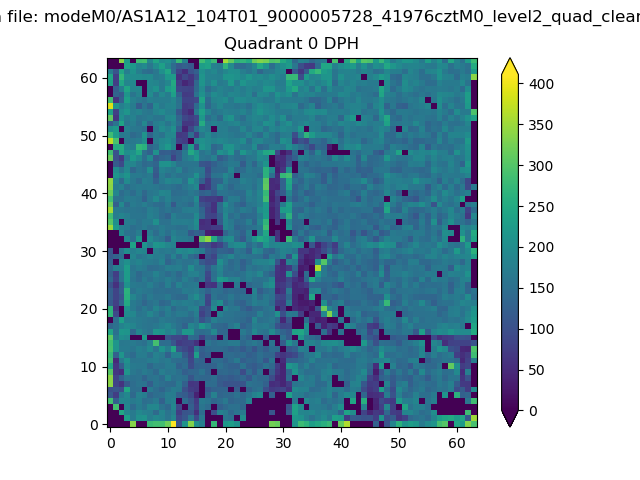 |
 |
Quadrant B |
|---|---|---|---|
| Quadrant D | 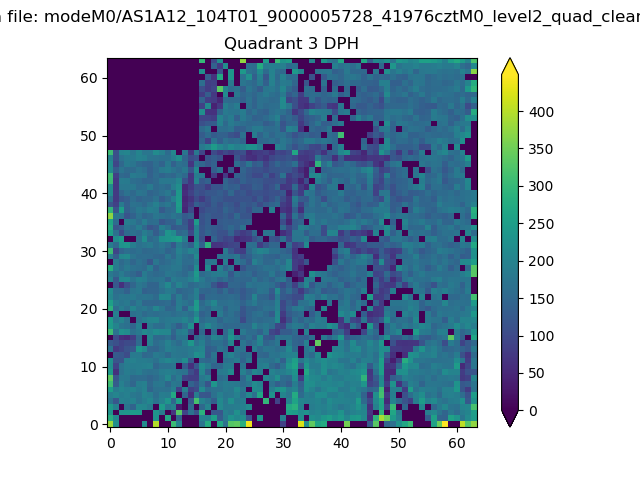 |
 |
Quadrant C |
| Plot type | Count rate plots | Images |
|---|---|---|
| Comparison with Poisson distribution Blue bars denote a histogram of data divided into 1 sec bins. Red curve is a Poisson curve with rate = median count rate of data. |
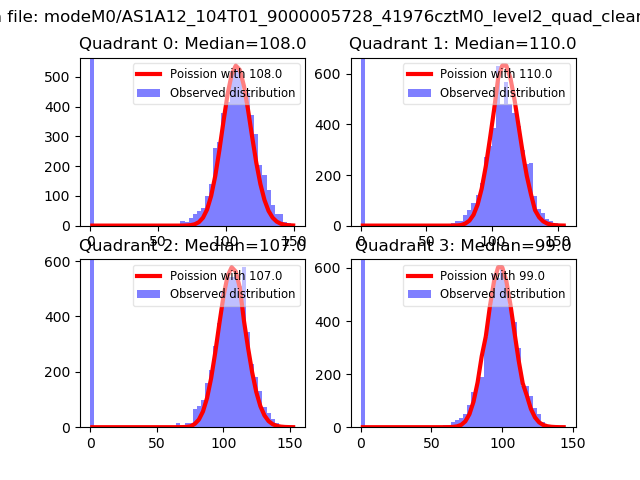 |
 |
| Quadrant-wise count rates Data is divided into 100 sec bins |
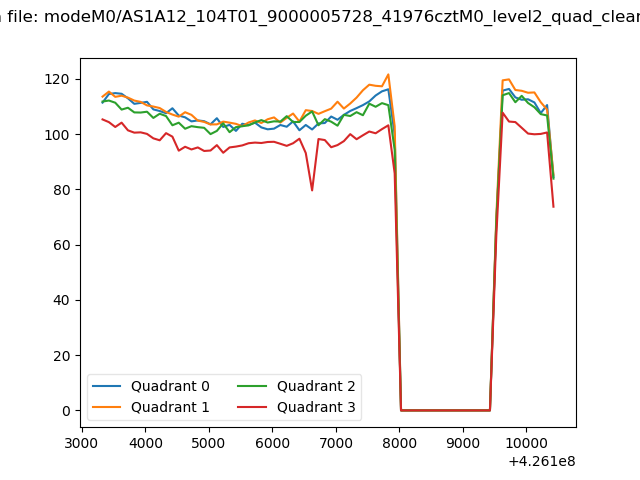 |
|
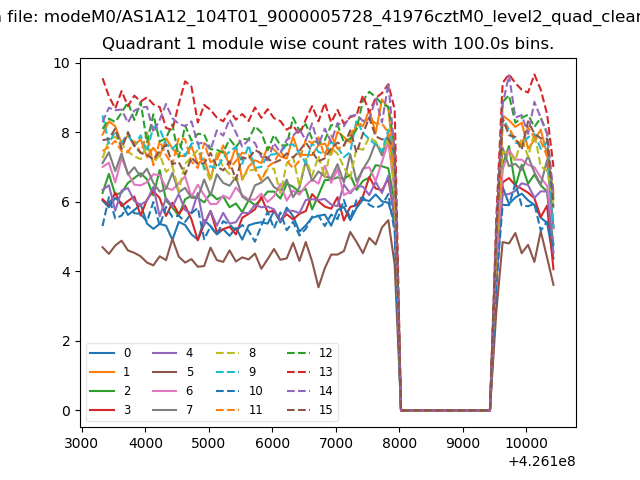
| Module-wise count rates for Quadrant A Data is divided into 100 sec bins |
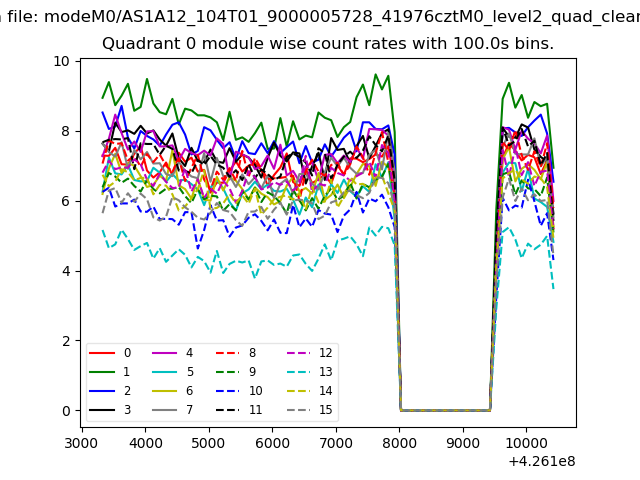 |
 |
| Module-wise count rates for Quadrant B Data is divided into 100 sec bins |
 |
 |
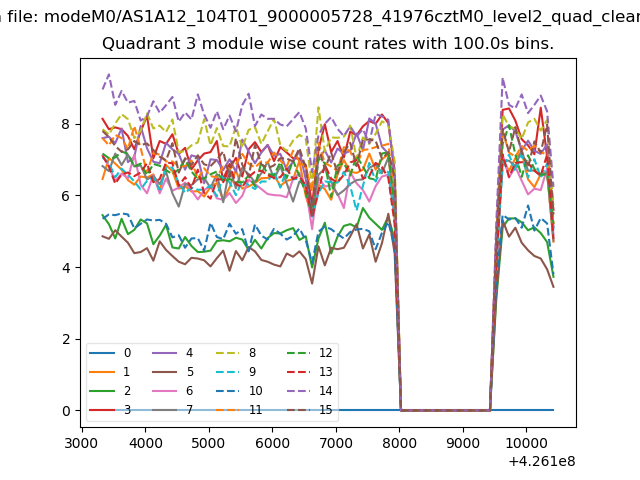
| Module-wise count rates for Quadrant C Data is divided into 100 sec bins |
 |
 |
| Module-wise count rates for Quadrant D Data is divided into 100 sec bins |
 |
 |
| Parameter | Plot |
|---|---|
| CZT HV Monitor | 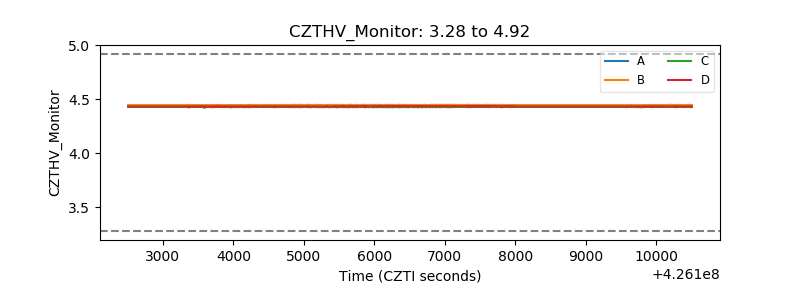 |
| D_VDD | 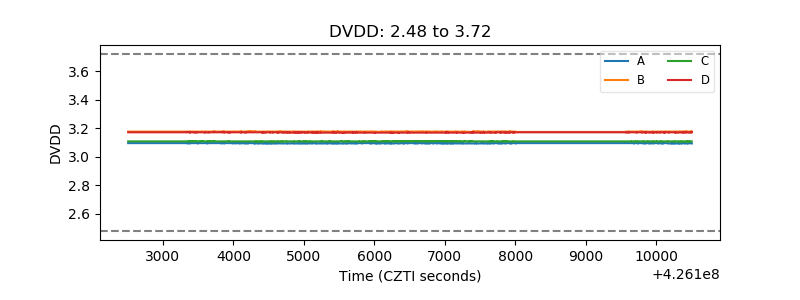 |
| Temperature 1 | 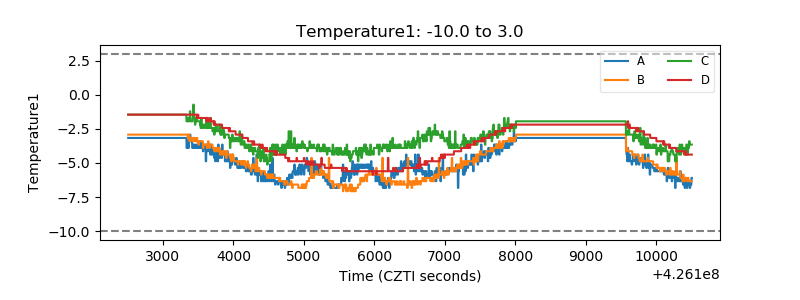 |
| Veto HV Monitor | 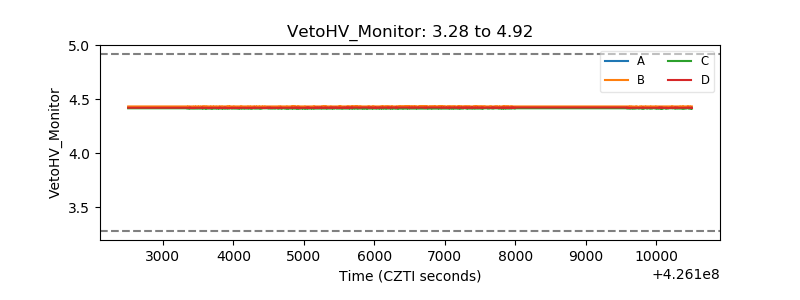 |
| Veto LLD | 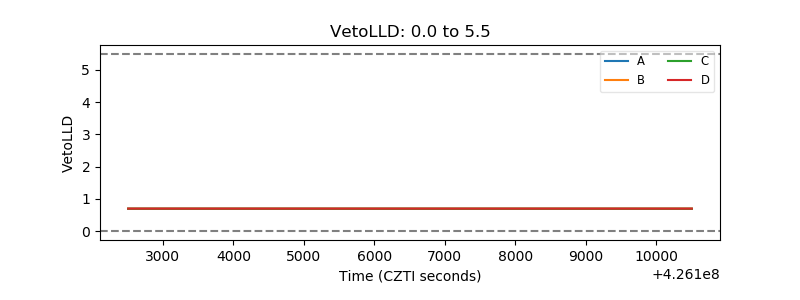 |
| Alpha Counter | 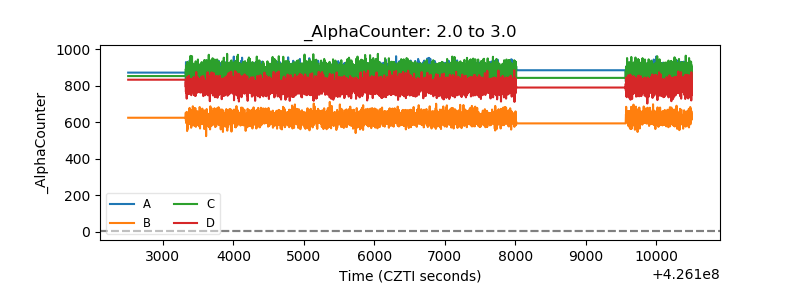 |
| _CPM_Rate |  |
| CZT Counter | 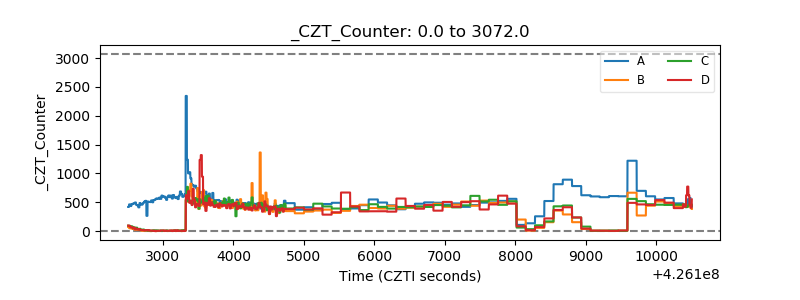 |
| +2.5 Volts monitor | 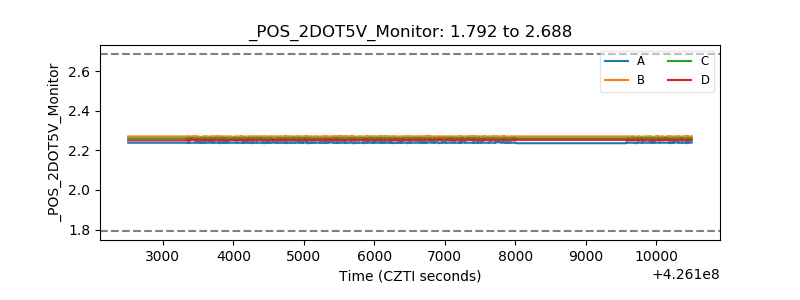 |
| +5 Volts monitor |  |
| _ROLL_ROT | 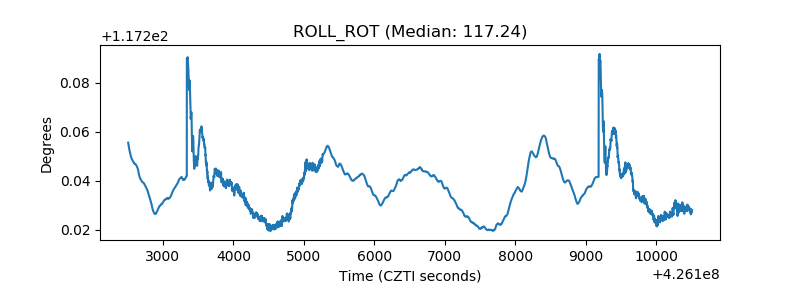 |
| _Roll_DEC | 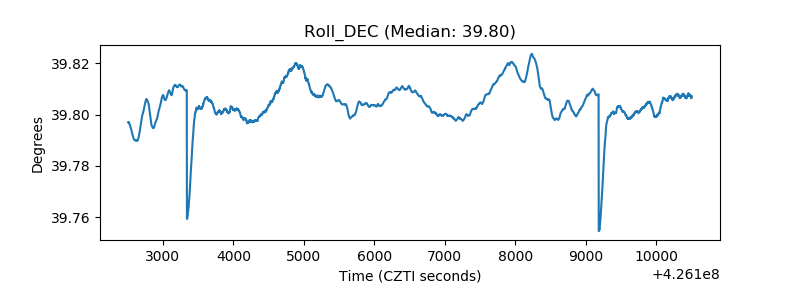 |
| _Roll_RA | 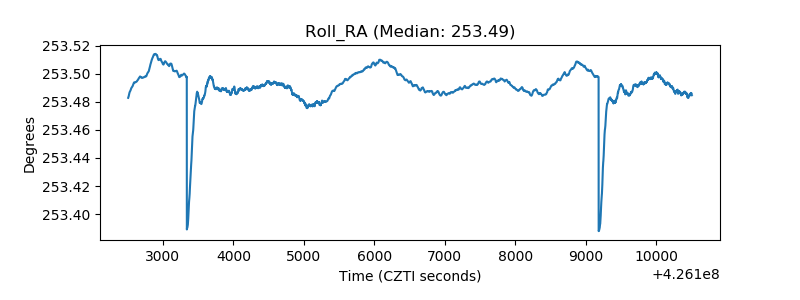 |
| Veto Counter | 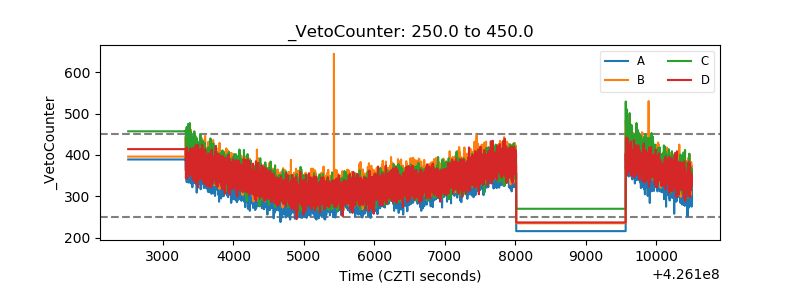 |