| Param | Original file | Final file |
|---|---|---|
| Filename | modeM0/AS1A12_104T01_9000005728_41977cztM0_level2.fits | modeM0/AS1A12_104T01_9000005728_41977cztM0_level2_quad_clean.evt |
| Size (bytes) | 297,950,400 | 90,797,760 |
| Size | 284.1 MB | 86.6 MB |
| Events in quadrant A | 2,829,573 | 599,911 |
| Events in quadrant B | 2,604,095 | 610,664 |
| Events in quadrant C | 2,531,470 | 597,134 |
| Events in quadrant D | 2,630,100 | 552,869 |
| Mode SS | |||
|---|---|---|---|
| Quadrant | BADHDUFLAG | Total packets | Discarded packets |
| A | 0 | 112 | 0 |
| B | 0 | 112 | 0 |
| C | 0 | 112 | 0 |
| D | 0 | 112 | 0 |
| Mode M0 | |||
|---|---|---|---|
| Quadrant | BADHDUFLAG | Total packets | Discarded packets |
| A | 0 | 11990 | 3 |
| B | 0 | 11775 | 2 |
| C | 0 | 11186 | 2 |
| D | 0 | 11888 | 2 |
| Mode M9 | |||
|---|---|---|---|
| Quadrant | BADHDUFLAG | Total packets | Discarded packets |
| A | 0 | 30 | 0 |
| B | 0 | 30 | 0 |
| C | 0 | 30 | 0 |
| D | 0 | 31 | 0 |
| Quadrant | Total seconds | Saturated seconds | Saturation percentage |
|---|---|---|---|
| A | 5560 | 15 | 0.269784% |
| B | 5560 | 80 | 1.438849% |
| C | 5560 | 3 | 0.053957% |
| D | 5560 | 34 | 0.611511% |
Noise dominated data is calculated using 1-second bins in cleaned event files. If a bin has >2000 counts, and if more than 50% of those come from <1% of pixels, then it is considered to be noise-dominated and hence unusable.
| Quadrant | # 1 sec bins | Bins with >0 counts | Bins with >2000 counts | High rate bins dominated by noise | Noise dominated (total time) | Noise dominated (detector-on time) | Marked lightcurve |
|---|---|---|---|---|---|---|---|
| A | 7233 | 5561 | 4 | 4 | 0.06% | 0.07% | 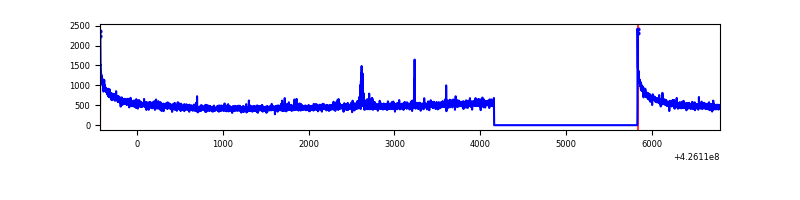 |
| B | 7233 | 5561 | 69 | 69 | 0.95% | 1.24% | 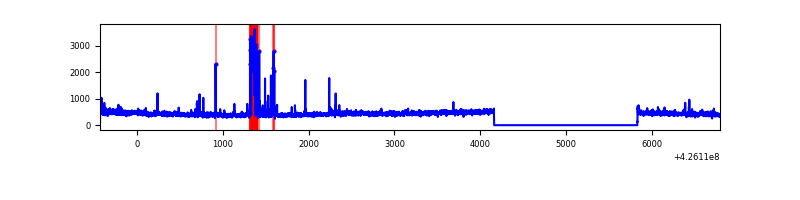 |
| C | 7233 | 5561 | 0 | 0 | 0.00% | 0.00% | 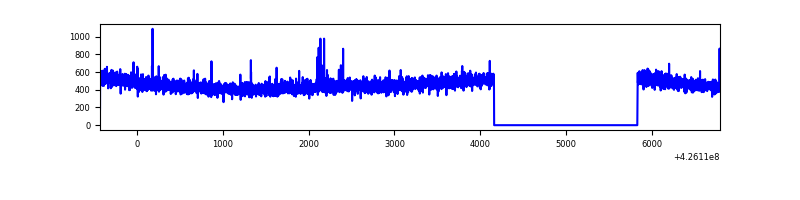 |
| D | 7233 | 5561 | 31 | 31 | 0.43% | 0.56% | 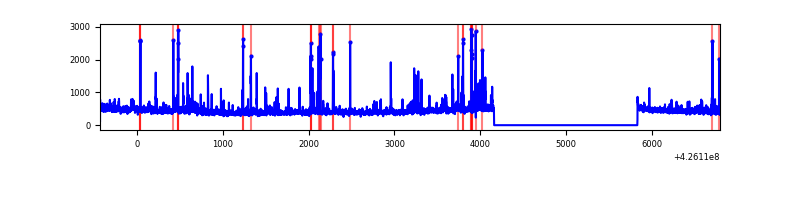 |
Top three noisy pixels from each quadrant. If the there are fewer than three noisy pixels in the level2.evt file, extra rows are filled as -1
| Pixel properties | Quadrant properties | ||||||
|---|---|---|---|---|---|---|---|
| Quadrant | DetID | PixID | Counts | Sigma | Mean | Median | Sigma |
| A | 10 | 83 | 531576 | 4362.61 | 586 | 572 | 121.7 |
| A | 2 | 79 | 24185 | 194.0 | 586 | 572 | 121.7 |
| A | 13 | 6 | 7120 | 53.8 | 586 | 572 | 121.7 |
| B | 0 | 190 | 266016 | 2375.58 | 581 | 566 | 111.7 |
| B | 0 | 156 | 29645 | 260.24 | 581 | 566 | 111.7 |
| B | 5 | 255 | 20375 | 177.28 | 581 | 566 | 111.7 |
| C | 15 | 214 | 245235 | 1815.32 | 580 | 583 | 134.8 |
| C | 8 | 79 | 22881 | 165.45 | 580 | 583 | 134.8 |
| C | 13 | 61 | 3727 | 23.33 | 580 | 583 | 134.8 |
| D | 13 | 249 | 150377 | 1068.47 | 574 | 557 | 140.2 |
| D | 1 | 52 | 90734 | 643.11 | 574 | 557 | 140.2 |
| D | 12 | 6 | 61068 | 431.54 | 574 | 557 | 140.2 |
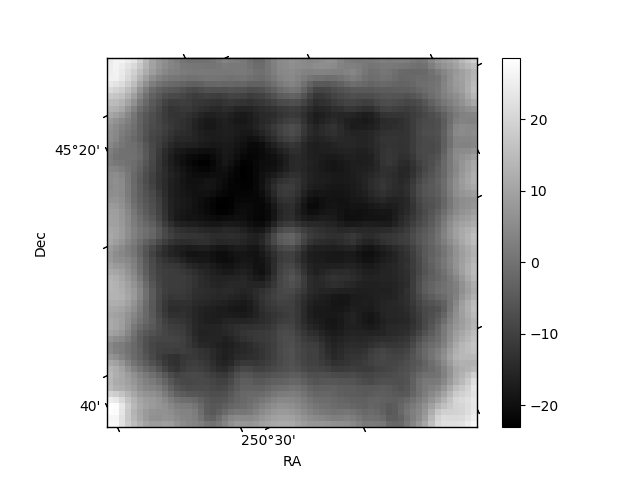
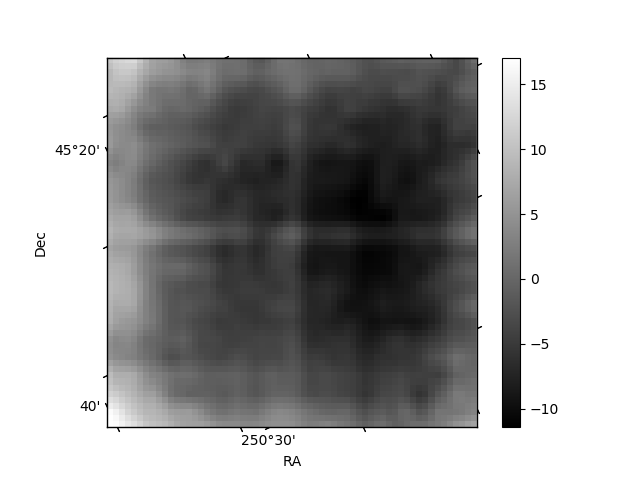
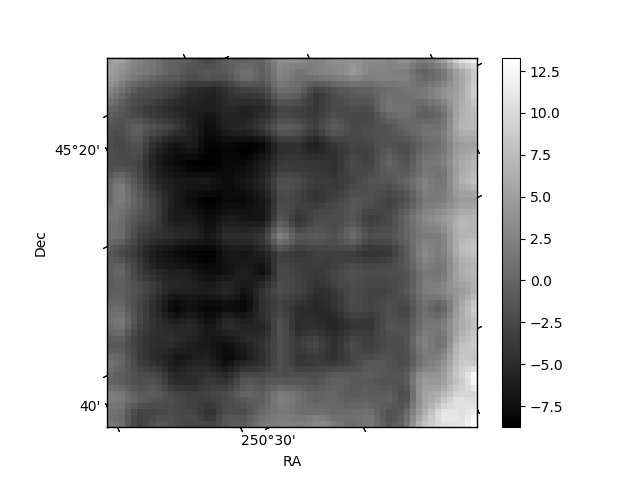
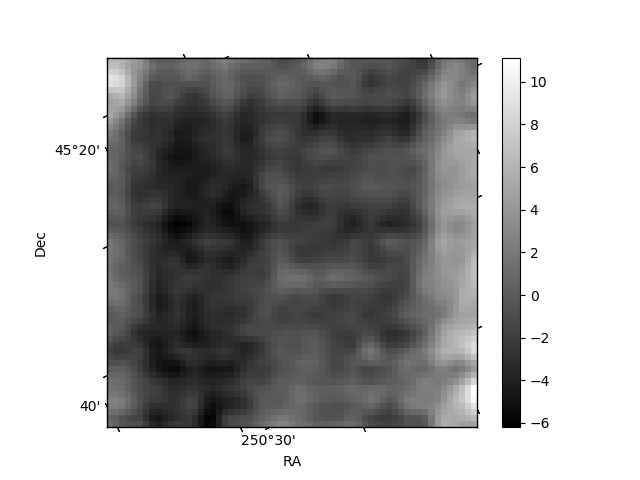
Histogram calculated using DETX and DETY for each event in the final _common_clean file
| Quadrant A | 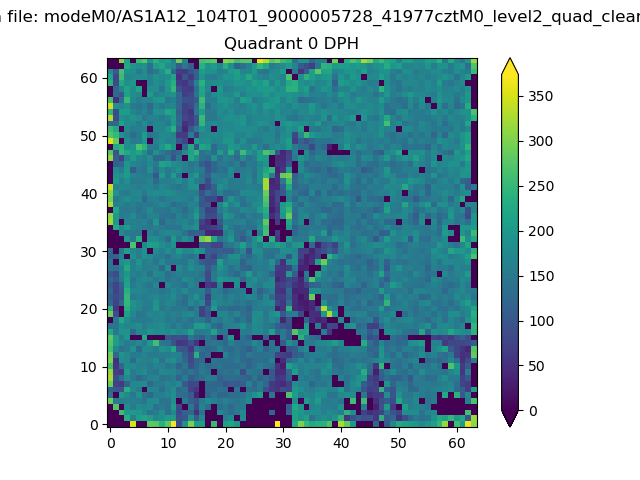 |
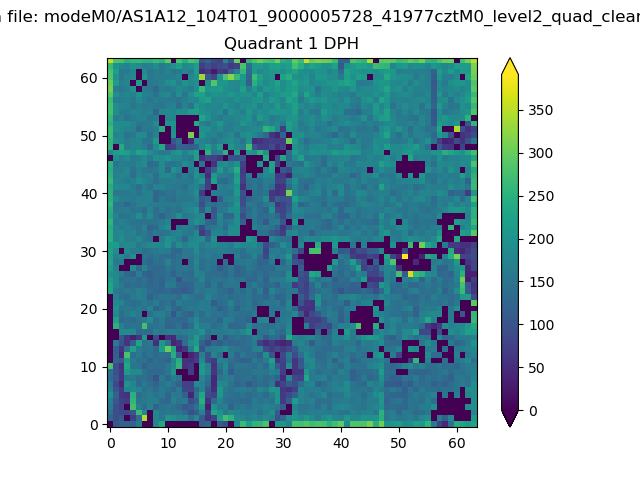 |
Quadrant B |
|---|---|---|---|
| Quadrant D | 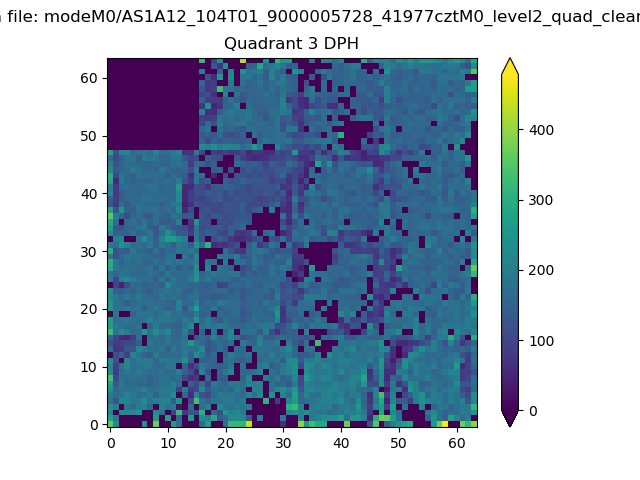 |
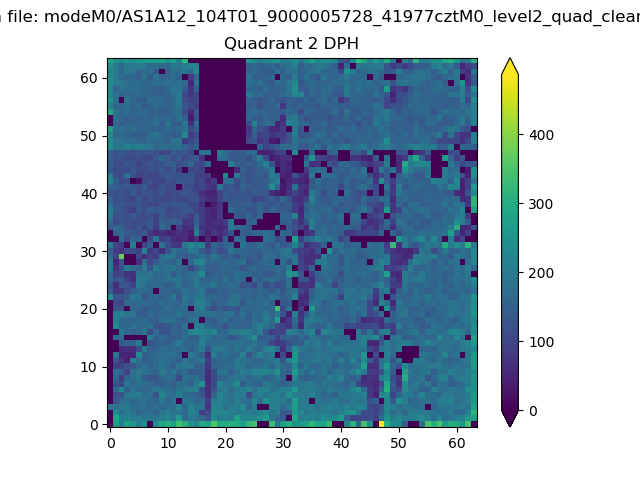 |
Quadrant C |
| Plot type | Count rate plots | Images |
|---|---|---|
| Comparison with Poisson distribution Blue bars denote a histogram of data divided into 1 sec bins. Red curve is a Poisson curve with rate = median count rate of data. |
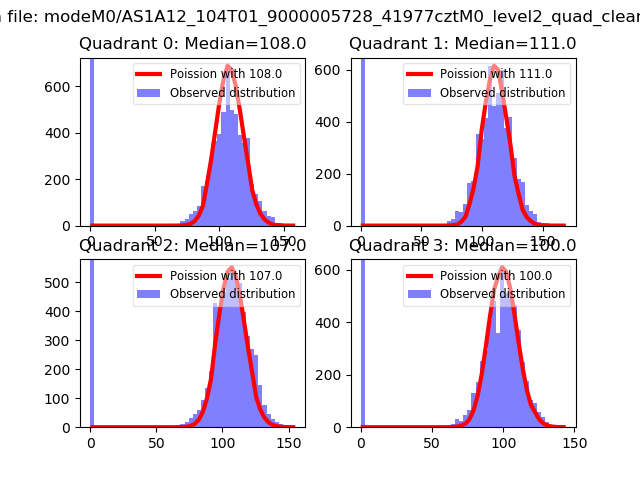 |
 |
| Quadrant-wise count rates Data is divided into 100 sec bins |
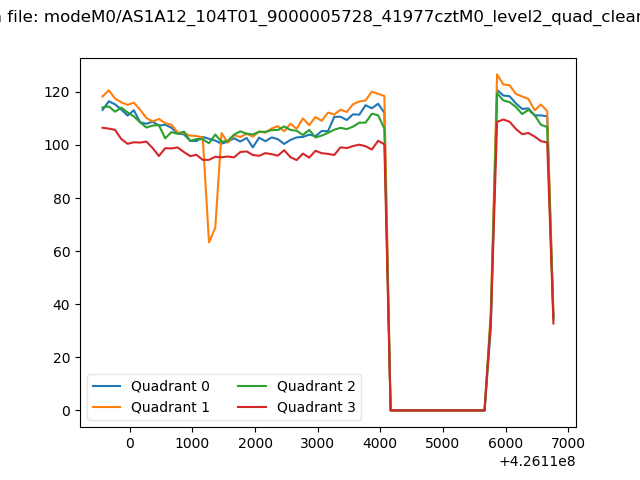 |
|
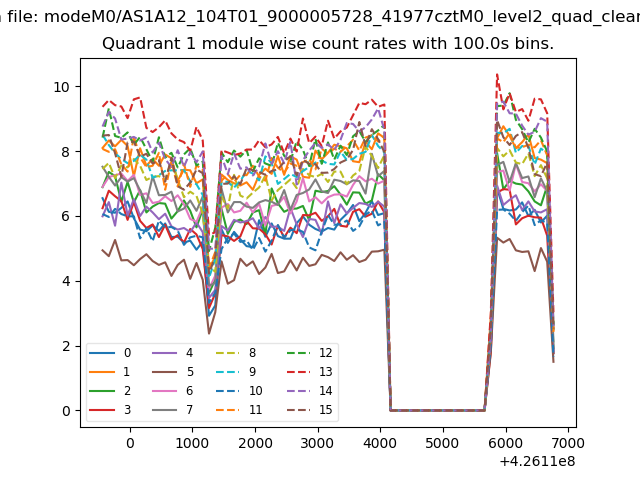
| Module-wise count rates for Quadrant A Data is divided into 100 sec bins |
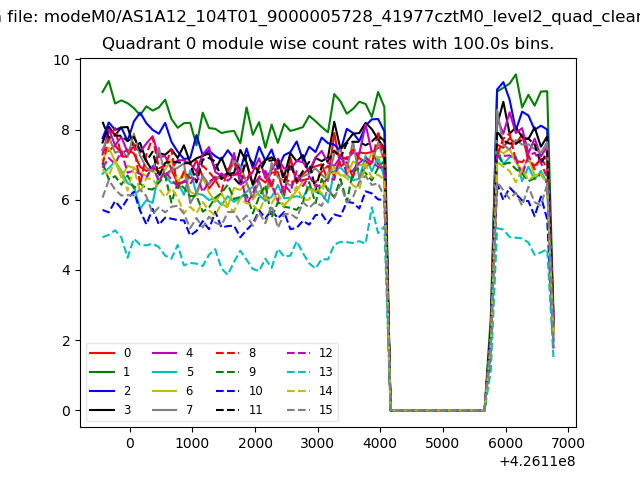 |
 |
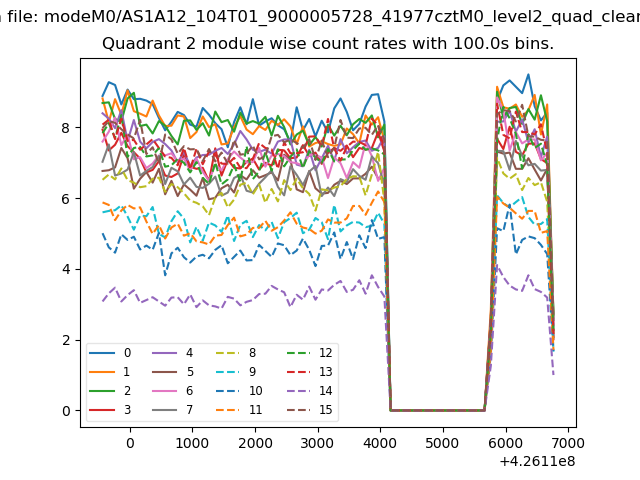
| Module-wise count rates for Quadrant B Data is divided into 100 sec bins |
 |
 |
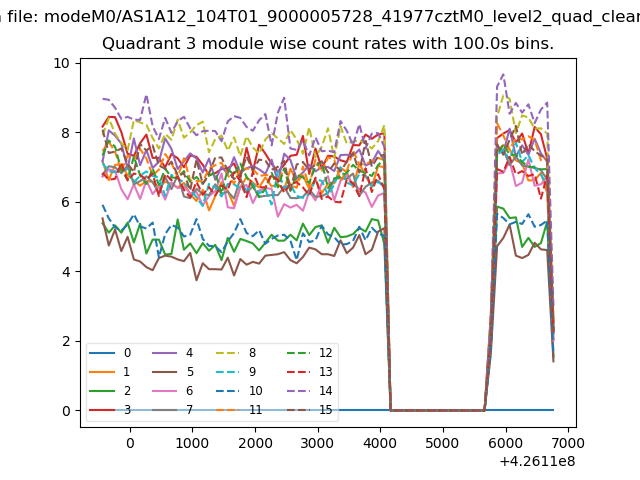
| Module-wise count rates for Quadrant C Data is divided into 100 sec bins |
 |
 |
| Module-wise count rates for Quadrant D Data is divided into 100 sec bins |
 |
 |
| Parameter | Plot |
|---|---|
| CZT HV Monitor | 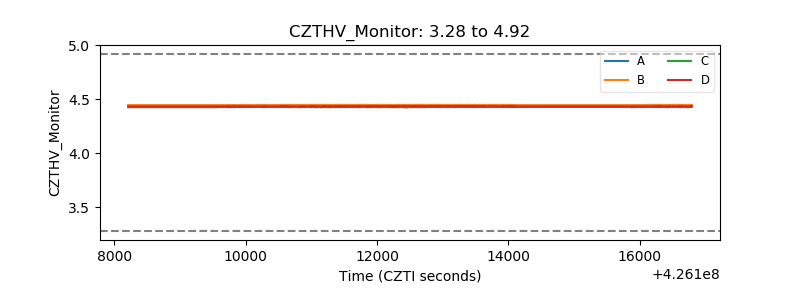 |
| D_VDD | 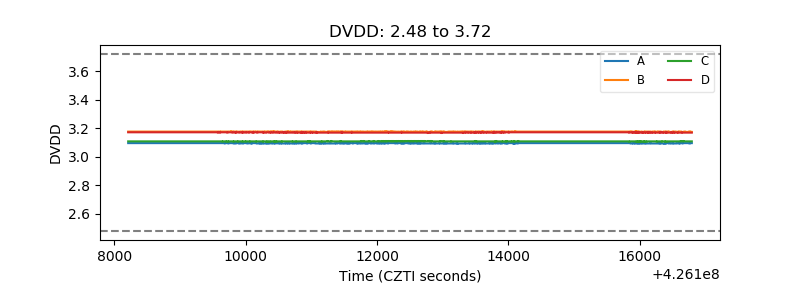 |
| Temperature 1 | 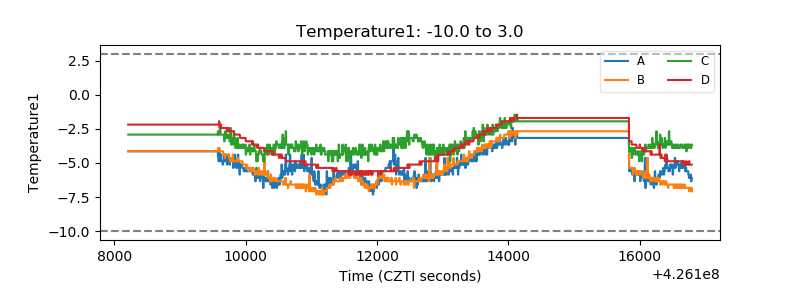 |
| Veto HV Monitor |  |
| Veto LLD | 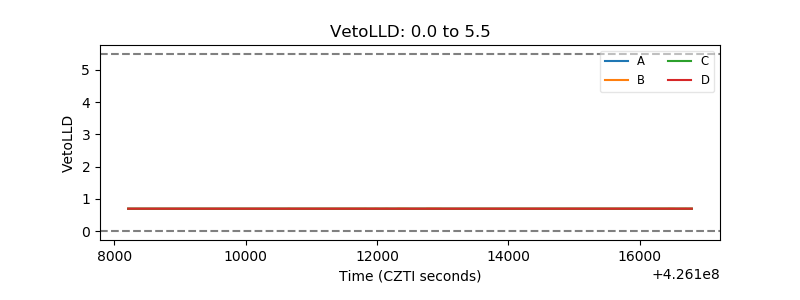 |
| Alpha Counter |  |
| _CPM_Rate |  |
| CZT Counter | 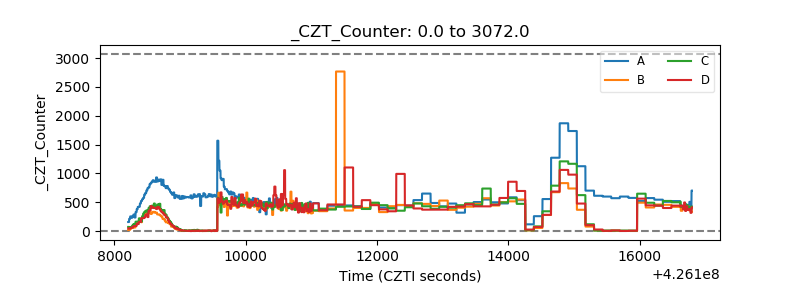 |
| +2.5 Volts monitor | 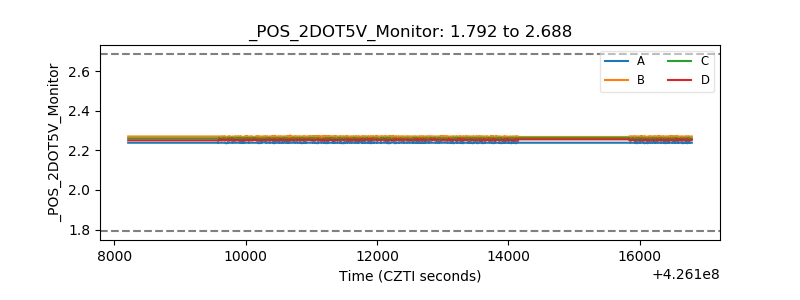 |
| +5 Volts monitor |  |
| _ROLL_ROT | 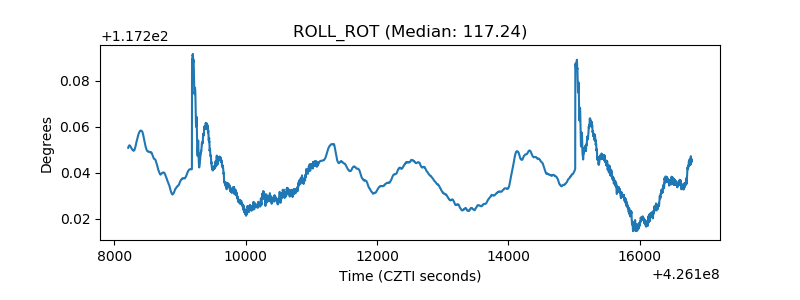 |
| _Roll_DEC | 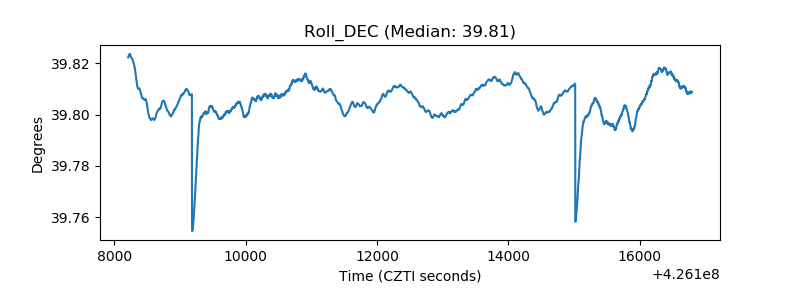 |
| _Roll_RA | 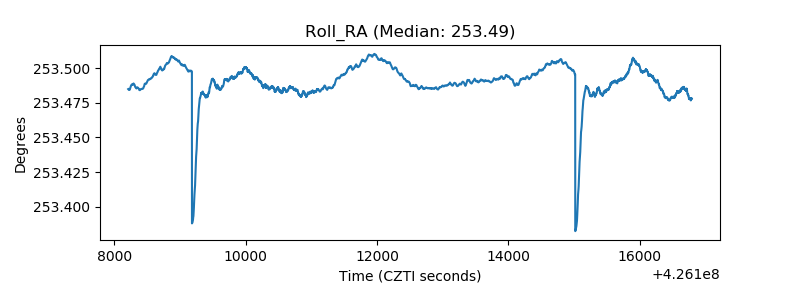 |
| Veto Counter | 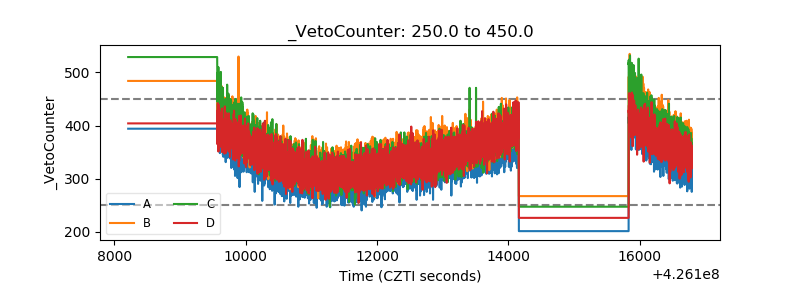 |