| Param | Original file | Final file |
|---|---|---|
| Filename | modeM0/AS1A12_104T01_9000005728_41979cztM0_level2.fits | modeM0/AS1A12_104T01_9000005728_41979cztM0_level2_quad_clean.evt |
| Size (bytes) | 287,585,280 | 86,676,480 |
| Size | 274.3 MB | 82.7 MB |
| Events in quadrant A | 2,944,118 | 575,868 |
| Events in quadrant B | 2,289,023 | 594,378 |
| Events in quadrant C | 2,375,483 | 570,495 |
| Events in quadrant D | 2,631,388 | 519,801 |
| Mode SS | |||
|---|---|---|---|
| Quadrant | BADHDUFLAG | Total packets | Discarded packets |
| A | 0 | 106 | 0 |
| B | 0 | 106 | 0 |
| C | 0 | 106 | 0 |
| D | 0 | 106 | 0 |
| Mode M0 | |||
|---|---|---|---|
| Quadrant | BADHDUFLAG | Total packets | Discarded packets |
| A | 0 | 12057 | 3 |
| B | 0 | 10480 | 2 |
| C | 0 | 10443 | 2 |
| D | 0 | 11727 | 2 |
| Mode M9 | |||
|---|---|---|---|
| Quadrant | BADHDUFLAG | Total packets | Discarded packets |
| A | 0 | 26 | 0 |
| B | 0 | 26 | 0 |
| C | 0 | 26 | 0 |
| D | 0 | 27 | 0 |
| Quadrant | Total seconds | Saturated seconds | Saturation percentage |
|---|---|---|---|
| A | 5196 | 29 | 0.558122% |
| B | 5196 | 4 | 0.076982% |
| C | 5196 | 2 | 0.038491% |
| D | 5196 | 92 | 1.770593% |
Noise dominated data is calculated using 1-second bins in cleaned event files. If a bin has >2000 counts, and if more than 50% of those come from <1% of pixels, then it is considered to be noise-dominated and hence unusable.
| Quadrant | # 1 sec bins | Bins with >0 counts | Bins with >2000 counts | High rate bins dominated by noise | Noise dominated (total time) | Noise dominated (detector-on time) | Marked lightcurve |
|---|---|---|---|---|---|---|---|
| A | 7019 | 5197 | 31 | 31 | 0.44% | 0.60% | 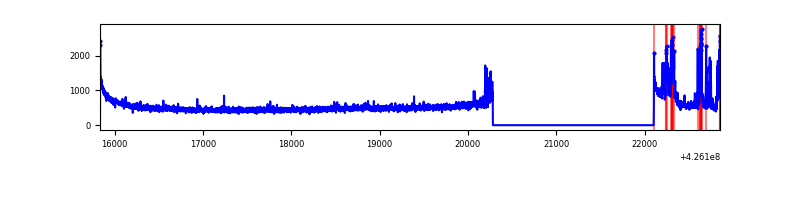 |
| B | 7019 | 5197 | 0 | 0 | 0.00% | 0.00% | 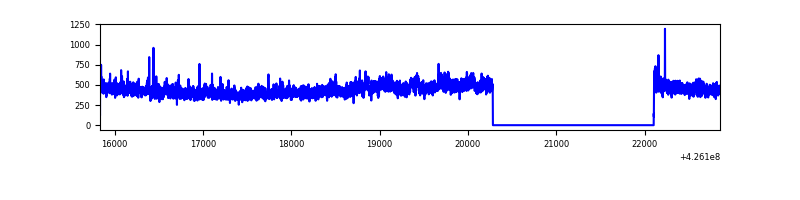 |
| C | 7019 | 5197 | 0 | 0 | 0.00% | 0.00% | 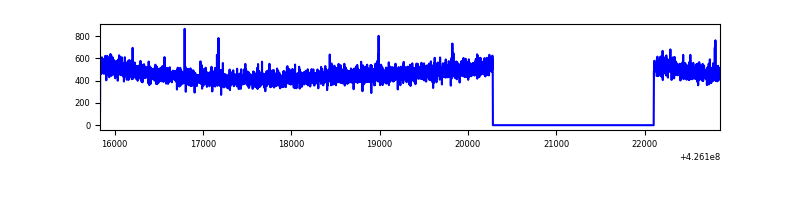 |
| D | 7019 | 5197 | 84 | 84 | 1.20% | 1.62% | 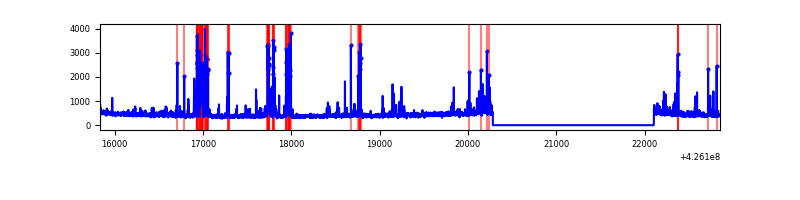 |
Top three noisy pixels from each quadrant. If the there are fewer than three noisy pixels in the level2.evt file, extra rows are filled as -1
| Pixel properties | Quadrant properties | ||||||
|---|---|---|---|---|---|---|---|
| Quadrant | DetID | PixID | Counts | Sigma | Mean | Median | Sigma |
| A | 10 | 83 | 504302 | 4400.21 | 554 | 544 | 114.5 |
| A | 15 | 223 | 272407 | 2374.66 | 554 | 544 | 114.5 |
| A | 2 | 79 | 20646 | 175.59 | 554 | 544 | 114.5 |
| B | 0 | 156 | 74287 | 689.44 | 555 | 540 | 107.0 |
| B | 0 | 190 | 23534 | 214.96 | 555 | 540 | 107.0 |
| B | 12 | 111 | 13727 | 123.28 | 555 | 540 | 107.0 |
| C | 15 | 214 | 230601 | 1803.47 | 547 | 550 | 127.6 |
| C | 8 | 79 | 8402 | 61.56 | 547 | 550 | 127.6 |
| C | 7 | 220 | 4314 | 29.51 | 547 | 550 | 127.6 |
| D | 12 | 6 | 224906 | 1706.23 | 538 | 523 | 131.5 |
| D | 13 | 249 | 211867 | 1607.08 | 538 | 523 | 131.5 |
| D | 1 | 52 | 48232 | 362.78 | 538 | 523 | 131.5 |
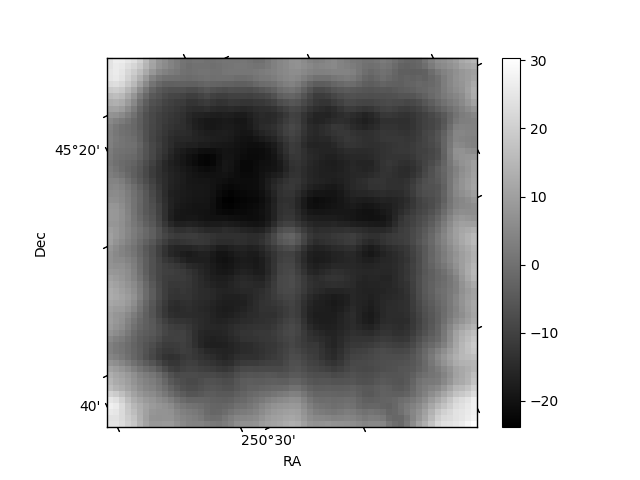
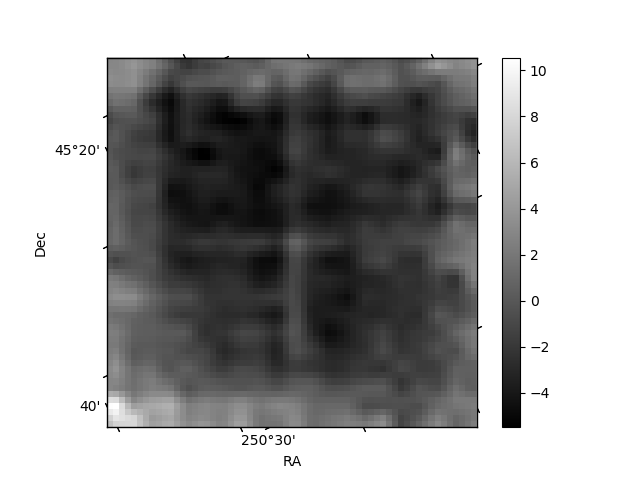
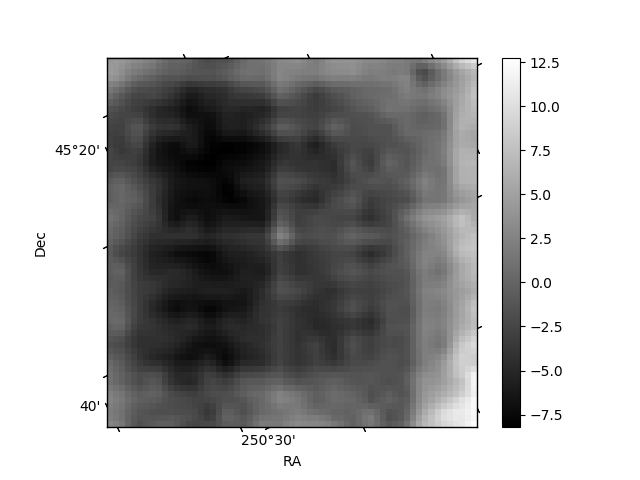
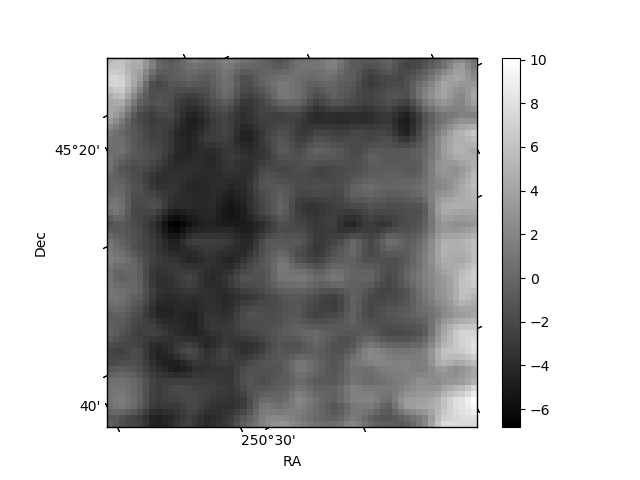
Histogram calculated using DETX and DETY for each event in the final _common_clean file
| Quadrant A | 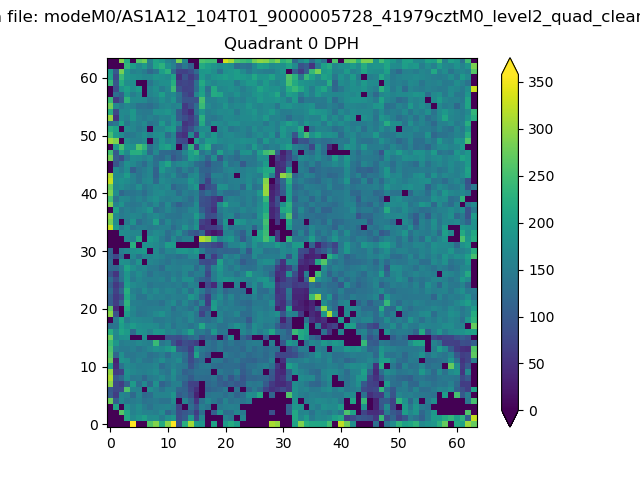 |
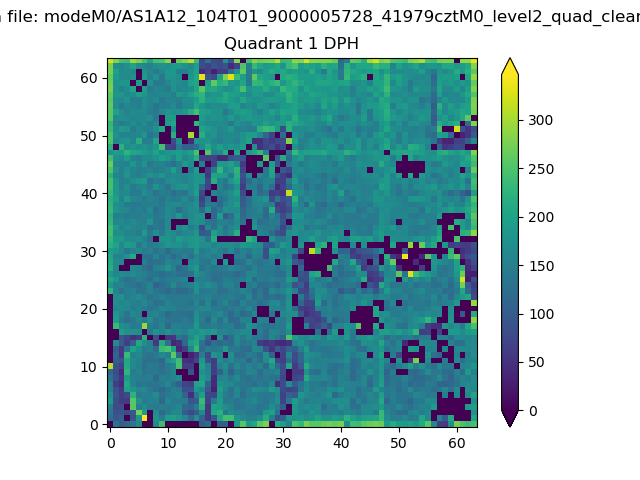 |
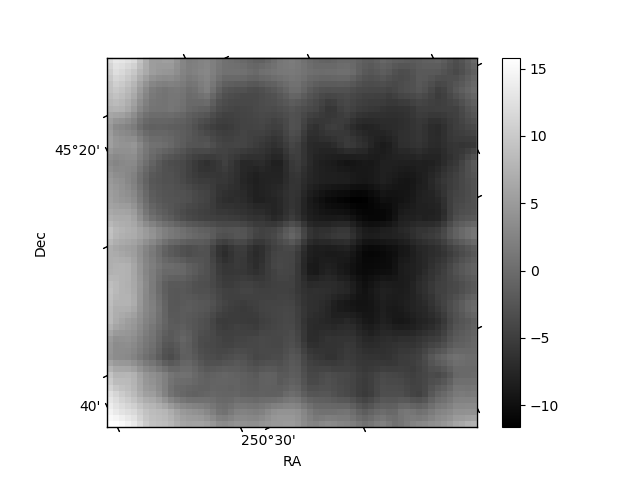
Quadrant B |
|---|---|---|---|
| Quadrant D | 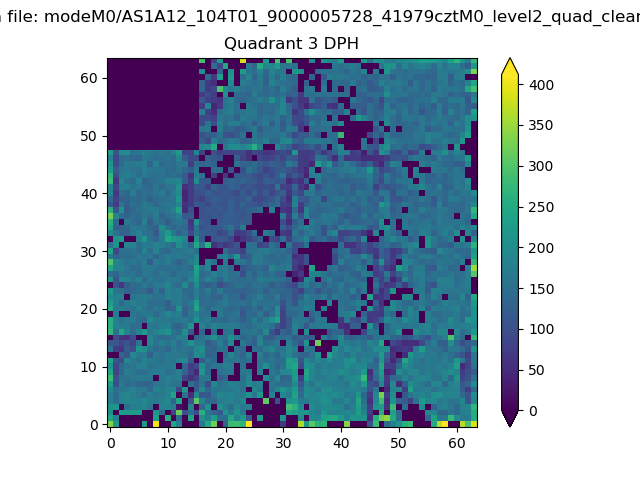 |
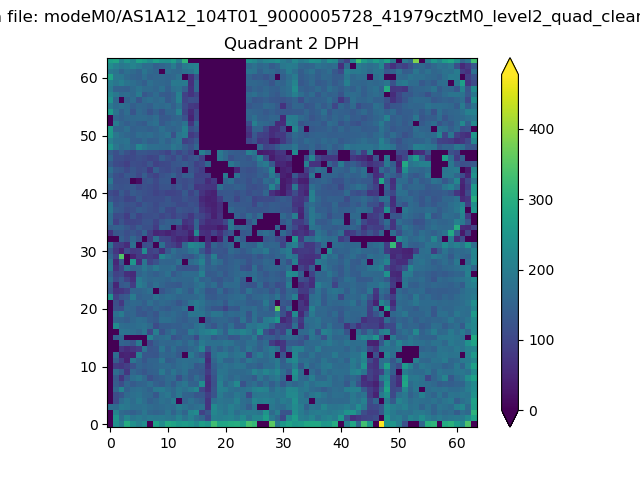 |
Quadrant C |
| Plot type | Count rate plots | Images |
|---|---|---|
| Comparison with Poisson distribution Blue bars denote a histogram of data divided into 1 sec bins. Red curve is a Poisson curve with rate = median count rate of data. |
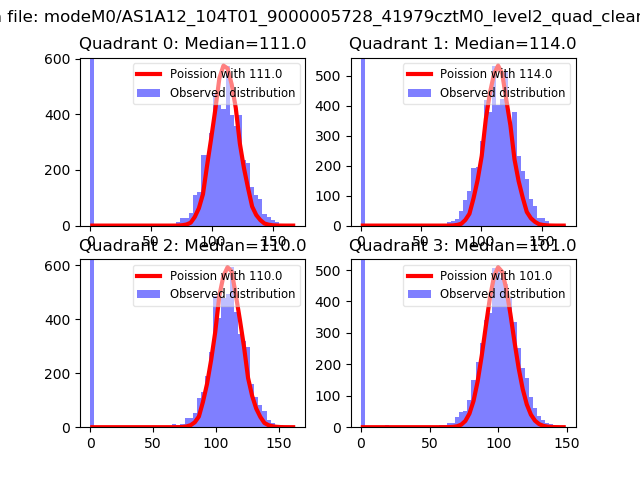 |
 |
| Quadrant-wise count rates Data is divided into 100 sec bins |
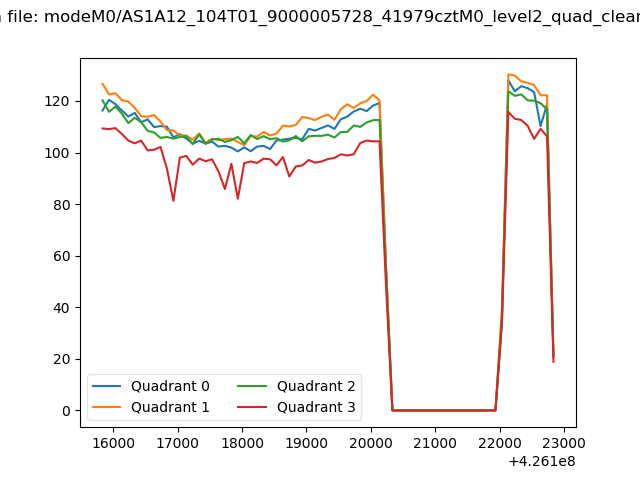 |
|
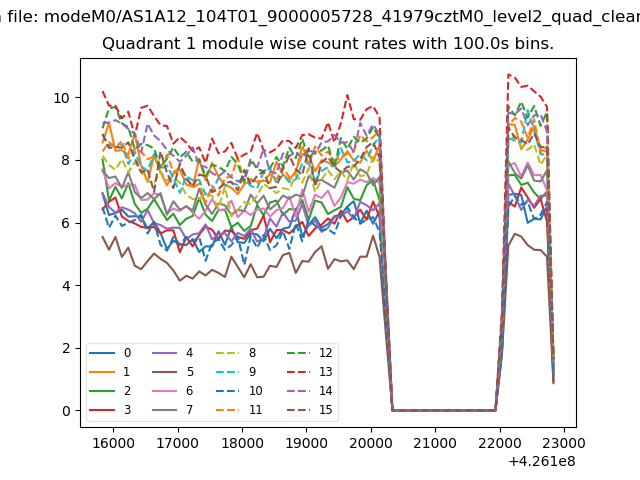
| Module-wise count rates for Quadrant A Data is divided into 100 sec bins |
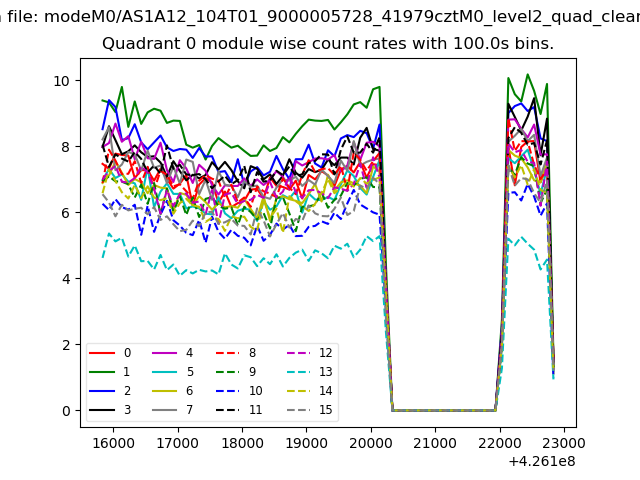 |
 |
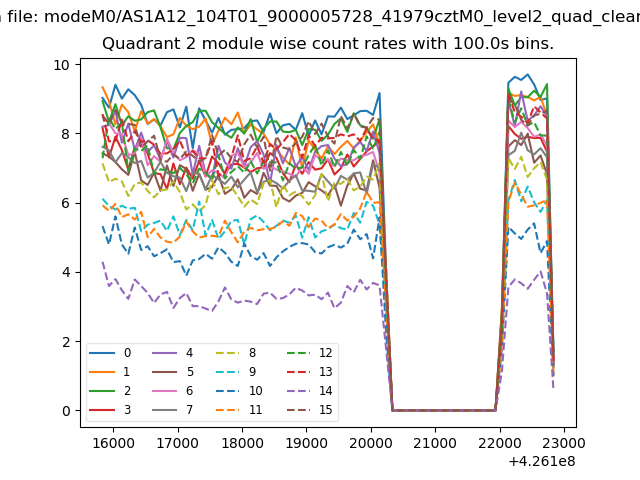
| Module-wise count rates for Quadrant B Data is divided into 100 sec bins |
 |
 |
| Module-wise count rates for Quadrant C Data is divided into 100 sec bins |
 |
 |
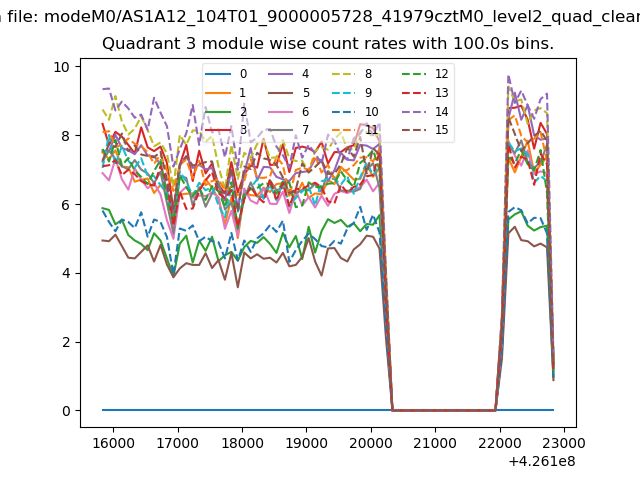
| Module-wise count rates for Quadrant D Data is divided into 100 sec bins |
 |
 |
| Parameter | Plot |
|---|---|
| CZT HV Monitor | 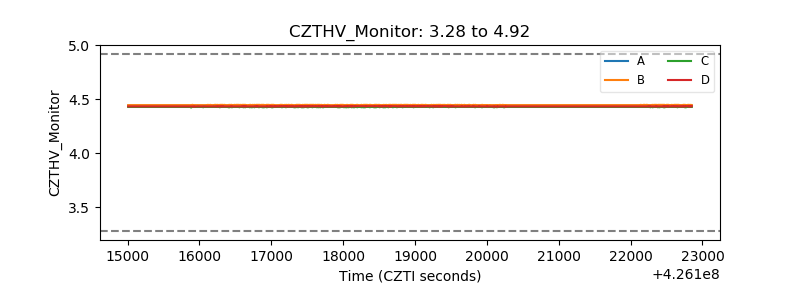 |
| D_VDD | 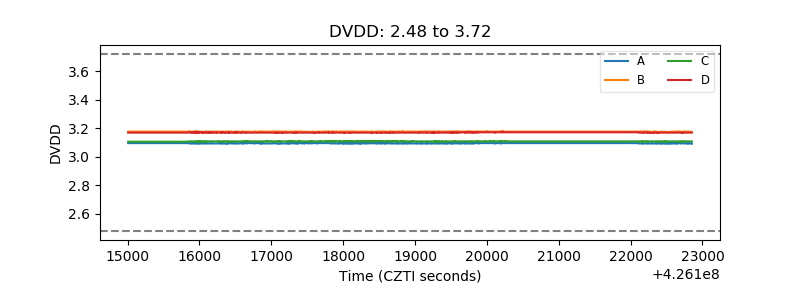 |
| Temperature 1 | 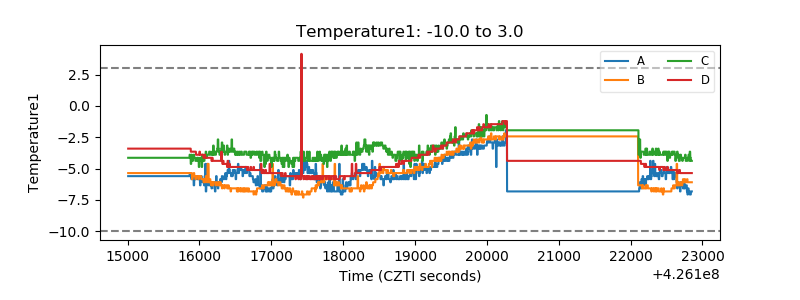 |
| Veto HV Monitor | 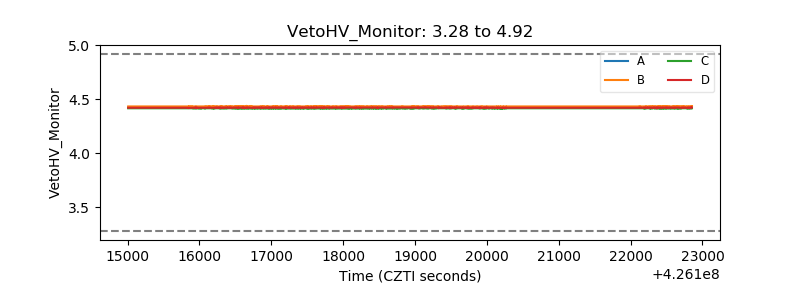 |
| Veto LLD | 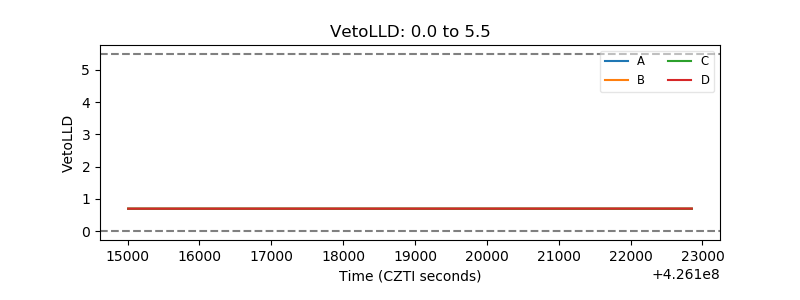 |
| Alpha Counter | 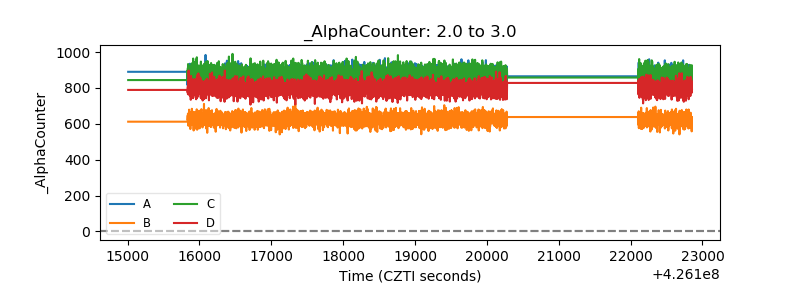 |
| _CPM_Rate | 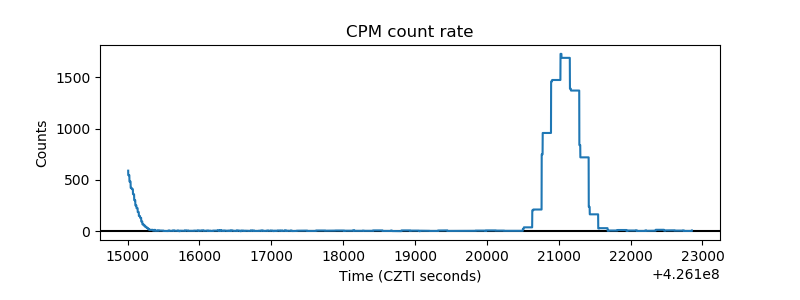 |
| CZT Counter | 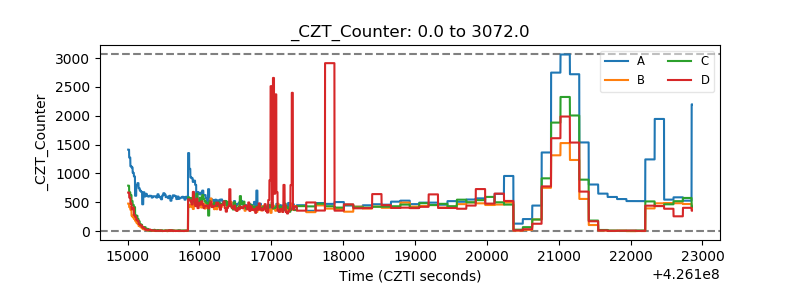 |
| +2.5 Volts monitor |  |
| +5 Volts monitor |  |
| _ROLL_ROT | 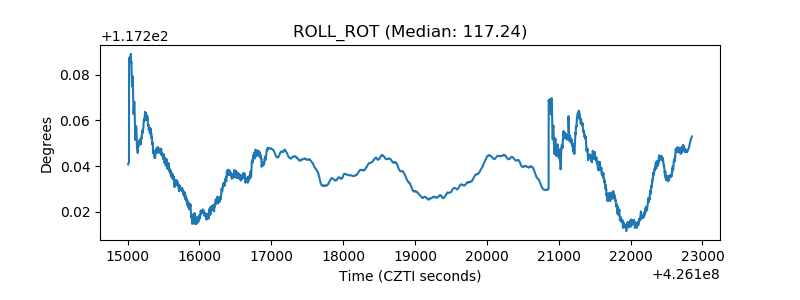 |
| _Roll_DEC |  |
| _Roll_RA | 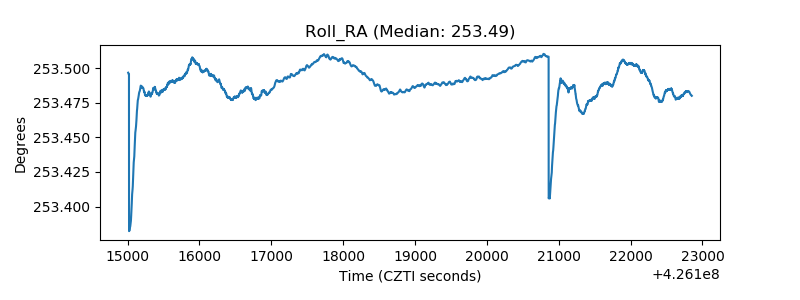 |
| Veto Counter | 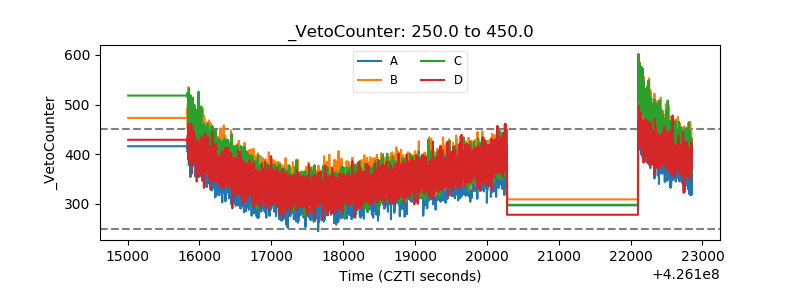 |