| Param | Original file | Final file |
|---|---|---|
| Filename | modeM0/AS1A12_104T01_9000005728_41980cztM0_level2.fits | modeM0/AS1A12_104T01_9000005728_41980cztM0_level2_quad_clean.evt |
| Size (bytes) | 302,719,680 | 88,021,440 |
| Size | 288.7 MB | 83.9 MB |
| Events in quadrant A | 3,170,867 | 585,583 |
| Events in quadrant B | 2,334,476 | 610,917 |
| Events in quadrant C | 2,376,010 | 584,009 |
| Events in quadrant D | 2,924,307 | 525,169 |
| Mode SS | |||
|---|---|---|---|
| Quadrant | BADHDUFLAG | Total packets | Discarded packets |
| A | 0 | 106 | 0 |
| B | 0 | 106 | 0 |
| C | 0 | 106 | 0 |
| D | 0 | 106 | 0 |
| Mode M0 | |||
|---|---|---|---|
| Quadrant | BADHDUFLAG | Total packets | Discarded packets |
| A | 0 | 12565 | 3 |
| B | 0 | 10433 | 2 |
| C | 0 | 10311 | 2 |
| D | 0 | 12438 | 2 |
| Mode M9 | |||
|---|---|---|---|
| Quadrant | BADHDUFLAG | Total packets | Discarded packets |
| A | 0 | 33 | 0 |
| B | 0 | 33 | 0 |
| C | 0 | 33 | 0 |
| D | 0 | 34 | 0 |
| Quadrant | Total seconds | Saturated seconds | Saturation percentage |
|---|---|---|---|
| A | 5129 | 63 | 1.228310% |
| B | 5129 | 3 | 0.058491% |
| C | 5129 | 3 | 0.058491% |
| D | 5129 | 130 | 2.534607% |
Noise dominated data is calculated using 1-second bins in cleaned event files. If a bin has >2000 counts, and if more than 50% of those come from <1% of pixels, then it is considered to be noise-dominated and hence unusable.
| Quadrant | # 1 sec bins | Bins with >0 counts | Bins with >2000 counts | High rate bins dominated by noise | Noise dominated (total time) | Noise dominated (detector-on time) | Marked lightcurve |
|---|---|---|---|---|---|---|---|
| A | 7072 | 5130 | 71 | 71 | 1.00% | 1.38% | 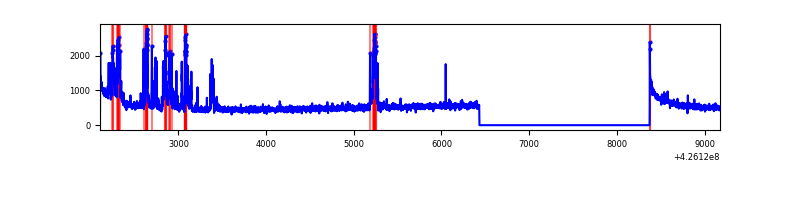 |
| B | 7072 | 5130 | 0 | 0 | 0.00% | 0.00% | 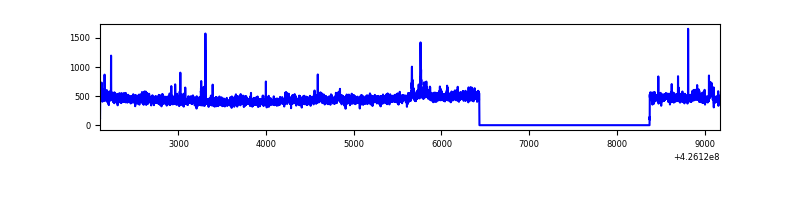 |
| C | 7072 | 5130 | 0 | 0 | 0.00% | 0.00% | 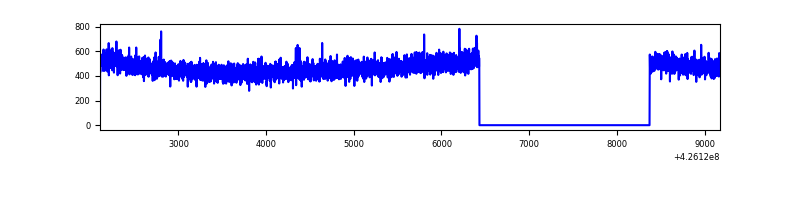 |
| D | 7072 | 5130 | 128 | 128 | 1.81% | 2.50% | 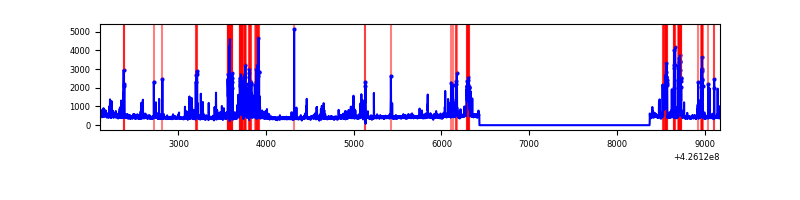 |
Top three noisy pixels from each quadrant. If the there are fewer than three noisy pixels in the level2.evt file, extra rows are filled as -1
| Pixel properties | Quadrant properties | ||||||
|---|---|---|---|---|---|---|---|
| Quadrant | DetID | PixID | Counts | Sigma | Mean | Median | Sigma |
| A | 10 | 83 | 511247 | 4462.52 | 564 | 553 | 114.4 |
| A | 15 | 223 | 445659 | 3889.4 | 564 | 553 | 114.4 |
| A | 2 | 79 | 30475 | 261.46 | 564 | 553 | 114.4 |
| B | 0 | 156 | 49328 | 451.58 | 565 | 550 | 108.0 |
| B | 0 | 190 | 31802 | 289.33 | 565 | 550 | 108.0 |
| B | 5 | 255 | 17089 | 153.12 | 565 | 550 | 108.0 |
| C | 15 | 214 | 219857 | 1714.36 | 550 | 555 | 127.9 |
| C | 8 | 79 | 6589 | 47.17 | 550 | 555 | 127.9 |
| C | 7 | 220 | 4053 | 27.35 | 550 | 555 | 127.9 |
| D | 2 | 249 | 339376 | 2553.54 | 540 | 526 | 132.7 |
| D | 13 | 249 | 210249 | 1580.45 | 540 | 526 | 132.7 |
| D | 12 | 6 | 166168 | 1248.26 | 540 | 526 | 132.7 |
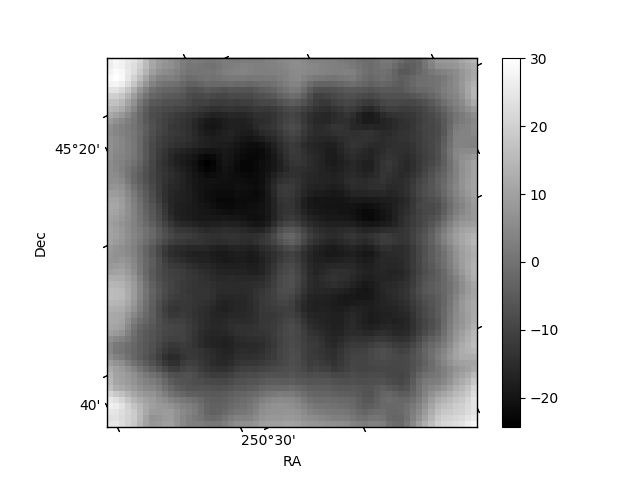
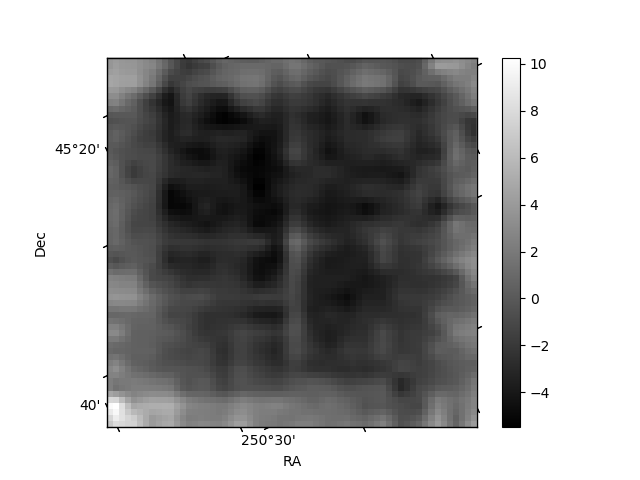
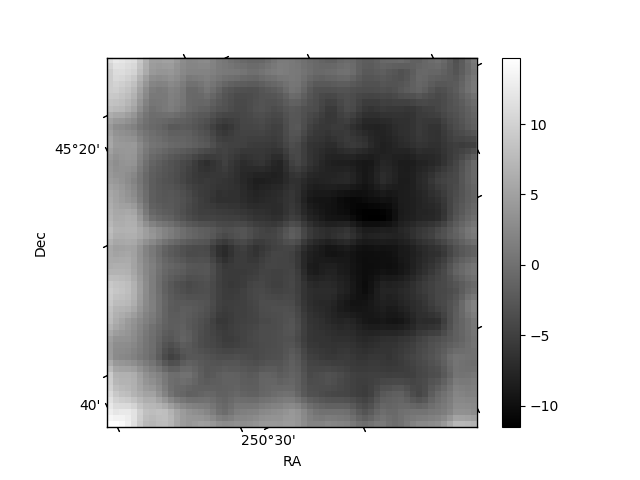
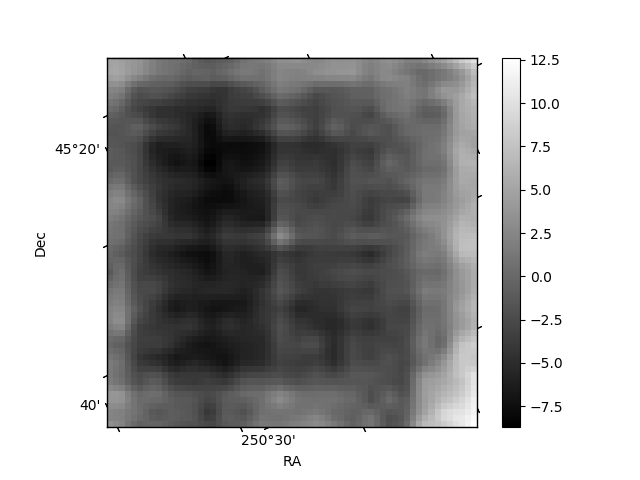
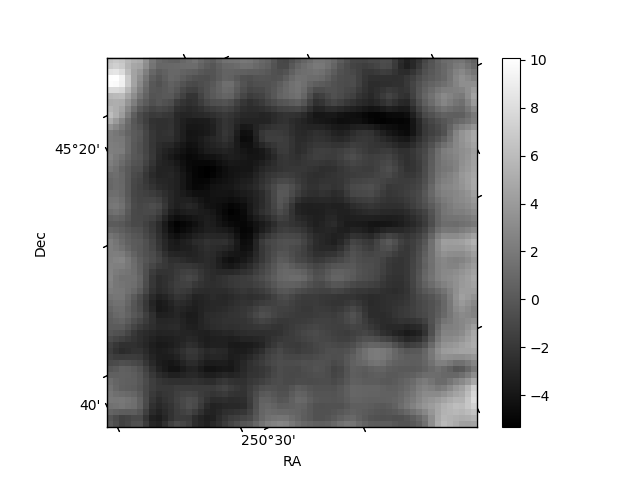
Histogram calculated using DETX and DETY for each event in the final _common_clean file
| Quadrant A | 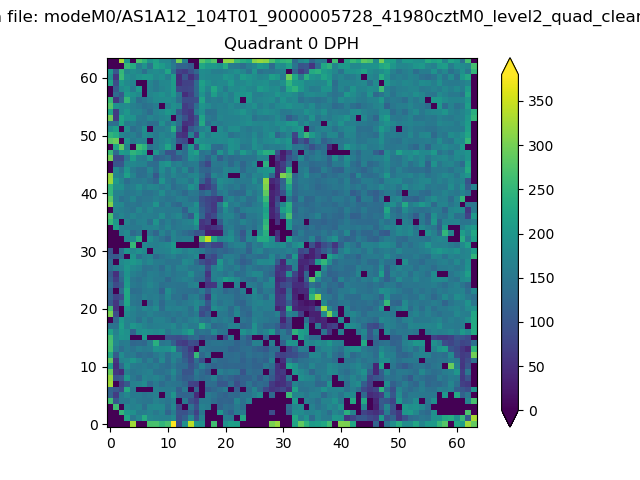 |
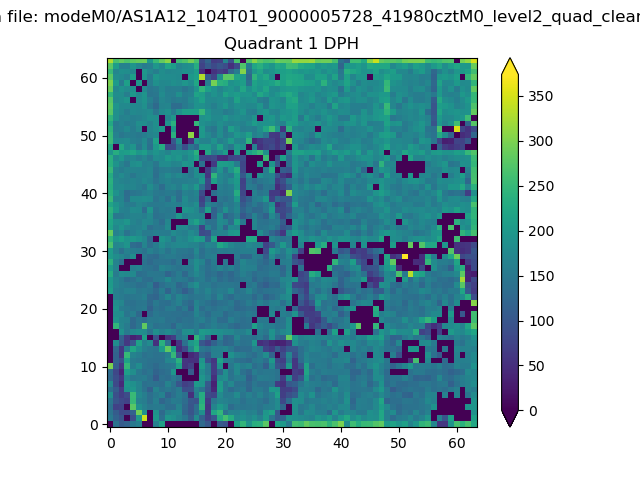 |
Quadrant B |
|---|---|---|---|
| Quadrant D | 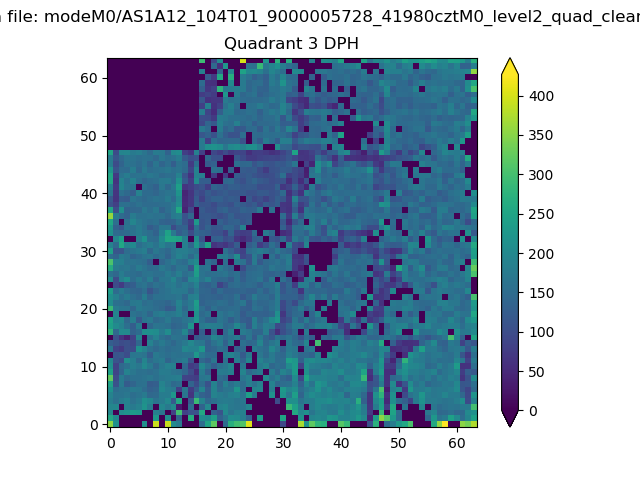 |
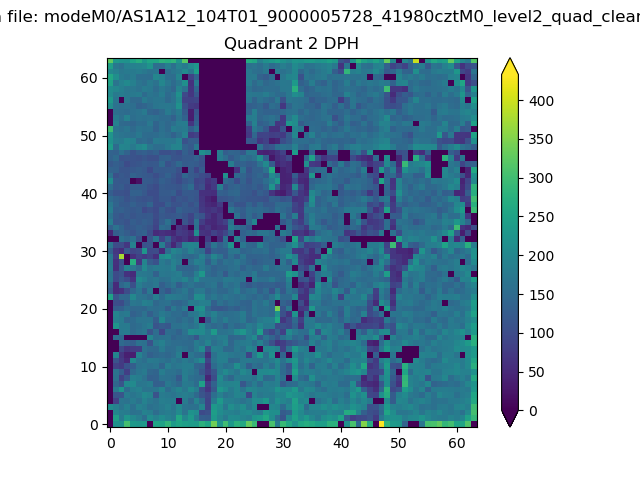 |
Quadrant C |
| Plot type | Count rate plots | Images |
|---|---|---|
| Comparison with Poisson distribution Blue bars denote a histogram of data divided into 1 sec bins. Red curve is a Poisson curve with rate = median count rate of data. |
 |
 |
| Quadrant-wise count rates Data is divided into 100 sec bins |
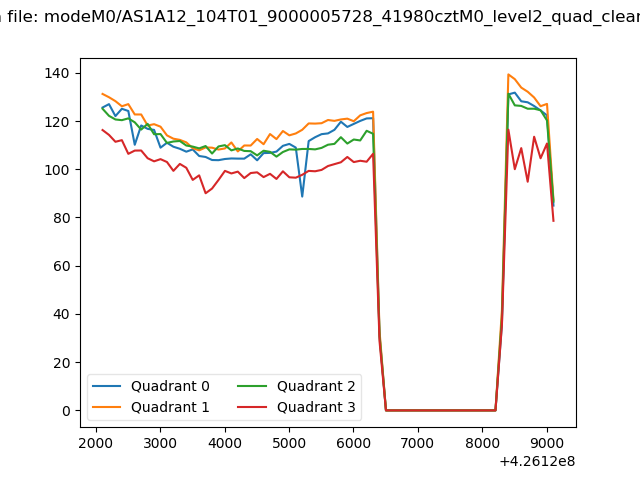 |
|
| Module-wise count rates for Quadrant A Data is divided into 100 sec bins |
 |
 |
| Module-wise count rates for Quadrant B Data is divided into 100 sec bins |
 |
 |
| Module-wise count rates for Quadrant C Data is divided into 100 sec bins |
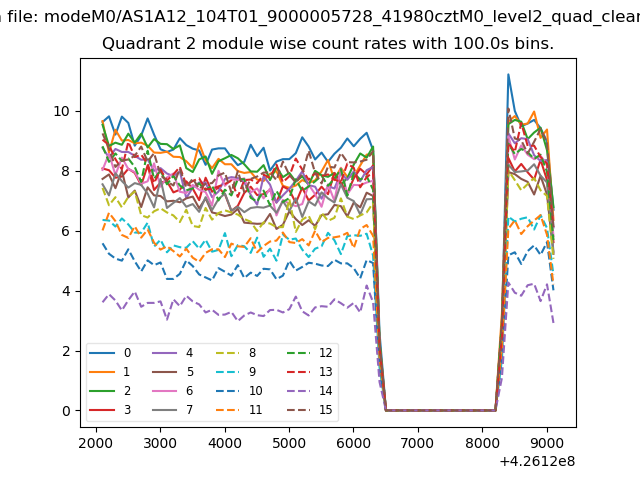 |
 |
| Module-wise count rates for Quadrant D Data is divided into 100 sec bins |
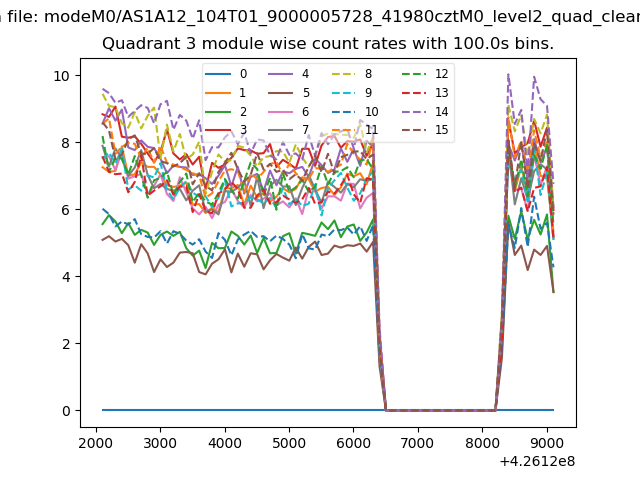 |
 |
| Parameter | Plot |
|---|---|
| CZT HV Monitor | 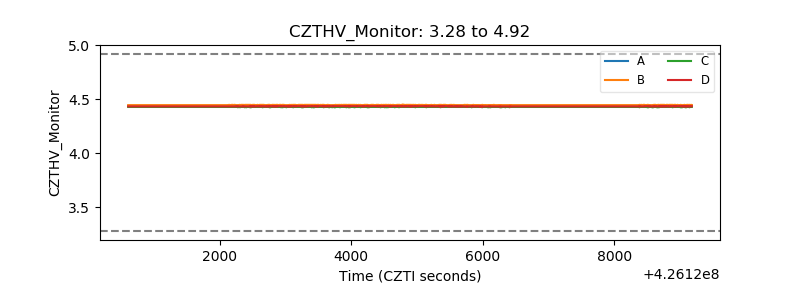 |
| D_VDD | 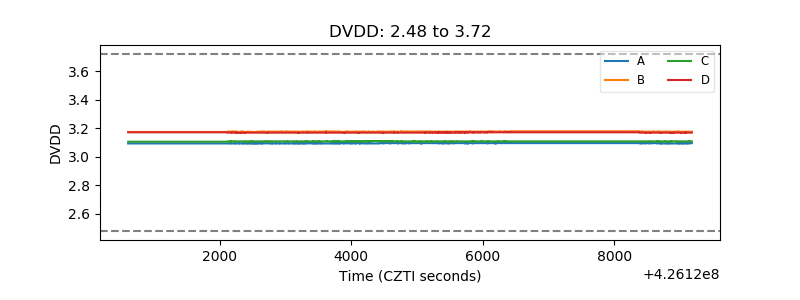 |
| Temperature 1 | 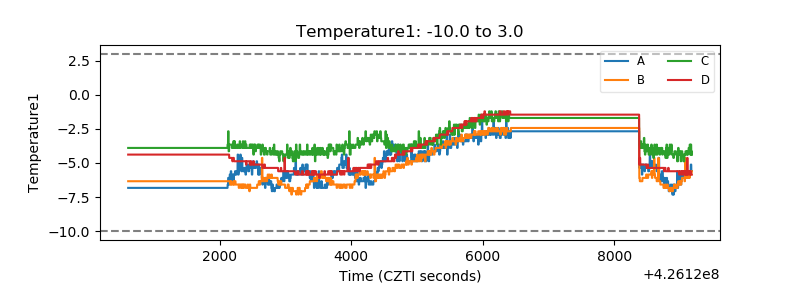 |
| Veto HV Monitor | 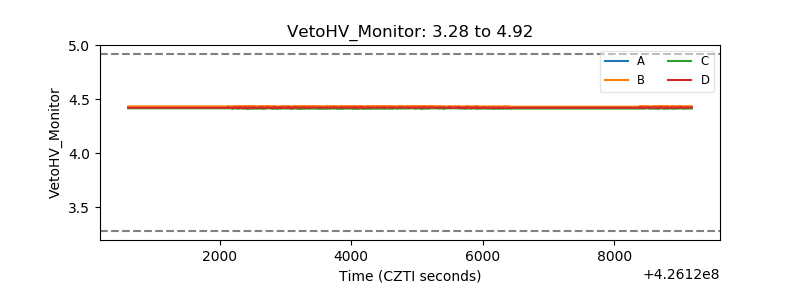 |
| Veto LLD | 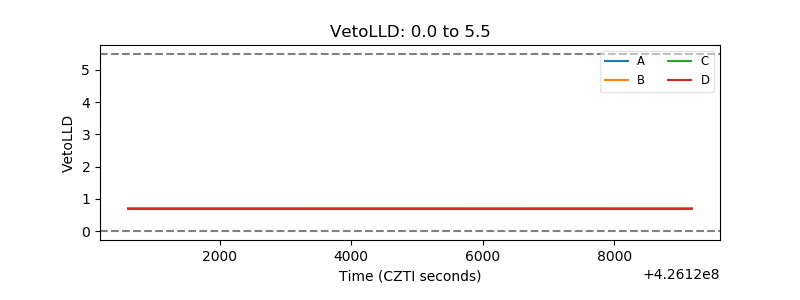 |
| Alpha Counter | 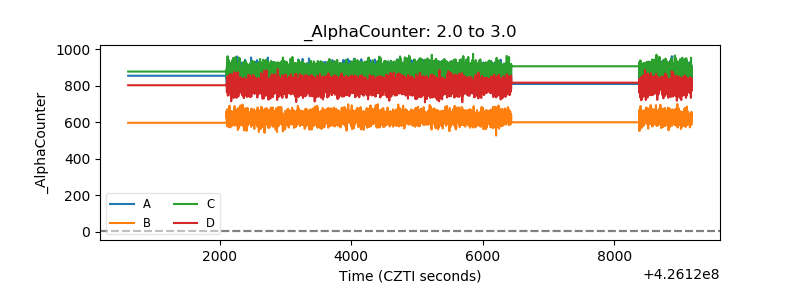 |
| _CPM_Rate | 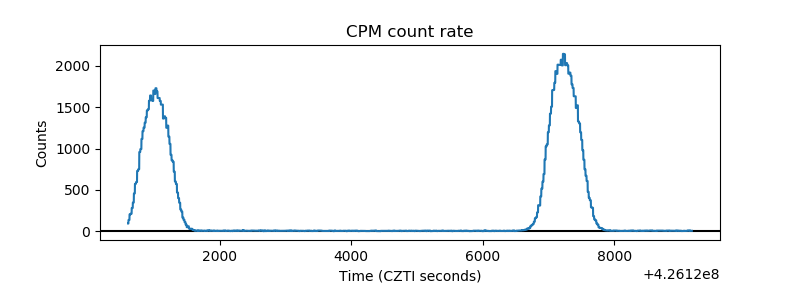 |
| CZT Counter | 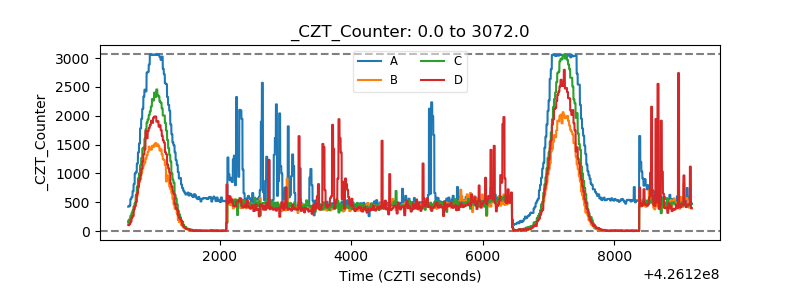 |
| +2.5 Volts monitor |  |
| +5 Volts monitor | 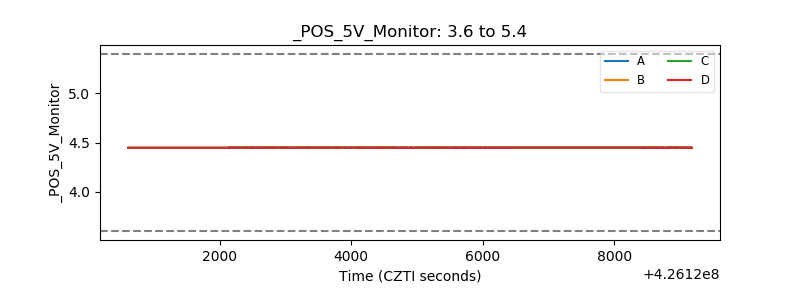 |
| _ROLL_ROT | 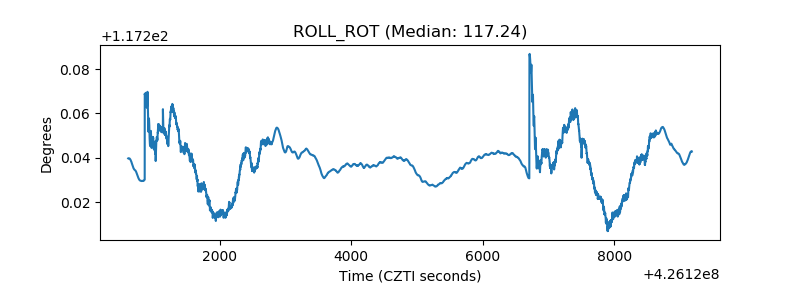 |
| _Roll_DEC | 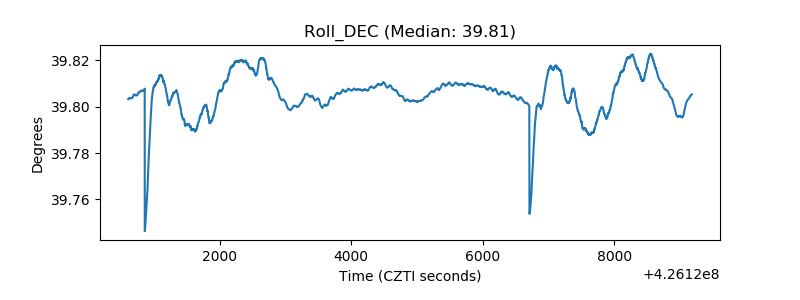 |
| _Roll_RA | 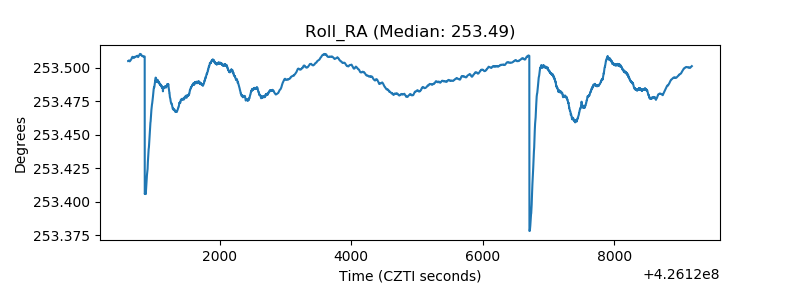 |
| Veto Counter | 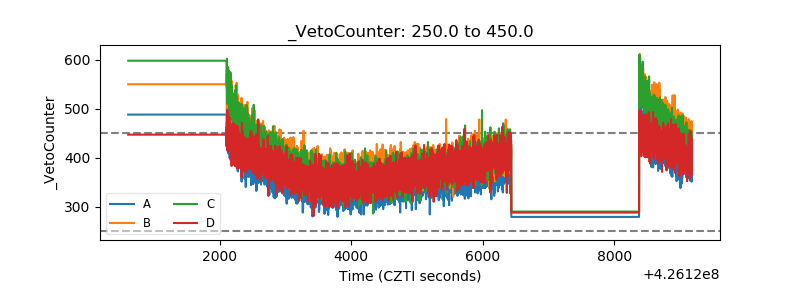 |